


瀑布图
背景
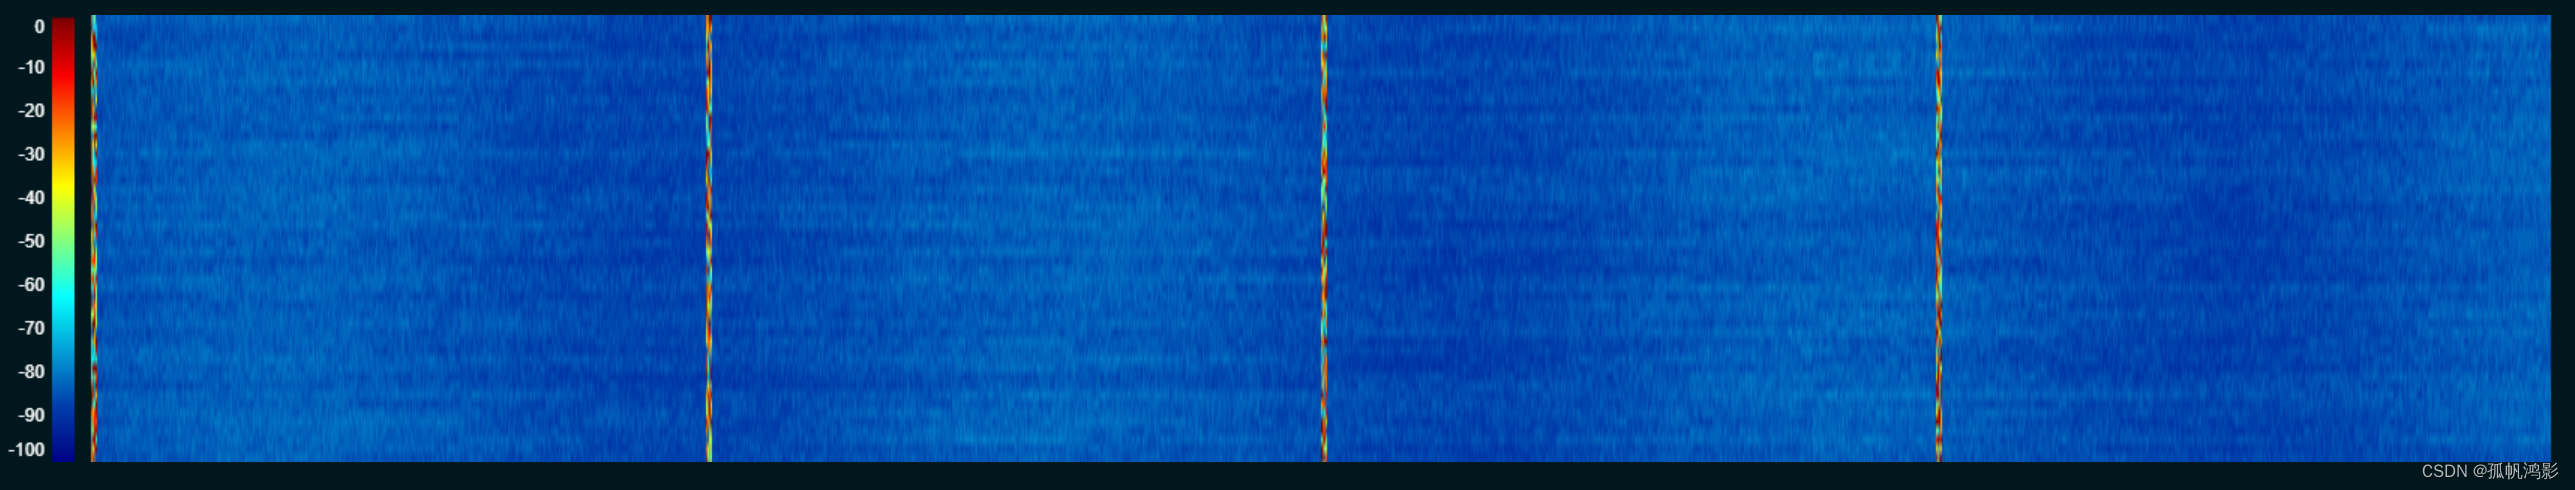
在图表展示的业务场景中,常用的各种直方图、折线图和饼图;但是想要对大量流式数据有个直观的展示,这就需要瀑布图了。瀑布图多应用于频谱数据管理,通过对比不同的色差很容易找到对应的频率,接下来我们展示一下Vue3如何实现一个瀑布图的效果。
原理
利用canvas的drawImage API,通过将不同数值的数据转化为色素点,流式数据的一帧一帧的加载,整个图像就像瀑布一样流下来,所以被称为瀑布图,对于寻找对应频率信号很有用。
canvas 的 drawImage 方法介绍
const ctx = canvas.getContext('2d')
ctx.drawImage(image, sx, sy, sw, sh, dx, dy, dw, dh)
- image 表示页面的图片,或者canvas图像
- 参数sx, sy 代表从源图片的剪切坐标
- 参数 sw, sh 代表从源图片的剪切宽高
- 参数dx, dy 代表目标图片/canvas的粘贴坐标
- 参数 sw, sh 代表目标图片/canvas的粘贴宽高
代码
接下来,我们一起看代码实现
初始化容器和瀑布图数据
-
创建一个div,作为我们瀑布图的容器
<template> <div ref="heatmap" style="height: 300px;" /> </template> <script setup> const heatmap = ref(null) </script> -
定义props传入data,通过监听data的变化,更新瀑布图
  const props = defineProps({
    data: {
      type: Array,
      default: () => []
    },
    minDb: {
      type: Number, // 颜色图例最小值
      default: 0
    },
    maxDb: {
      type: Number, // 颜色图例最大值
      default: 0
    }
  })
  const legendWidth = 120 // 图例宽度
  const tempHeight = 50 // 临时画布高度,也是一页瀑布图帧数
  const containerHeight = 300 // 容器高度
  watchEffect(() => {
    updateWaterFallPlot(props.data)
  })
定义 canvas 上下文和 引用ColorMap 完成左侧图例
首先下载ColorMap, 命令行中执行npm install ColorMap -S命令
import ColorMap from 'colormap'

const state = reactive({
  canvasCtx: null,
  fallsCanvasCtx: null,
  legendCanvasCtx: null,
  canvasWidth: 0,
  colormap: []
})
初始化主要变量
const initComponent = () => {
  if (!heatmap.value) {
    return
  }
  // 获取容器宽高
  const { clientWidth, clientHeight } = heatmap.value
  // 初始化颜色图
  const colormap = initColormap()
  // 创建画布
  const { fallsCanvasCtx, canvasCtx, legendCanvasCtx, canvas } = createCanvas(clientWidth, clientHeight)
  // 绘制左边颜色图图例
  drawLegend(canvasCtx, legendCanvasCtx, colormap)
  state.canvasCtx = canvasCtx
  state.colormap = colormap
  state.fallsCanvasCtx = fallsCanvasCtx
  state.legendCanvasCtx = legendCanvasCtx
  state.canvasDom = canvas
}
- canvasCtx 瀑布图canvas的上下文
- fallsCanvasCtx 临时画布上下文,用于平铺所有数据
- legendCanvasCtx 图例canvas的上下文,用于画图例
- createCanvas 创建画布,生成三个上下文
- drawLegend 创建颜色图例
createCanvas 创建画布
创建主体的画布,图例画布和临时画布
const createCanvas = (width, height) => {
  // 创建用来绘制的画布
  const fallsCanvas = document.createElement('canvas')
  fallsCanvas.width = 0
  fallsCanvas.height = height
  const fallsCanvasCtx = fallsCanvas.getContext('2d')

  // 创建最终展示的画布
  const canvas = document.createElement('canvas')
  canvas.className = 'main_canvas'
  canvas.height = height - 2
  canvas.width = width
  heatmap.value.appendChild(canvas) // 唯一显示的canvas
  const canvasCtx = canvas.getContext('2d')

  // 创建图例图层画布
  const legendCanvas = document.createElement('canvas')
  legendCanvas.width = 1
  const legendCanvasCtx = legendCanvas.getContext('2d')
  return {
    fallsCanvasCtx,
    canvasCtx,
    legendCanvasCtx,
    canvas
  }
}
绘制颜色图例
// 绘制颜色图图例
const drawLegend = (canvasCtx, legendCanvasCtx, colormap) => {
  const imageData = legendCanvasCtx.createImageData(1, colormap.length)
  // 遍历颜色图集合
  for (let i = 0; i < colormap.length; i++) {
    const color = colormap[i]
    imageData.data[imageData.data.length - i * 4 + 0] = color[0]
    imageData.data[imageData.data.length - i * 4 + 1] = color[1]
    imageData.data[imageData.data.length - i * 4 + 2] = color[2]
    imageData.data[imageData.data.length - i * 4 + 3] = 255
  }
  // 将颜色集合放到图例上
  legendCanvasCtx.putImageData(imageData, 0, 0)
  canvasCtx.drawImage(
    legendCanvasCtx.canvas,
    0, // source x
    0, // source y
    1, // source width
    colormap.length, // souce height
    40, // d x 目标
    0, // d y 目标
    legendWidth / 4, // d width
    canvasCtx.canvas.height// d height
  )
  canvasCtx.font = '12px Arial'
  canvasCtx.textAlign = 'end'
  canvasCtx.fillStyle = '#fff'
  // 绘制图例刻度
  const x = (legendWidth * 3) / 4 - 10
  canvasCtx.fillText(100, x, 12)
  canvasCtx.fillText(0, x, containerHeight - 6)
  const dur = (props.maxDb - props.minDb) / 10
  for (let i = 1; i < 10; i++) {
    canvasCtx.fillText(props.minDb + dur * i, x, containerHeight * (10 - i) / 10 + i)
  }
}
根据传入data更新瀑布图 updateWaterFallPlot
// 统计更新渲染次数
const renderNum = ref(0)
const updateWaterFallPlot = data => {
  const len = data.length
  if (len !== state.canvasWidth) {
    state.canvasWidth = len
    state.fallsCanvasCtx.canvas.width = len
  }
  renderNum.value ++
  // 先在用于绘制的画布上绘制图像
  addWaterfallRow(data)
  // 再将画好的图像显示再页面中
  drawFallsOnCanvas(len)

  if (renderNum.value > tempHeight) {
    // 如果渲染次数大于容器高度,更新容器高度
    state.canvasDom.height = renderNum.value * containerHeight / tempHeight
  }
}
临时画布上绘制图像 addWaterfallRow
const firstRender = ref(true)
const addWaterfallRow = data => {
  // 先将已生成的图像向下移动一个像素, 第一次渲染不用移动
  const height = 50 // 临时画布的高度
  if (!firstRender.value) {
    state.fallsCanvasCtx.drawImage(
      state.fallsCanvasCtx.canvas, // 当前cavas
      0,
      0,
      data.length,
      height,
      0,
      1,
      data.length,
      height
    )
  } else {
    firstRender.value = false
  }

  // 再画一行的数据
  const imageData = rowToImageData(data)
  state.fallsCanvasCtx.putImageData(imageData, 0, 0)
}
绘制单行图像
const rowToImageData = data => {
  const imageData = state.fallsCanvasCtx.createImageData(data.length, 1)
  for (let i = 0; i < imageData.data.length; i += 4) {
    const cIndex = getCurrentColorIndex(data[i / 4])
    const color = state.colormap[cIndex]
    imageData.data[i + 0] = color[0]
    imageData.data[i + 1] = color[1]
    imageData.data[i + 2] = color[2]
    imageData.data[i + 3] = 255
  }
  return imageData
}

// 获取数据对应的颜色图索引
const getCurrentColorIndex = data => {
  const outMin = 0
  const outMax = state.colormap.length - 1
  if (data <= props.minDb) {
    return outMin
  } else if (data >= props.maxDb) {
    return outMax
  } else {
    return round(((data - props.minDb) / (props.maxDb - props.minDb)) * outMax)
  }
}
将临时画布的图像剪切到正式瀑布图上 drawFallsOnCanvas
// 将绘制好的图像显示在主页面中
const drawFallsOnCanvas = len => {
  const canvasWidth = state.canvasCtx.canvas.width
  const canvasHeight = state.canvasCtx.canvas.height
  if (!state.fallsCanvasCtx.canvas.width) return
  state.canvasCtx.drawImage(
    state.fallsCanvasCtx.canvas,
    -1,
    0,
    len + 1,
    tempHeight,
    legendWidth + 5,
    0,
    canvasWidth - legendWidth - 25,
    canvasHeight
  )
}
调用示例
  <waterFallPlot
    :data="dataList"
    :min-db="100"
    :max-db="0"
  />
模拟流数据
function getData(n, num = 90) {
  var arr = [],
    i,
    a,
    b,
    c,
    spike;
  for (i = 0; i < n; i = i + 1) {
    if (i % 10 === 0) {
      a = 2 * Math.random();
    }
    if (i % 100 === 0) {
      b = 2 * Math.random();
    }
    if (i % 1000 === 0) {
      c = 2 * Math.random();
    }
    if (i % 500 < 5) {
      spike = 100 * Math.random();
    } else {
      spike = 0;
    }
    arr.push(2 * Math.sin(i / 100) + a + b + c + spike + Math.random() * 5 - num);
  }
  return arr;
}
const dataList = ref([])
setInterval(() => {
  dataList.value = getData(1000, 90)
}, 1000)
瀑布图展示


 264
264


 被折叠的 条评论
为什么被折叠?
被折叠的 条评论
为什么被折叠?
 到【灌水乐园】发言


