


#量化分析入门4:双均线策略的python程序
#作者:冯德平(山野雪人)
# 用到的库函数:
import numpy as np
import matplotlib.pyplot as plt
import pandas as pd
#正常显示画图时出现的中文和负号:
from pylab import mpl
mpl.rcParams['font.sans-serif']=['SimHei'] #显示中文
#mpl.rcParams['axes.unicode_minus']=False #显示正负号
#读取文件中的数据,只要收盘价:
#df=pd.read_csv(r'D:\temp\600882.csv',index_col='Date',usecols=[0,1])
#时间作为索引值:index_col='Date',读取了两列数据,时间和收盘价:usecols=[0,1]
#这里需要将时间类型转换成字符,要不然绘图会有错误,可以这样写
df=pd.read_csv(r'D:\temp\600882.csv',index_col='Date',parse_dates=['Date'],usecols=[0,1])
#print(df)
'''
Close Price
Date
2018-02-01 8.950000
2018-02-02 8.820000
2018-02-05 8.750000
2018-02-06 8.720000
2018-02-07 8.730000
... ...
2021-09-16 51.500000
2021-09-17 51.349998
2021-09-22 51.700001
2021-09-23 53.980000
2021-09-24 57.900002
[884 rows x 1 columns]
'''
#绘图:
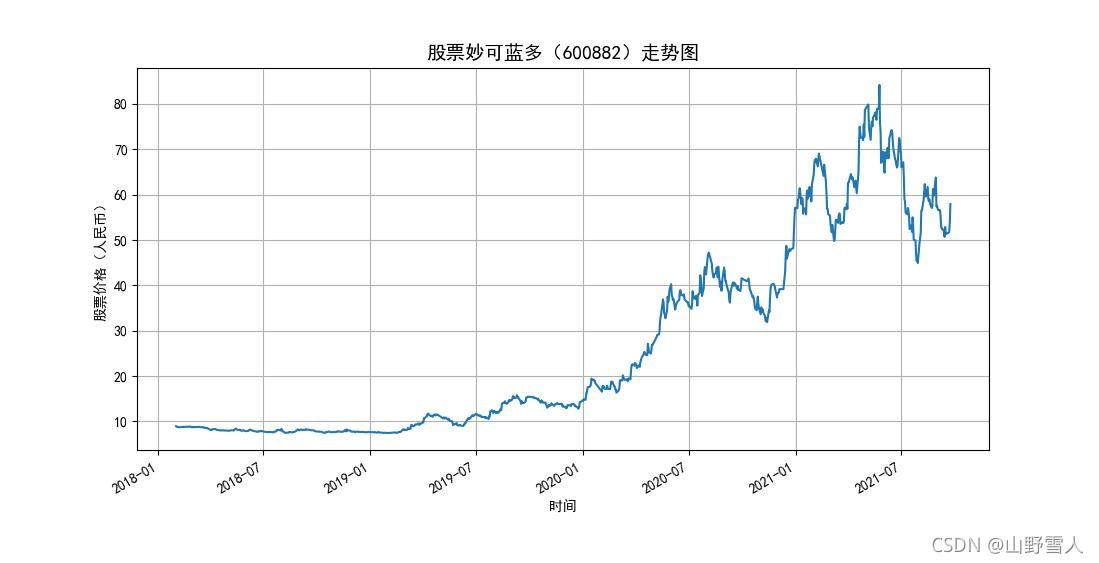
df['Close Price'].plot(figsize = (15, 8)) #图形尺寸
plt.grid(1) #画格子
plt.title('股票妙可蓝多(600882)走势图',fontsize=14) #标题
plt.ylabel("股票价格(人民币)") #在纵轴上标注文字
plt.xlabel("时间") #在横轴上标注文字
plt.show() #显示图形
#在数据帧中增加一列20天和一列50天的SMA(简单移动平均)数据
#20天的SMA数据:
df['20_SMA'] =df['Close Price'].rolling(window = 20, min_periods = 1).mean()
#移动窗口滚动值为20:window = 20,最小的观测数值个数为1:min_periods = 1
#50天的SMA数据:
df['50_SMA'] =df['Close Price'].rolling(window = 50, min_periods = 1).mean()
# 显示数据:
#print(df)
'''
Close Price 20_SMA 50_SMA
Date
2018-02-01 8.950000 8.9500 8.9500
2018-02-02 8.820000 8.8850 8.8850
2018-02-05 8.750000 8.8400 8.8400
2018-02-06 8.720000 8.8100 8.8100
2018-02-07 8.730000 8.7940 8.7940
... ... ... ...
2021-09-16 51.500000 56.1525 55.1222
2021-09-17 51.349998 55.8220 55.0286
2021-09-22 51.700001 55.5540 54.9494
2021-09-23 53.980000 55.3780 54.8878
2021-09-24 57.900002 55.2115 54.9188
[884 rows x 3 columns]
'''
df['Signal'] = 0.0
df['Signal'] = np.where(df['20_SMA'] > df['50_SMA'], 1.0, 0.0)
#np.where(condition, x, y) #满足条件(condition),输出x,不满足输出y。
df['Position'] = df['Signal'].diff() #这句表示:Position(i)=Signal(i)-Signal(i-1)
df=round(df,2) #保留小数点后两位
print(df) #显示
df.to_csv(r'D:\temp\600882.csv') #保存数据
'''
Close Price 20_SMA 50_SMA Signal Position
Date
2018-02-01 8.95 8.95 8.95 0.0 NaN
2018-02-02 8.82 8.88 8.88 0.0 0.0
2018-02-05 8.75 8.84 8.84 0.0 0.0
2018-02-06 8.72 8.81 8.81 0.0 0.0
2018-02-07 8.73 8.79 8.79 0.0 0.0
... ... ... ... ... ...
2021-09-16 51.50 56.15 55.12 1.0 0.0
2021-09-17 51.35 55.82 55.03 1.0 0.0
2021-09-22 51.70 55.55 54.95 1.0 0.0
2021-09-23 53.98 55.38 54.89 1.0 0.0
2021-09-24 57.90 55.21 54.92 1.0 0.0
[884 rows x 5 columns]
'''
#绘图:
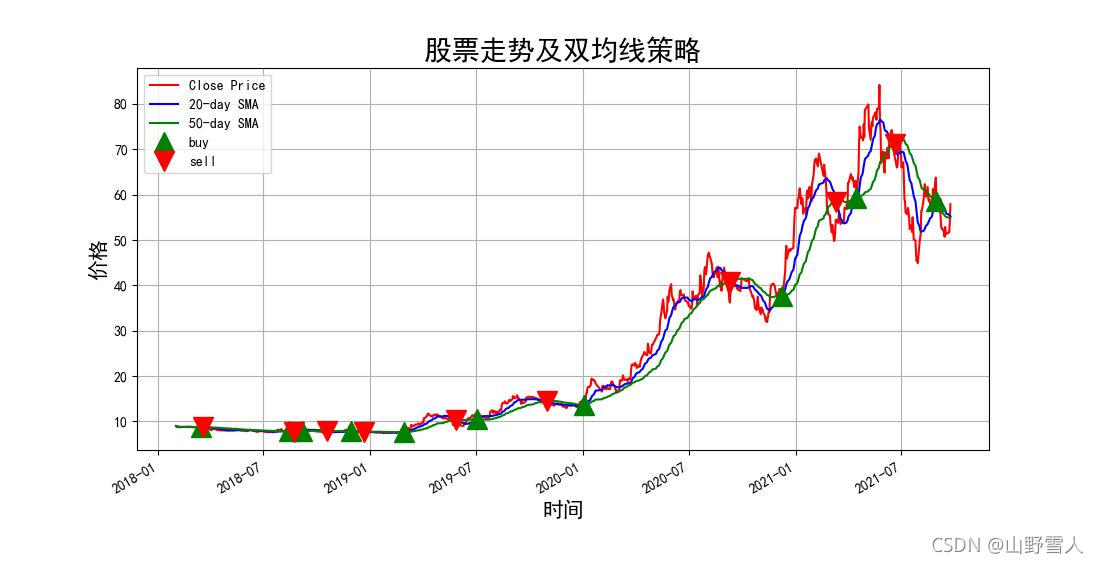
plt.figure(figsize = (20,10))
# 绘制收盘价、20日SMA和50日SMA简单移动平均线:
df['Close Price'].plot(color = 'r', label= 'Close Price')
df['20_SMA'].plot(color = 'b',label = '20-day SMA')
df['50_SMA'].plot(color = 'g', label = '50-day SMA')
# 绘制买入点
plt.plot(df[df['Position'] == 1].index,
df['20_SMA'][df['Position'] == 1],
'^', markersize = 15, color = 'g', label = 'buy')
# 绘制卖出点
plt.plot(df[df['Position'] == -1].index,
df['20_SMA'][df['Position'] == -1],
'v', markersize = 15, color = 'r', label = 'sell')
plt.ylabel('价格', fontsize = 15 )
plt.xlabel('时间', fontsize = 15 )
plt.title('股票走势及双均线策略', fontsize = 20)
plt.legend() #绘出图例
plt.grid()
plt.show()
'''
参考资料:
1 pandas 移动窗口函数rolling:
https://blog.csdn.net/xxzhangx/article/details/76938053
https://pandas.pydata.org/pandas-docs/version/0.17.0/generated/pandas.rolling_mean.html
2 pandas的diff介绍:
https://blog.csdn.net/lz_peter/article/details/79109185
3 Generating Trade Signals using Moving Average(MA) Crossover Strategy — A Python implementation:
https://towardsdatascience.com/making-a-trade-call-using-simple-moving-average-sma-crossover-strategy-python-implementation-29963326da7a
本文用到的数据:
链接:https://pan.baidu.com/s/1_gQiI4a-8aMFWyBVx6Xu2Q
提取码:ydyy
'''


 11万+
11万+


 被折叠的 条评论
为什么被折叠?
被折叠的 条评论
为什么被折叠?
 到【灌水乐园】发言


