


0、获取数据集
关注公众号:『AI学习星球』
回复:确定关键行为给渠道质量打分 即可获取数据下载。
论文辅导或算法学习可以通过公众号滴滴我

1、项目目标
选取指标
a. 短期渠道评分体系
- 关键行为分:根据留存魔法数字确定关键行为
- 变现能力分:使用时长、广告展现次数、启动次数、PV
- 用户构成:老用户占比
- 归因得分:模糊归因占比、归因失败占比
- 数量分:按照数量多少打分
b. 关键行为确定
根据留存魔法数字确定关键行为。留存魔法数字:找到影响用户留存的最关键变量,之后改善这个变量的数值,从而达到改善留存的目的。比如我们发现:一周内点击分享5次及以上的用户,留存率明显高出30%,所以我们就定5次为魔法数字,然后想办法让用户多分享。
具体操作分4步:
- 列出可采集数据的用户行为
- 分析行为与留存率关系
- 找出高度相关行为
- 得出合适做改善行为的魔法数字
2、数据读取
# 导入库
import pandas as pd
import numpy as np
import matplotlib.pyplot as plt
import seaborn as sns
import warnings

# 中文乱码的处理
plt.rcParams['font.sans-serif'] = ['Microsoft YaHei']# 设置微软雅黑字体
# 忽略警告
warnings.filterwarnings("ignore")
# 读取数据
key_action_data = pd.read_excel('key_action.xls')
key_action_data.head()
# 查看关键行为值
key_action_data['key_action'].unique()

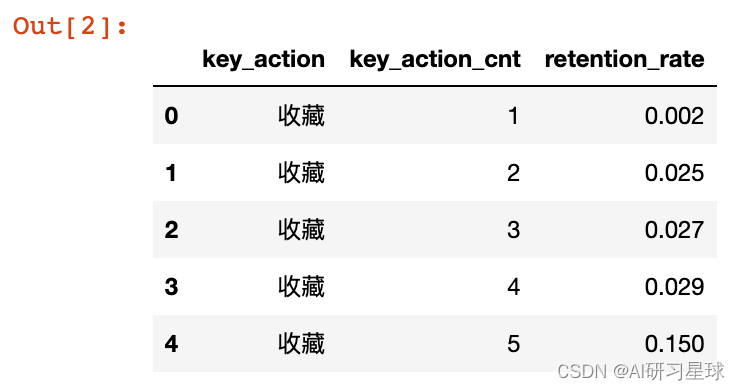
# 收藏数
collection_cnt = key_action_data[key_action_data['key_action'] == '收藏']
# 分享数
share_cnt = key_action_data[key_action_data['key_action'] == '分享']
# 更换模板数
model_change_cnt = key_action_data[key_action_data['key_action'] == '更换模板']
# 消息互动数
message_cnt = key_action_data[key_action_data['key_action'] == '消息互动']
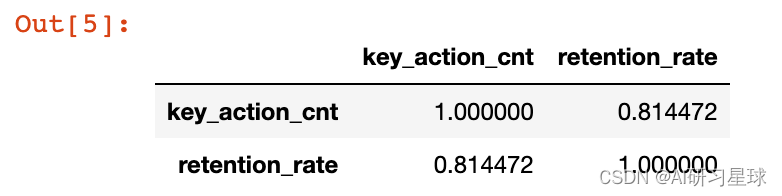
# 收藏数与留存的相关性
corr1 = collection_cnt.corr()
corr1
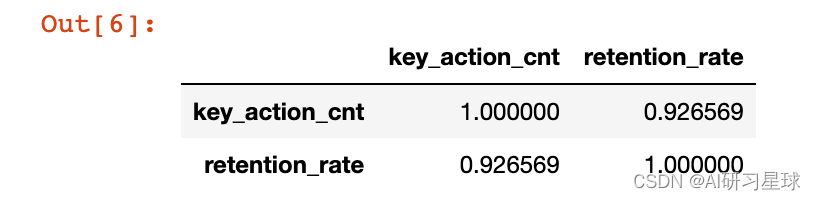
# 分享数和留存率的相关性
corr2 = share_cnt.corr()
corr2
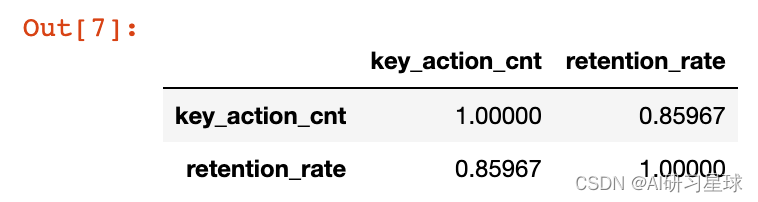
# 更换模板数和留存率的相关性
corr3 = model_change_cnt.corr()
corr3
# 消息互动数和留存率的相关性
corr4 = message_cnt.corr()
corr4
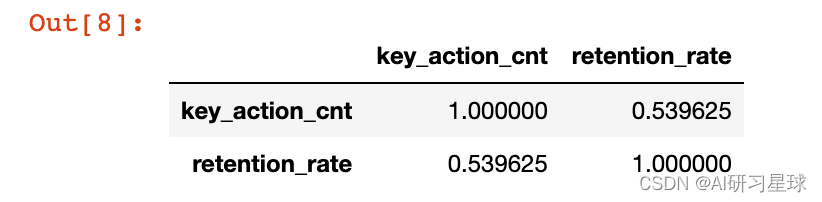
相关系数r的绝对值一般在0.8以上,认为A和B有强的相关性。0.3到0.8之间,可以认为有弱的相关性。0.3以下,认为没有相关性。
所以这四个变量中取前与留存率强相关的三个指标:收藏数、分享数、更换模板数。
# 绘图
fig,ax = plt.subplots(1,3,figsize=(15,5))
ax1,ax2,ax3 = ax.flatten()

#收藏数
#设置数据
x1 = collection_cnt['key_action_cnt']
y1 = collection_cnt['retention_rate']
#绘制折线图
ax1.plot(x1,y1)
#绘制辅助线
ax1.axvline(x=9,c="r",ls="--",lw=2)
ax1.text(9.3,0.10,'x=9')
#消除左右边框
ax1.spines['right'].set_color('none')
ax1.spines['top'].set_color('none')
ax1.set_title('收藏数')

#分享数
#设置数据
x1 = share_cnt['key_action_cnt']
y1 = share_cnt['retention_rate']
#绘制折线图
ax2.plot(x1,y1)
#绘制辅助线
ax2.axvline(x=5,c="r",ls="--",lw=2)
ax2.text(5.3,0.10,'x=5')
#消除左右边框
ax2.spines['right'].set_color('none')
ax2.spines['top'].set_color('none')
ax2.set_title('分享数')

#更换模板数
#设置数据
x1 = model_change_cnt['key_action_cnt']
y1 = model_change_cnt['retention_rate']
#绘制折线图
ax3.plot(x1,y1)
#绘制辅助线
ax3.axvline(x=5,c="r",ls="--",lw=2)
ax3.text(5.3,0.10,'x=5')
#消除左右边框
ax3.spines['right'].set_color('none')
ax3.spines['top'].set_color('none')
ax3.set_title('更换模板数')

plt.show()
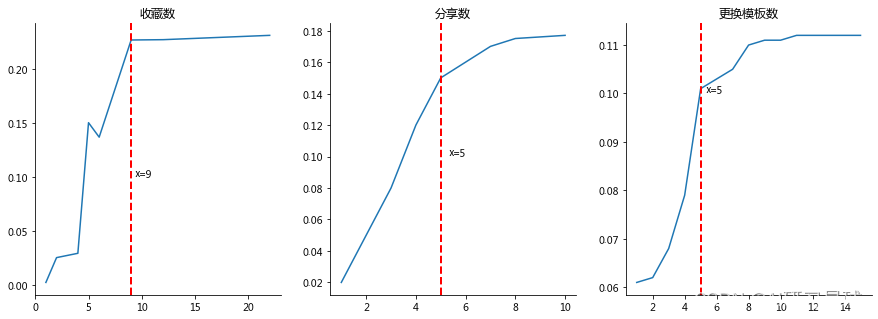
所以确定关键行为标准:收藏数9,分享数5,更换模板数5为关键行为。
3、指标筛选
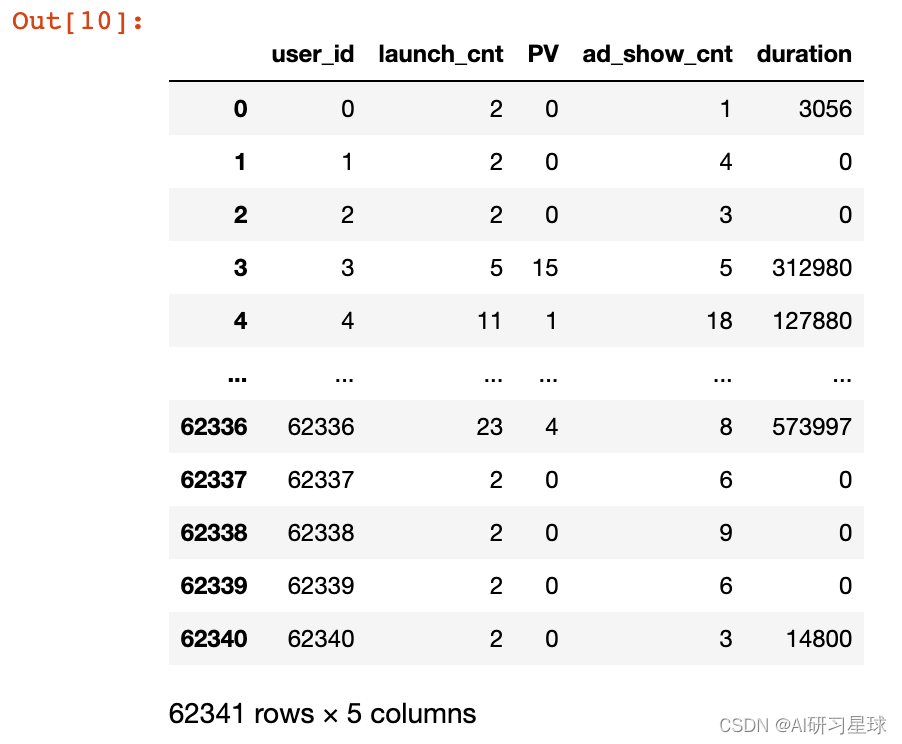
目前我们对于变现能力分的评价有4个指标,我们想要对指标进行筛选,用更少的指标计算变现能力分
# 读取数据
revenue_ability_data = pd.read_csv('revenue_ability_data.csv')[['user_id','launch_cnt','PV','ad_show_cnt','duration']]
revenue_ability_data
# 绘制变现能力指标的相关性矩阵
corr_revenue_ability_data = revenue_ability_data.corr()
sns.heatmap(corr_revenue_ability_data, cmap='Blues', annot=True)
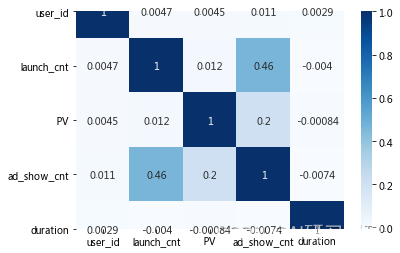
从上面的矩阵我们可以看出来的是:启动数与广告展示数呈现弱相关,其他指标之间没有相关性,所以我们需要对这四个指标进行权重打分。
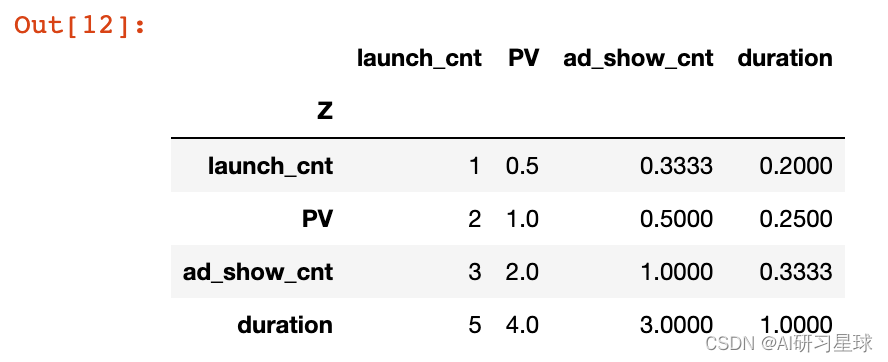
4、权重打分
# 读取数据
index_weight_raw = pd.read_excel('权重打分表.xls',index_col='Z')
index_weight_raw
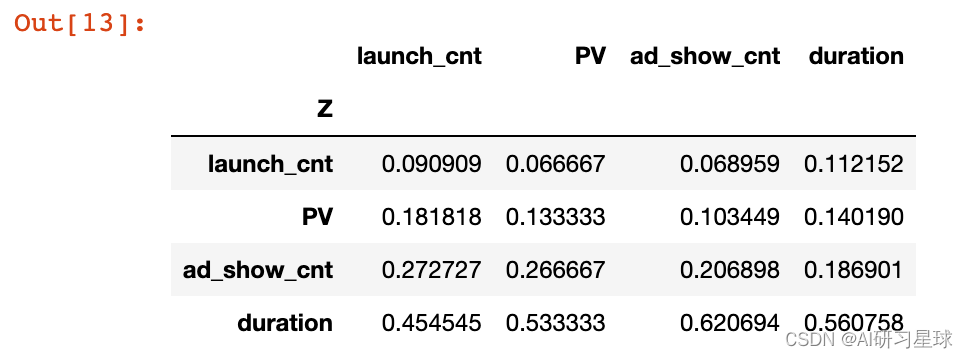
# 列向量归一化
index_weight = index_weight_raw.apply(lambda x : x/x.sum())
index_weight
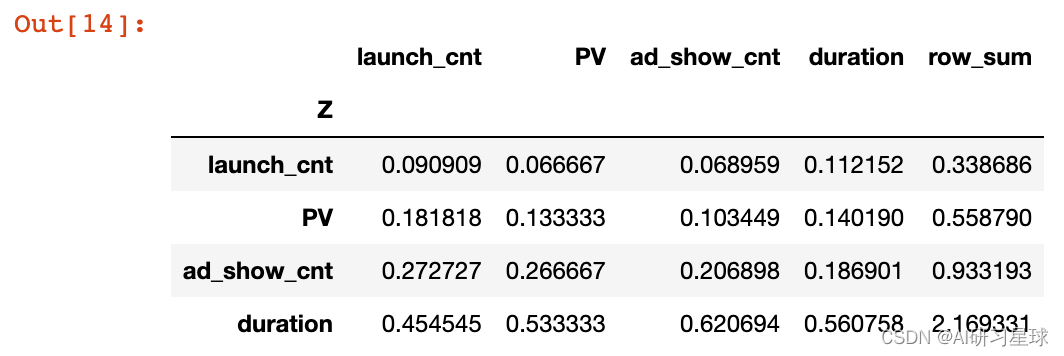
# 行求和
index_weight['row_sum'] = index_weight.apply(lambda x : x.sum(),axis=1)
index_weight
# 求和项归一
index_weight['normalization'] = index_weight[['row_sum']].apply(lambda x :x/x.sum())
index_weight
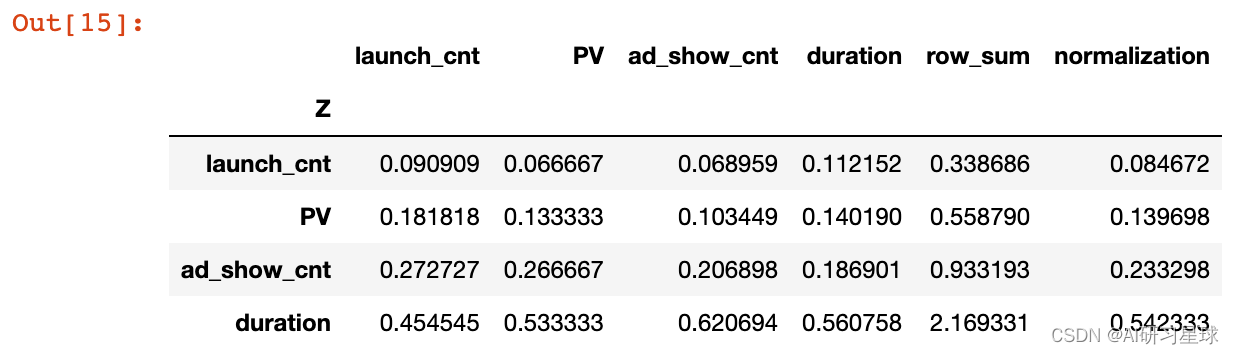
使用时长权重:0.542333
广告展现次数权重:0.233298
启动次数权重:0.084672
PV权重:0.139698
4.1、一致性检验
- 一般认为一致性比率CR<0.1时,认为A的不一致程度在容许范围之内,有满意的一致性,通过一致性检验。
- CR = CI/RI
- CI = (λ-n)/(n-1)
- n是特征数量,n=4
- λ = 1/n(AW1/W1+AW2/W2+…+AWi/Wi)
- 行向量求和、经归一化(使向量中各元素之和为1)后记为W
- A是原始的打分表数据
# 一致性检验计算-计算AW
AW1 = index_weight_raw.iloc[0,0]*index_weight.iloc[0,5]+index_weight_raw.iloc[0,1]*index_weight.iloc[1,5]+index_weight_raw.iloc[0,2]*index_weight.iloc[2,5]+index_weight_raw.iloc[0,3]*index_weight.iloc[3,5]
AW2 = index_weight_raw.iloc[1,0]*index_weight.iloc[0,5]+index_weight_raw.iloc[1,1]*index_weight.iloc[1,5]+index_weight_raw.iloc[1,2]*index_weight.iloc[2,5]+index_weight_raw.iloc[1,3]*index_weight.iloc[3,5]
AW3 = index_weight_raw.iloc[2,0]*index_weight.iloc[0,5]+index_weight_raw.iloc[2,1]*index_weight.iloc[1,5]+index_weight_raw.iloc[2,2]*index_weight.iloc[2,5]+index_weight_raw.iloc[2,3]*index_weight.iloc[3,5]
AW4 = index_weight_raw.iloc[3,0]*index_weight.iloc[0,5]+index_weight_raw.iloc[3,1]*index_weight.iloc[1,5]+index_weight_raw.iloc[3,2]*index_weight.iloc[2,5]+index_weight_raw.iloc[3,3]*index_weight.iloc[3,5]
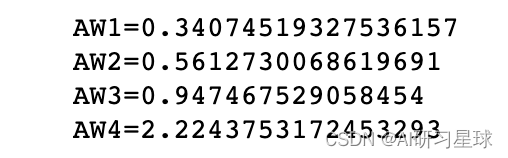
print(f'AW1={AW1}')
print(f'AW2={AW2}')
print(f'AW3={AW3}')
print(f'AW4={AW4}')
# 计算λ
lambda_ = 1/4*(AW1/index_weight.iloc[0,5]+AW2/index_weight.iloc[1,5]+AW3/index_weight.iloc[2,5]+AW4/index_weight.iloc[3,5])
lambda_
4.051192777069623
# 计算CI
CI = (lambda_-4)/(4-1)
CI
0.01706425902320774
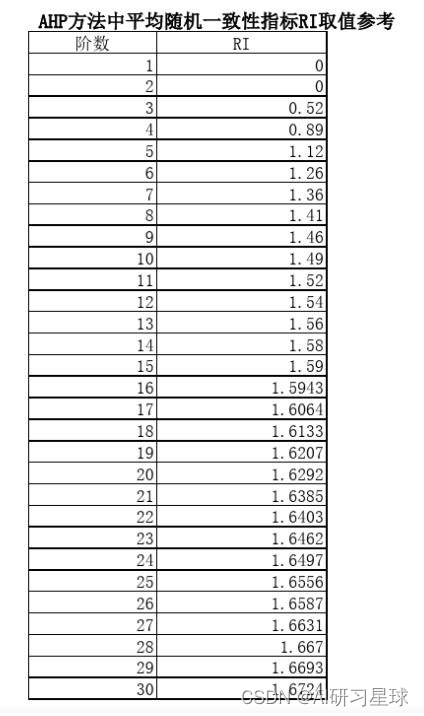
# 计算CR
RI = 0.90
CR = CI/RI
CR <0.1
True
所以判断矩阵的不一致程度在容许范围之内,有满意的一致性,通过一致性检验。
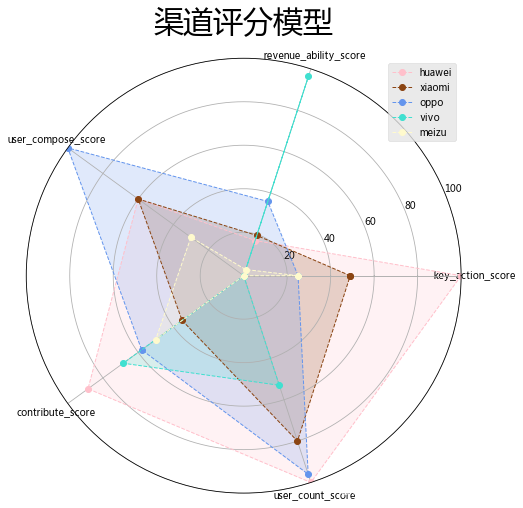
5、结果呈现
5.1、评判维度
- 关键行为分:根据关键行为占比的大小,
- 变现能力分:使用时长、广告展现次数、启动次数、PV的权重评分
- 用户构成:老用户占比评分
- 归因得分:根据模糊归因占比、归因失败占比评分(权重0.5:0.5)
- 数量分:按照数量多少打分
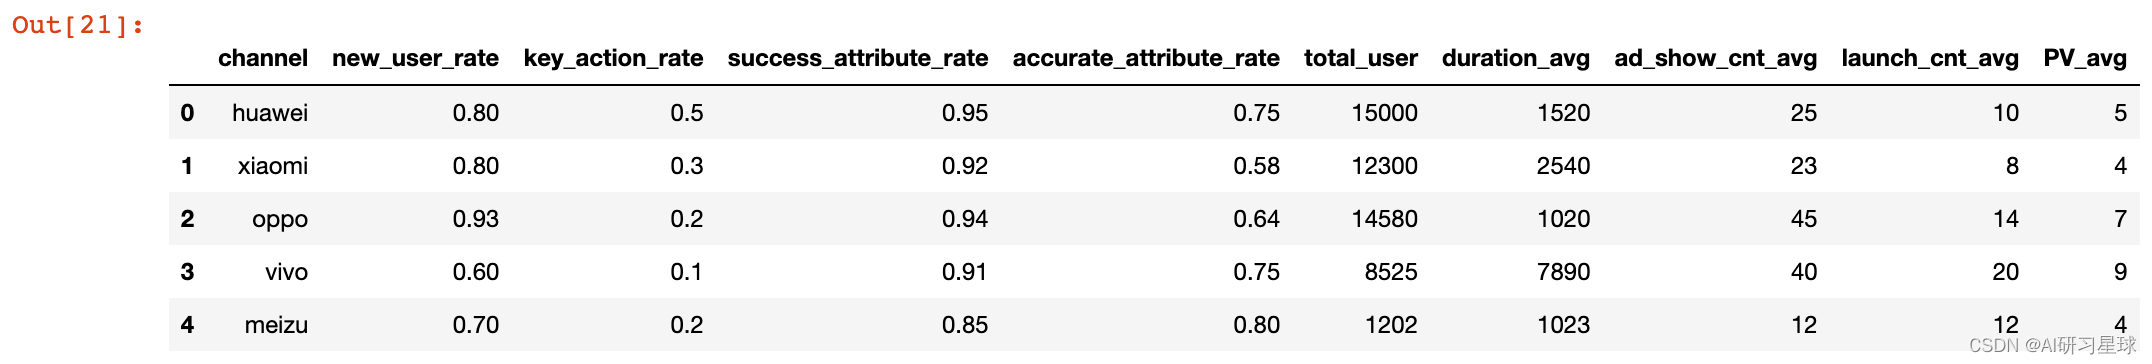
score_data = pd.read_excel('score_data.xlsx')
score_data
score_data_final = pd.DataFrame()
# 关键行为分
score_data_final[['channel','key_action_score']] = score_data[['channel','key_action_rate']]
# 变现能力分
score_data_final['revenue_ability_score'] = score_data['duration_avg']*0.54+score_data['ad_show_cnt_avg']*0.23+score_data['launch_cnt_avg']*0.09+score_data['PV_avg']*0.14
# 用户构成分
score_data_final['user_compose_score'] = score_data['new_user_rate']
# 归因得分
score_data_final['contribute_score'] = score_data['success_attribute_rate']*0.5+score_data['accurate_attribute_rate']*0.5
# 数量分
score_data_final['user_count_score'] = score_data['total_user']
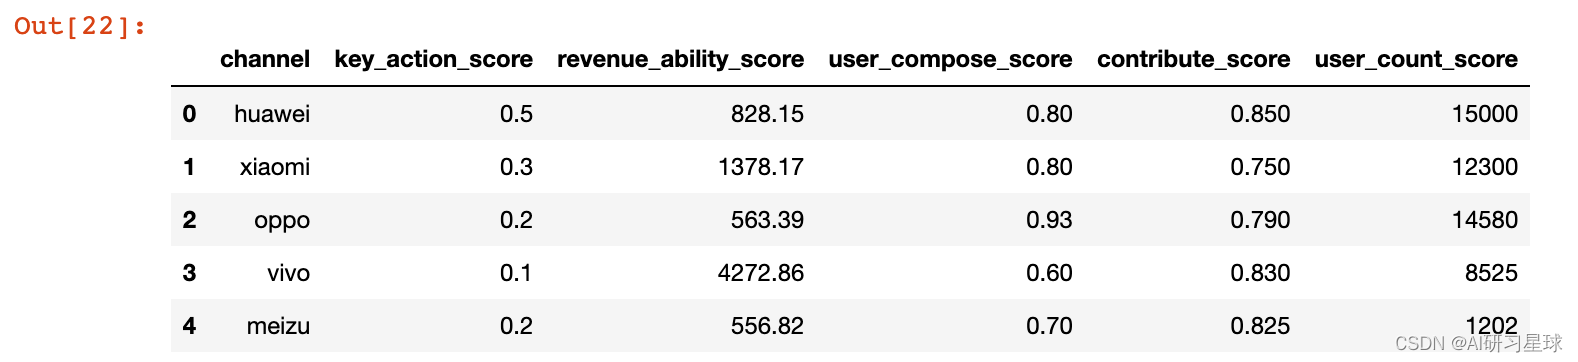
# 得分表
score_data_final
data = [100,16.99,60,88.5,100]
# 画布大小
plt.figure(figsize=(8,8))
# 设置颜色
colors = ['#FFC0CB','#8B4513','#6495ED','#40E0D0','#FFFACD']
# 标签
labels = np.array(['key_action_score','revenue_ability_score','user_compose_score','contribute_score','user_count_score'])
# 分割圆
angles = np.linspace(0,2*np.pi,len(labels),endpoint=False)
# 闭合
angles = np.concatenate((angles,[angles[0]]))
# 设置循环绘图
for i in range(len(score_data_final['channel'])):
    # 闭合
    data = np.concatenate((score_data_final.loc[i,['key_action_score','revenue_ability_score','user_compose_score','contribute_score','user_count_score']],[score_data_final.loc[i,'key_action_score']]))
    # 绘图
    plt.polar(angles,data,'o--',color=colors[i],linewidth=1)
    # 填充
    plt.fill(angles, data, facecolor=colors[i], alpha=0.2)
# 做标签
plt.thetagrids(angles * 180/np.pi, labels,size=10)
# 设置刻度
plt.ylim(0,100)
# 设置背景
plt.style.use('ggplot')
# 标题
plt.title('渠道评分模型',size=30)
# 图例
plt.legend(score_data_final['channel'])

plt.show()
关注公众号:『AI学习星球』
回复:确定关键行为给渠道质量打分 即可获取数据下载。
论文辅导或算法学习可以通过公众号滴滴我


 被折叠的 条评论
为什么被折叠?
被折叠的 条评论
为什么被折叠?
 到【灌水乐园】发言


