


算法学习、4对1辅导、论文辅导、核心期刊
项目的代码和数据下载可以通过公众号滴滴我
1. 项目背景
本项目主要分析李子柒在淘宝螺蛳粉店铺品牌销量及其评论,可以从用户的评论分析李子柒在淘宝螺蛳粉店铺的总体评价、以及具体什么词汇。
2. 数据提取分析
import numpy as np
import pandas as pd
import matplotlib.pyplot as plt
import seaborn as sns
import re
df = pd.read_csv('李子柒螺蛳粉评论.csv')
df.head(6)
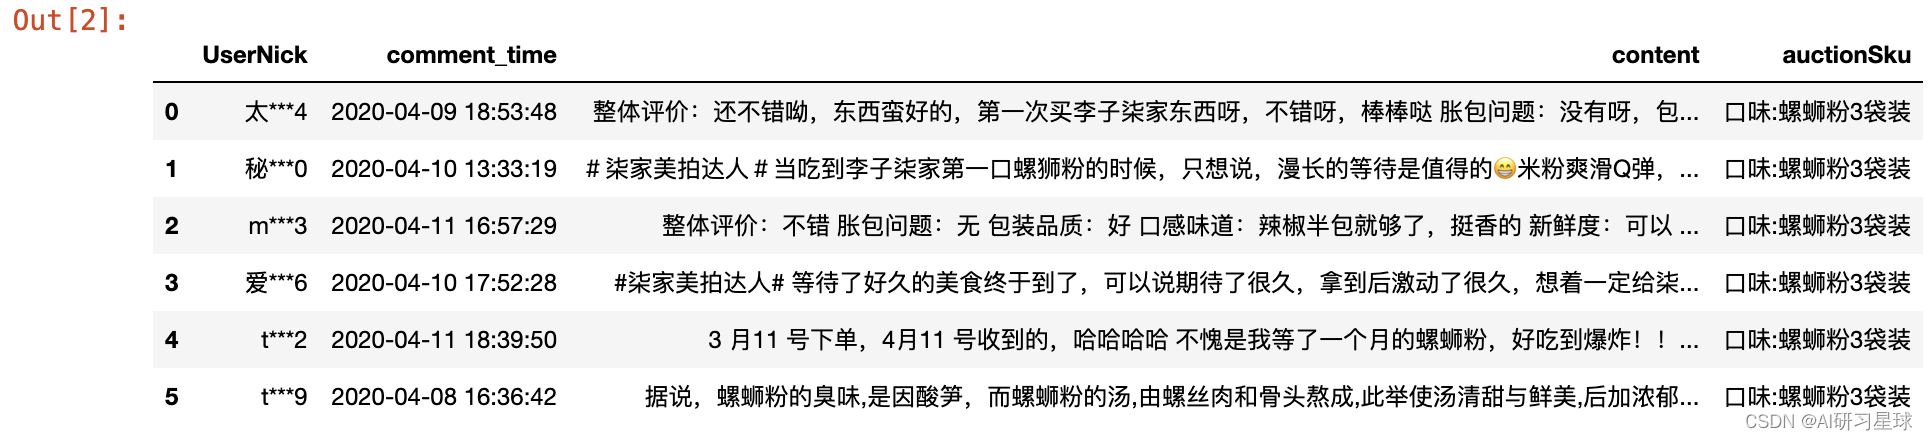
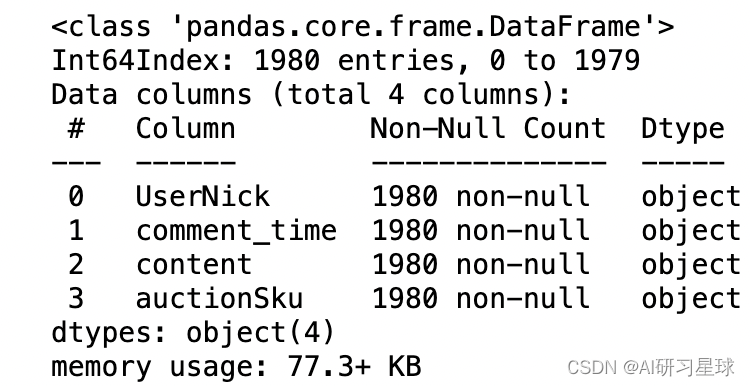
df.drop_duplicates(inplace=True)
df.info()
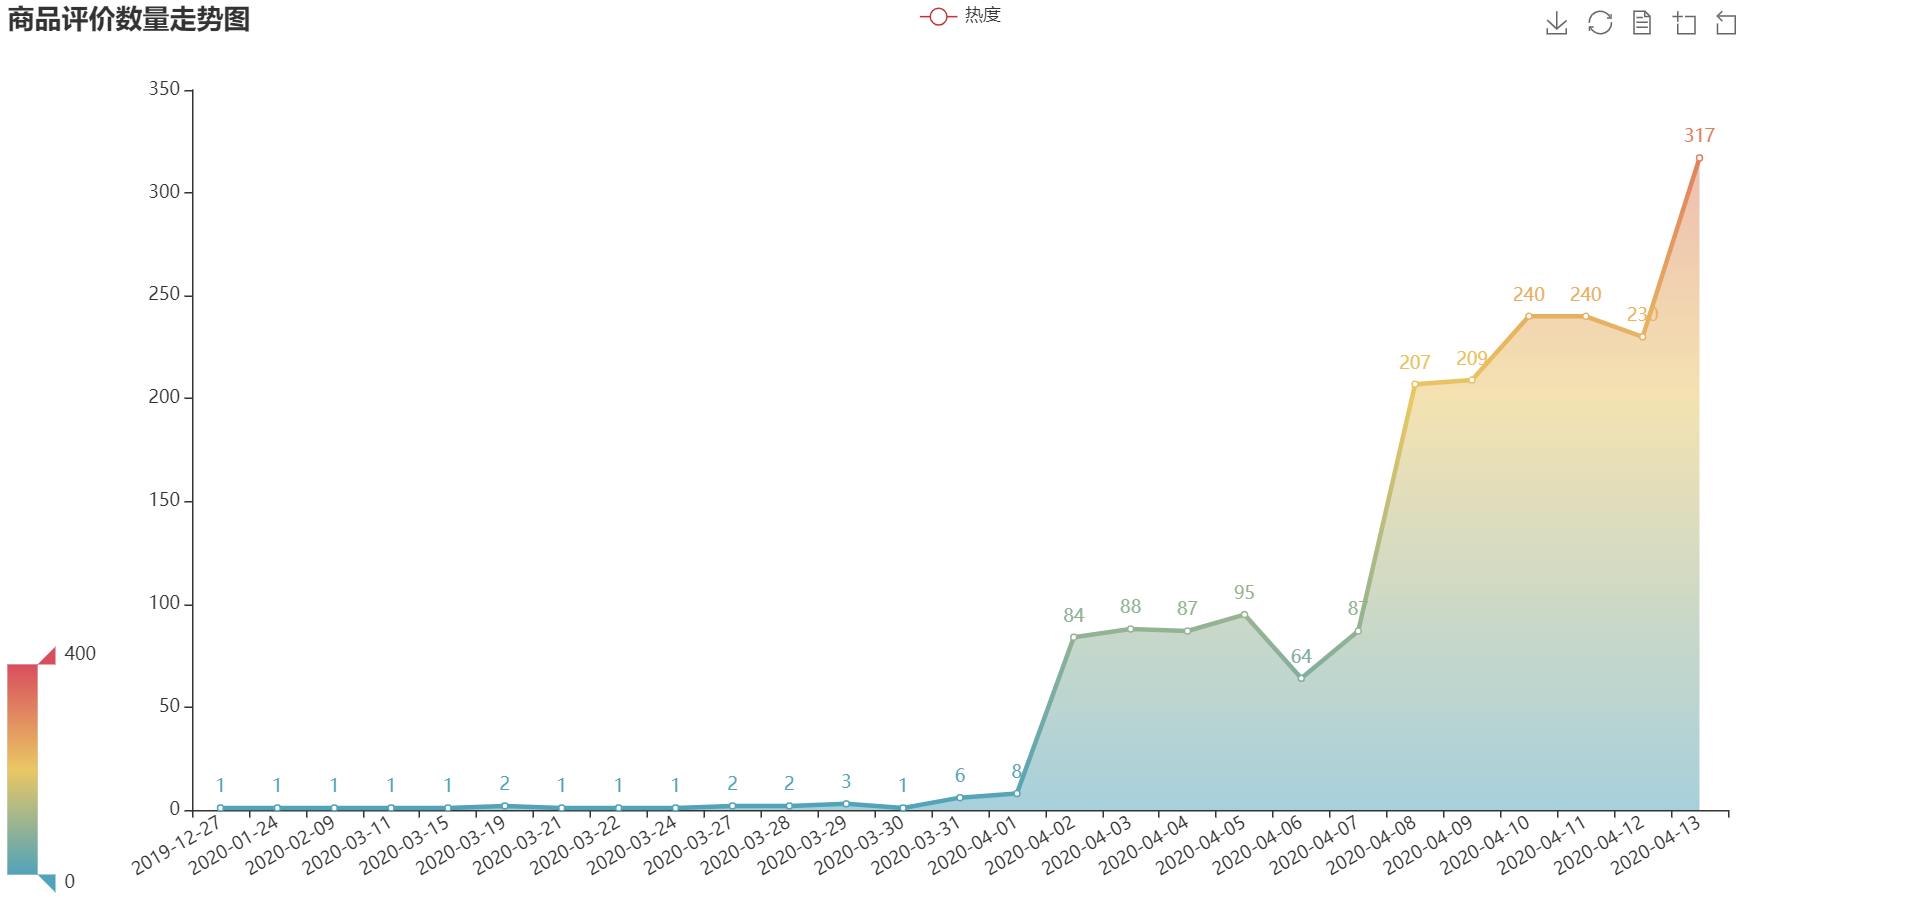
2.1 时间走势图
df['comment_time'] = pd.to_datetime(df['comment_time'])
df['comment_date'] = df['comment_time'].dt.date
comment_num = df['comment_date'].value_counts().sort_index()
from pyecharts.charts import Line
from pyecharts import options as opts
2.2 折线图
line1 = Line(init_opts=opts.InitOpts(width='1280px', height='600px'))
line1.add_xaxis(comment_num.index.tolist())
line1.add_yaxis('热度', comment_num.values.tolist(),
                areastyle_opts=opts.AreaStyleOpts(opacity=0.5),
                label_opts=opts.LabelOpts(is_show=True))
line1.set_global_opts(title_opts=opts.TitleOpts(title='商品评价数量走势图'),
                      xaxis_opts=opts.AxisOpts(axislabel_opts=opts.LabelOpts(rotate='30')),
                      toolbox_opts=opts.ToolboxOpts(),
                      visualmap_opts=opts.VisualMapOpts(max_=400))
line1.set_series_opts(linestyle_opts=opts.LineStyleOpts(width=3))
line1.render_notebook()
def judge_comment(df, result):
# 创建一个空数据框
judges = pd.DataFrame(np.zeros(13 * len(df)).reshape(len(df),13),
columns = ['品牌','物流正面','物流负面','包装正面','包装负面','原料正面',
'原料负面','口感正面','口感负面','日期正面','日期负面',
'性价比正面','性价比负面'])
for i in range(len(result)):
word = result[i]
#李子柒的产品具有强IP属性,基本都是正面评价,这里不统计情绪,只统计提及次数
if '李子柒' in word or '子柒' in word or '小柒' in word or '李子七' in word or '小七' in word:
judges.iloc[i]['品牌'] = 1
#先判断是不是物流相关的
if '物流' in word or '快递' in word or '配送' in word or '取货' in word:
#再判断是正面还是负面情感
if '好' in word or '不错' in word or '棒' in word or '满意' in word or '迅速' in word:
judges.iloc[i]['物流正面'] = 1
elif '慢' in word or '龟速' in word or '暴力' in word or '差' in word:
judges.iloc[i]['物流负面'] = 1
#判断是否包装相关
if '包装' in word or '盒子' in word or '袋子' in word or '外观' in word:
if '高端' in word or '大气' in word or '还行' in word or '完整' in word or '好' in word or\
'严实' in word or '紧' in word or '精致' in word:
judges.iloc[i]['包装正面'] = 1
elif '破' in word or '破损' in word or '瘪' in word or '简陋' in word:
judges.iloc[i]['包装负面'] = 1
#产品
#产品原料是牛肉为主,且评价大多会提到牛肉,因此我们把这个单独拎出来分析
if '米粉' in word or '汤' in word or '配料' in word or '腐竹' in word or '花生' in word:
if '劲道' in word or '多' in word or '足' in word or '香' in word or '才' in word or\
'脆' in word or 'nice' in word:
judges.iloc[i]['原料正面'] = 1
elif '小' in word or '少' in word or '没' in word:
judges.iloc[i]['原料负面'] = 1
#口感的情绪
if '口味' in word or '味道' in word or '口感' in word or '吃起来' in word:
if '不错' in word or '浓鲜' in word or '十足' in word or '鲜' in word or\
'可以' in word or '喜欢' in word or '符合' in word:
judges.iloc[i]['口感正面'] = 1
elif '不好' in word or '不行' in word or '不鲜' in word or\
'太烂' in word:
judges.iloc[i]['口感负面'] = 1
#口感方面,有些是不需要出现前置词,消费者直接评价好吃难吃的,例如:
if '难吃' in word or '不好吃' in word:
judges.iloc[i]['口感负面'] = 1
elif '好吃' in word or '香' in word:
judges.iloc[i]['口感正面'] = 1
#日期是不是新鲜
if '日期' in word or '时间' in word or '保质期' in word:
if '新鲜' in word:
judges.iloc[i]['日期正面'] = 1
elif '久' in word or '长' in word:
judges.iloc[i]['日期负面'] = 1
elif '过期' in word:
judges.iloc[i]['日期负面'] = 1
#性价比
if '划算' in word or '便宜' in word or '赚了' in word or '囤货' in word or '超值' in word or \
'太值' in word or '物美价廉' in word or '实惠' in word or '性价比高' in word or '不贵' in word:
judges.iloc[i]['性价比正面'] = 1
elif '贵' in word or '不值' in word or '亏了' in word or '不划算' in word or '不便宜' in word:
judges.iloc[i]['性价比负面'] = 1
final_result = pd.concat([df,judges],axis = 1)
return final_result
# 得到数据框
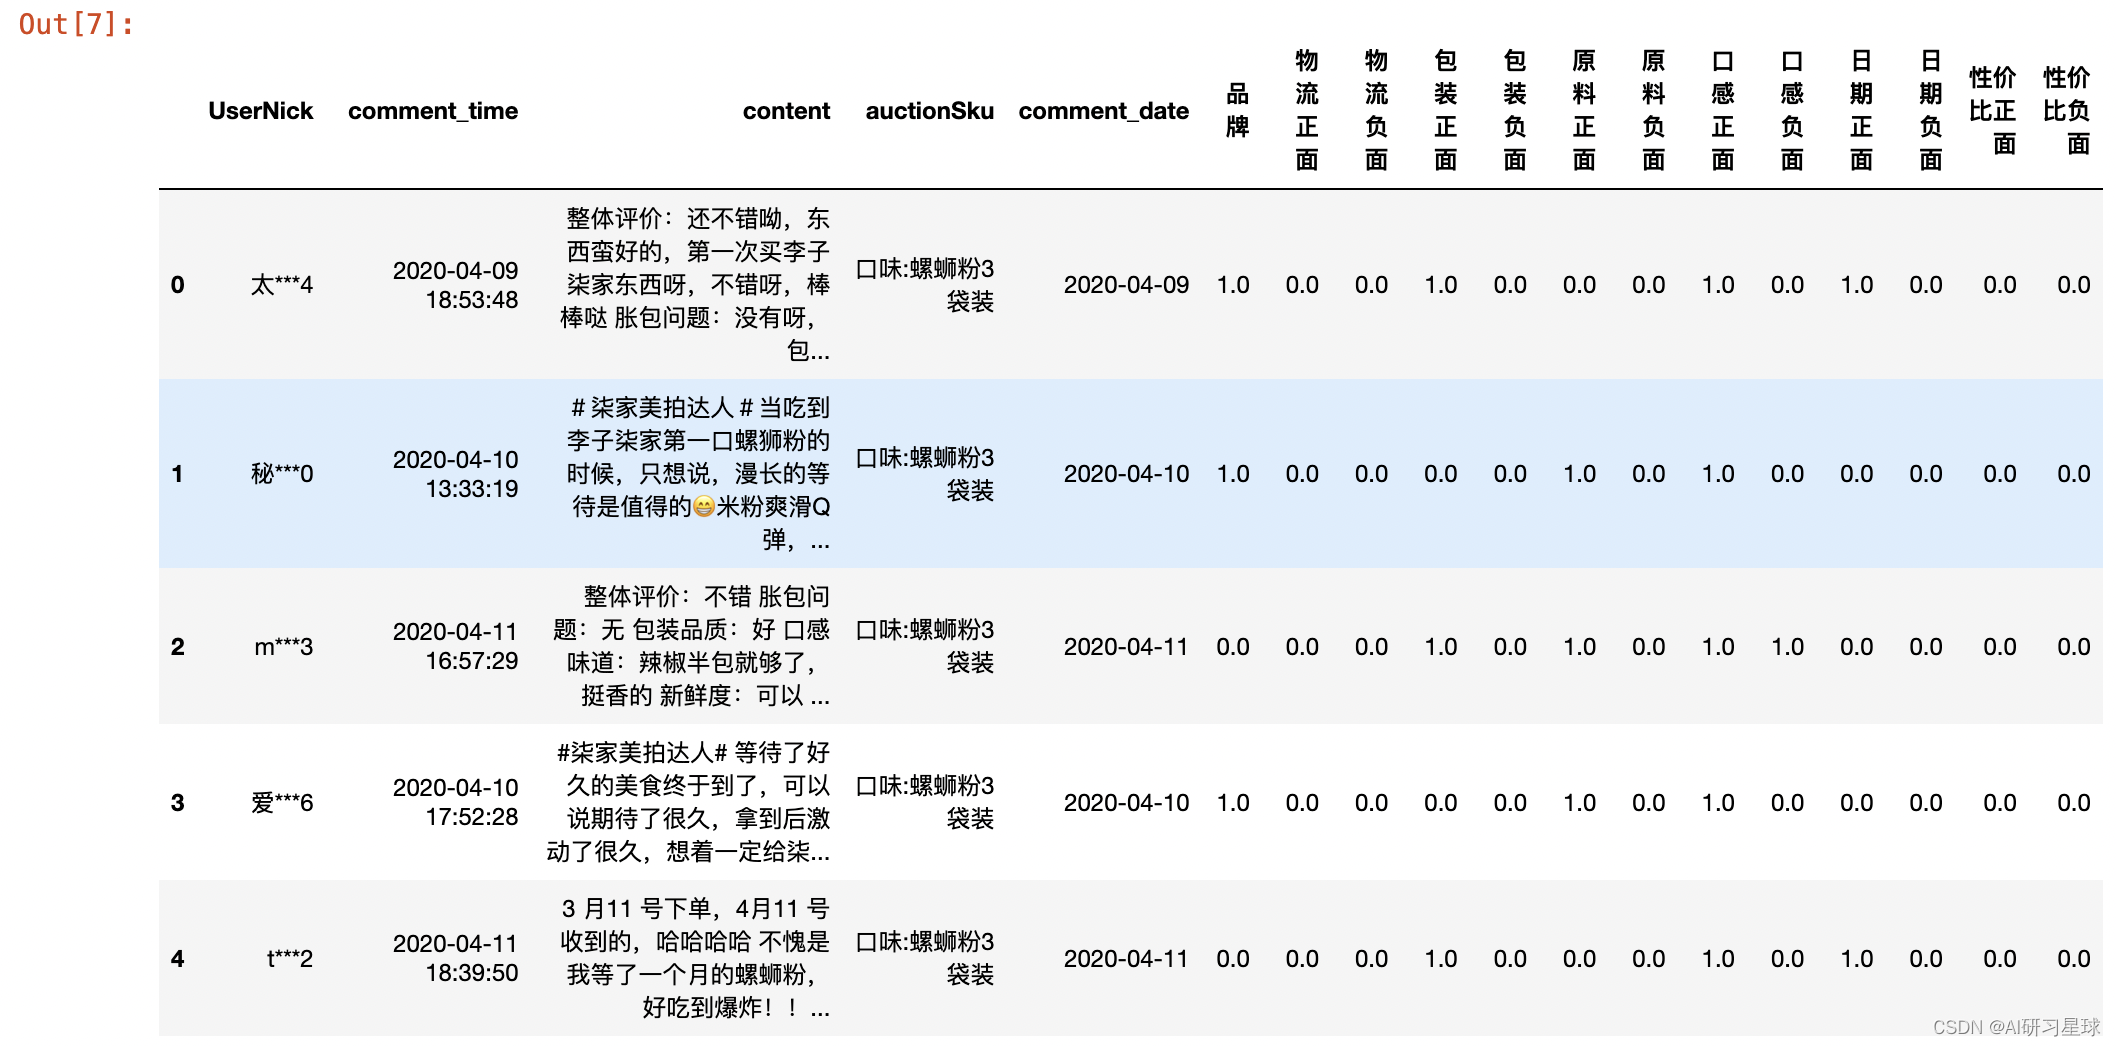
judge = judge_comment(df, result=df.content)
judge.head()
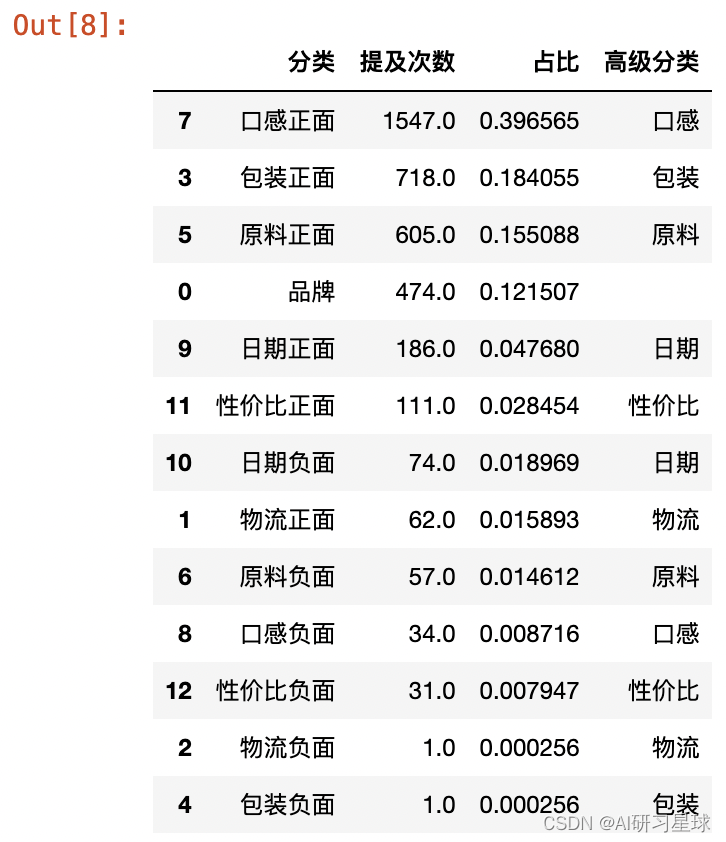
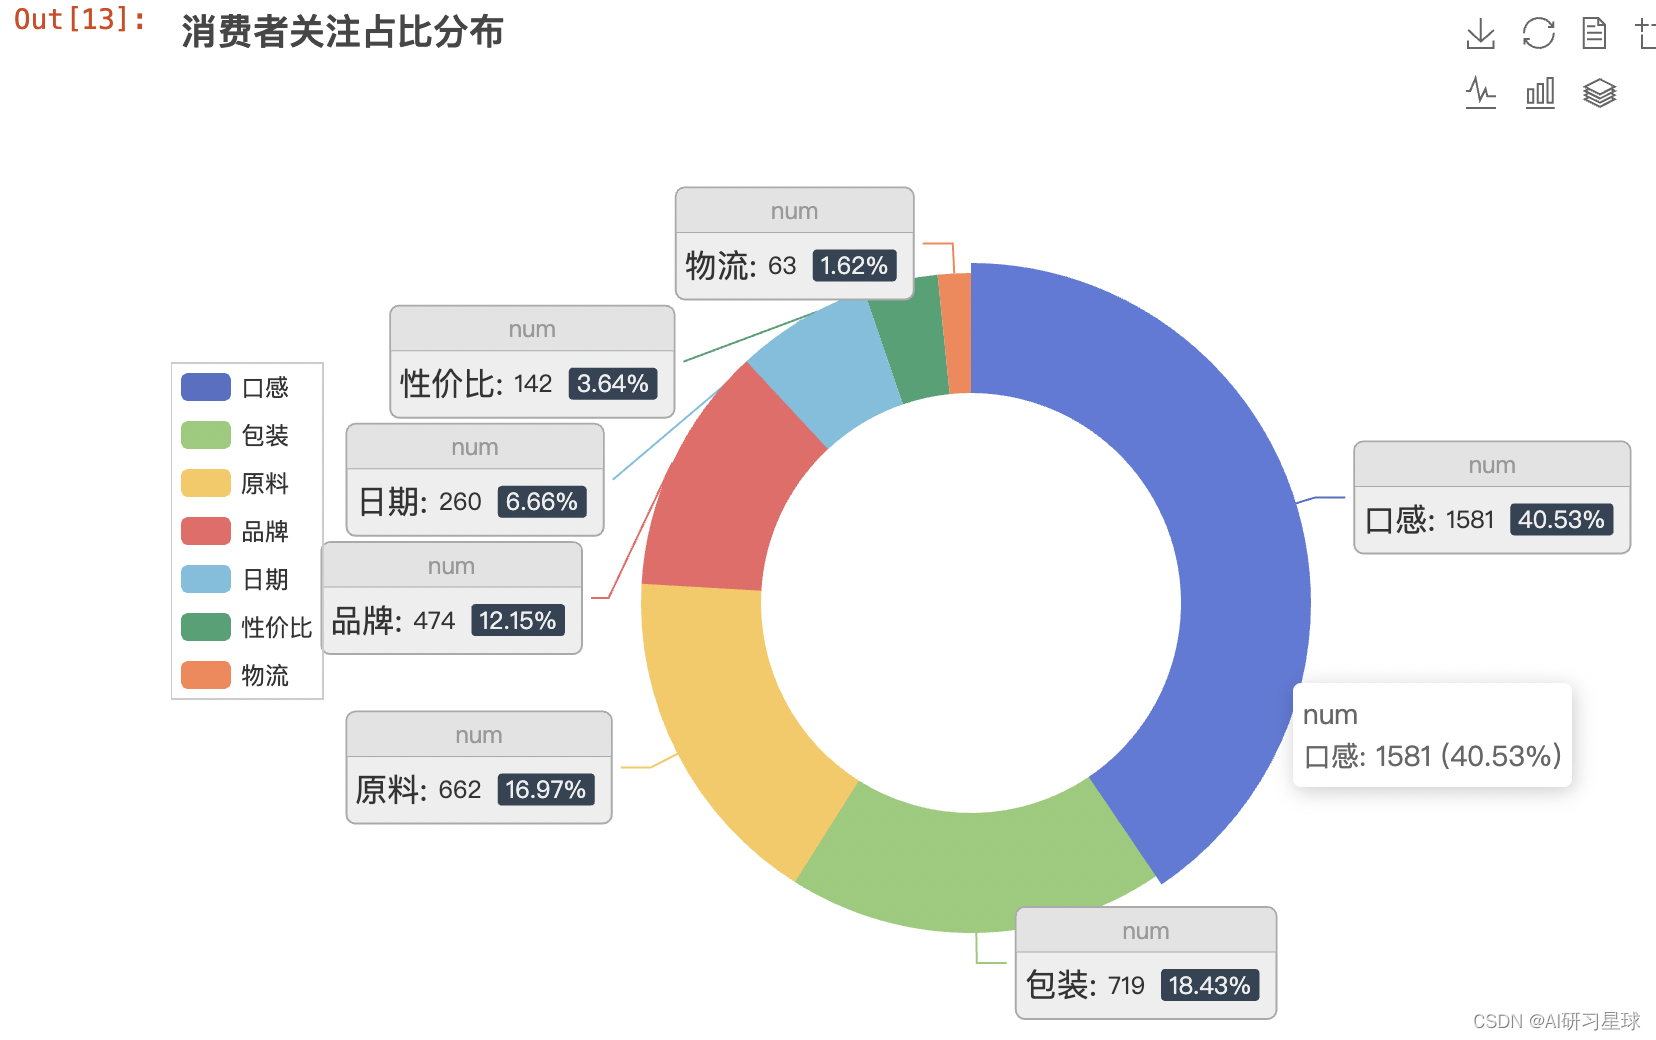
2.3 结果汇总
rank = judge.iloc[:,5:].sum().reset_index().sort_values(0,ascending=False)
rank.columns = ['分类', '提及次数']
rank['占比'] = rank['提及次数'] / rank['提及次数'].sum()
rank['高级分类'] = rank['分类'].str[:-2]
rank
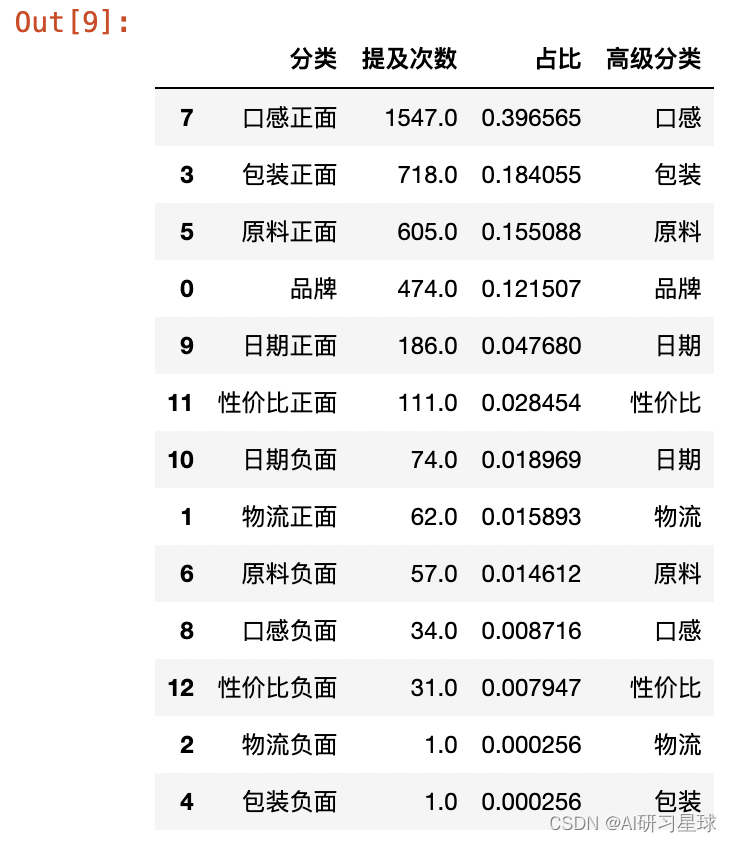
rank.loc[0, '高级分类'] = '品牌'
rank
df.shape
(1980, 5)
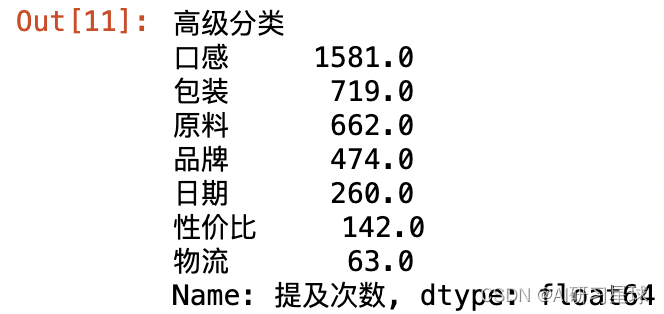
rank_num = rank.groupby('高级分类')['提及次数'].sum().sort_values(ascending=False)
rank_num
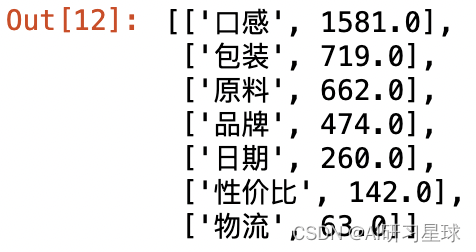
data_pair = [list(z) for z in zip(rank_num.index,rank_num.values)]
data_pair
from pyecharts.charts import Pie

pie1 = Pie(init_opts=opts.InitOpts(width='800px', height='600px'))
pie1.add(
        series_name="num",
        radius=["35%", "55%"],
        data_pair=data_pair,
        label_opts=opts.LabelOpts(
            position="outside",
            formatter="{a|{a}}{abg|}\n{hr|}\n {b|{b}: }{c}  {per|{d}%}  ",
            background_color="#eee",
            border_color="#aaa",
            border_width=1,
            border_radius=4,
            rich={
                "a": {"color": "#999", "lineHeight": 22, "align": "center"},
                "abg": {
                    "backgroundColor": "#e3e3e3",
                    "width": "100%",
                    "align": "right",
                    "height": 22,
                    "borderRadius": [4, 4, 0, 0],
                },
                "hr": {
                    "borderColor": "#aaa",
                    "width": "100%",
                    "borderWidth": 0.5,
                    "height": 0,
                },
                "b": {"fontSize": 16, "lineHeight": 33},
                "per": {
                    "color": "#eee",
                    "backgroundColor": "#334455",
                    "padding": [2, 4],
                    "borderRadius": 2,
                },
            },
        ),
)
pie1.set_global_opts(legend_opts=opts.LegendOpts(pos_left="left", pos_top='30%', orient="vertical"),
                     toolbox_opts=opts.ToolboxOpts(),#工具箱
                     title_opts=opts.TitleOpts(title='消费者关注占比分布'))
pie1.set_series_opts(
    tooltip_opts=opts.TooltipOpts(trigger="item", formatter="{a} <br/>{b}: {c} ({d}%)")
    )
pie1.render_notebook()
from pyecharts import options as opts
from pyecharts.charts import Bar
from pyecharts.commons.utils import JsCode
from pyecharts.globals import ThemeType
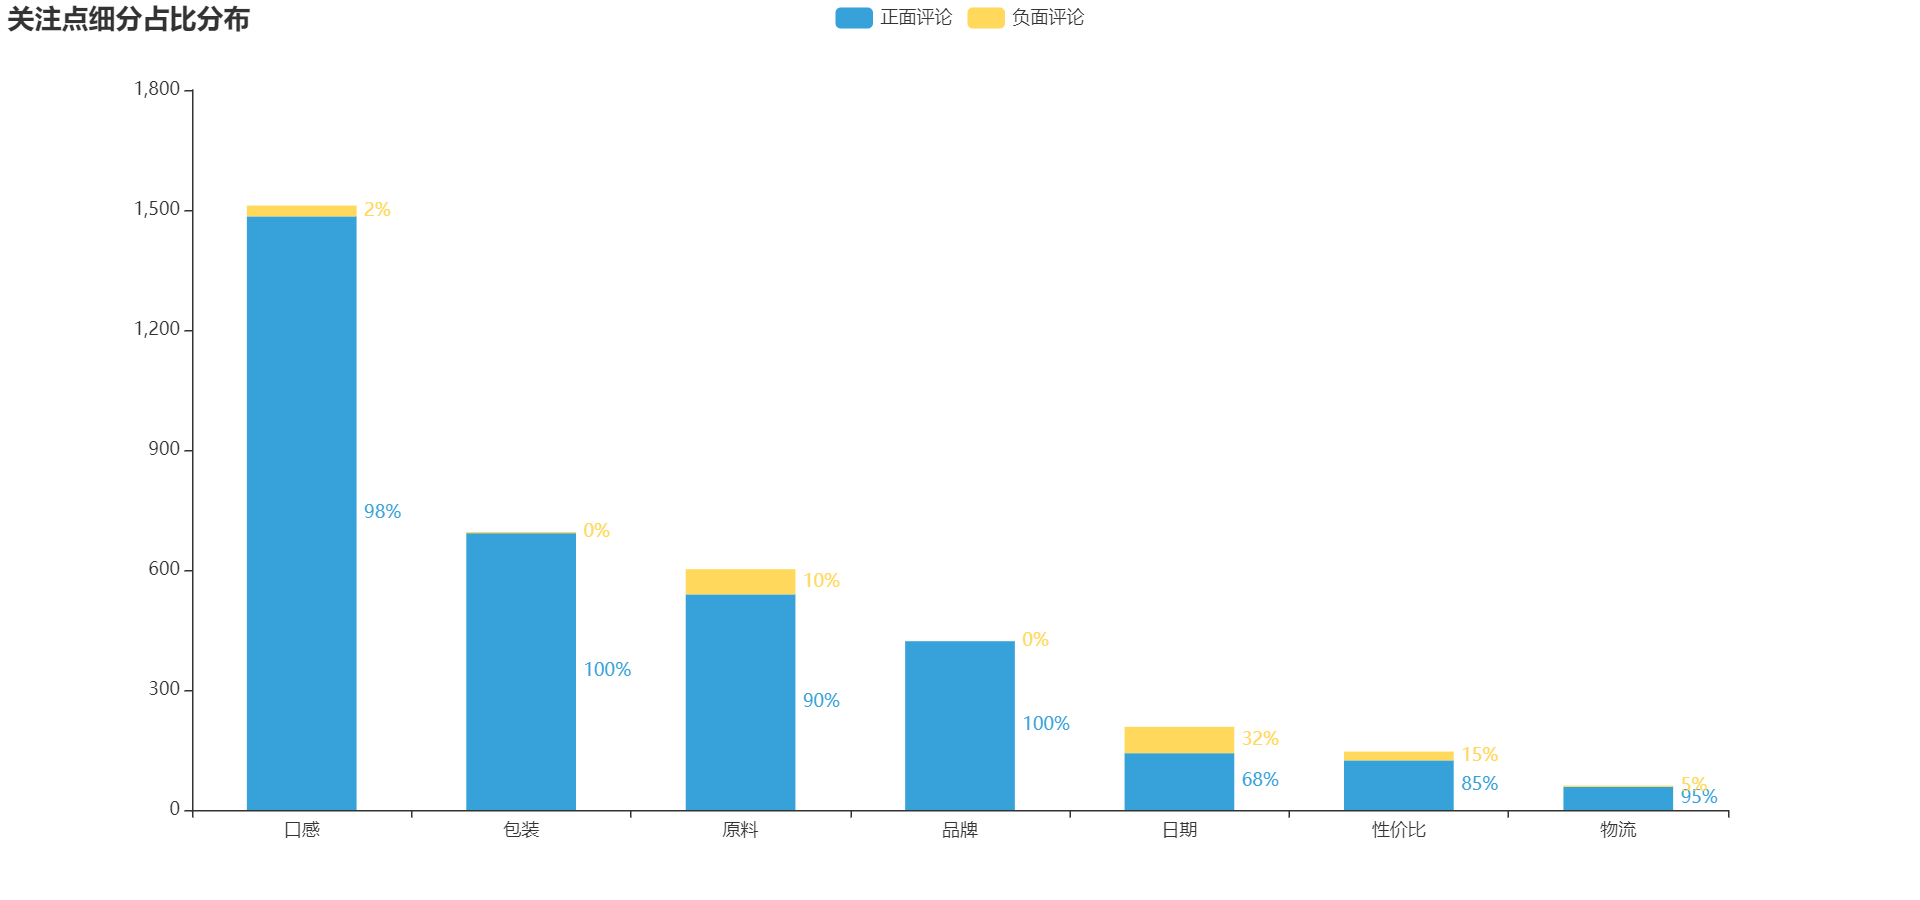
list2 = [
{"value": 1484.0, "percent": 1484.0 / (1484.0 + 27.0)},
{"value": 692.0, "percent": 692.0 / (692.0 + 3.0)},
{"value": 539.0, "percent": 539.0 / (539.0 + 63.0)},
{"value": 422.0, "percent": 422.0 / (422.0 + 0)},
{"value": 142.0, "percent": 142.0 / (142.0 + 66.0)},
{"value": 124.0, "percent": 124.0 / (124.0 + 22.0)},
{"value": 58.0, "percent": 58.0 / (58.0 + 3.0)},
]
list3 = [
{"value": 27.0, "percent": 27.0 / (27.0 + 1484.0)},
{"value": 3.0, "percent": 3.0 / (3.0 + 692.0)},
{"value": 63.0, "percent": 63.0 / (63.0 + 539.0)},
{"value": 0, "percent": 0 / (0 + 422.0)},
{"value": 66.0, "percent": 66.0 / (66.0 + 142.0)},
{"value": 22.0, "percent": 22.0 / (22.0 + 124.0)},
{"value": 3.0, "percent": 3.0 / (3.0 + 58.0)},
]
bar1 = Bar(init_opts=opts.InitOpts(width='1280px', height='600px', theme=ThemeType.LIGHT))
bar1.add_xaxis(['口感', '包装', '原料', '品牌', '日期', '性价比', '物流'])
bar1.add_yaxis("正面评论", list2, stack="stack1", category_gap="50%")
bar1.add_yaxis("负面评论", list3, stack="stack1", category_gap="50%")
bar1.set_global_opts(title_opts=opts.TitleOpts(title='关注点细分占比分布'))
bar1.set_series_opts(
label_opts=opts.LabelOpts(
position="right",
formatter=JsCode(
"function(x){return Number(x.data.percent * 100).toFixed() + '%';}"
),
)
)
bar1.render_notebook()
import jieba
import jieba.analyse
txt = df['content'].str.cat(sep='。')
# 添加关键词
jieba.add_word('李子柒')
stop_words = []
# 添加停用词
stop_words.extend(['40', 'hellip', '一袋', '一包', '一个月',
'一点', '一个多月', '第一次', '哈哈哈',
'螺狮粉', '螺蛳'])
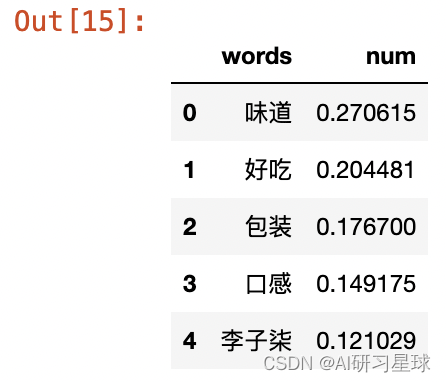
# 评论字段分词处理
word_num = jieba.analyse.extract_tags(txt,topK=100,withWeight=True,
allowPOS=())
# 去停用词
word_num_selected = []
for i in word_num:
if i[0] not in stop_words:
word_num_selected.append(i)
key_words = pd.DataFrame(word_num_selected, columns=['words','num'])
key_words.head()
from pyecharts.charts import WordCloud
from pyecharts.globals import SymbolType

# 词云图
word1 = WordCloud(init_opts=opts.InitOpts(width='1280px', height='600px'))
word1.add("", [*zip(key_words.words, key_words.num)],
          word_size_range=[20, 200],
          shape=SymbolType.DIAMOND)
word1.set_global_opts(title_opts=opts.TitleOpts('评论分布词云图'),
                      toolbox_opts=opts.ToolboxOpts())
word1.render_notebook()

from pyecharts.charts import Page
page = Page()
page.add(pie1,bar1,word1)
page.render_notebook()


算法学习、4对1辅导、论文辅导、核心期刊
项目的代码和数据下载可以通过公众号滴滴我


 15万+
15万+

 被折叠的 条评论
为什么被折叠?
被折叠的 条评论
为什么被折叠?
 到【灌水乐园】发言


