


参考https://blog.csdn.net/swordtraveller/article/details/90715061#commentBox
读取txt文件并利用matplotlib.pyplot画图
数据文件<log_test_fyo.txt>
1.0, 2.0, 3.0, 1.0, 2.0, 3.0
1.0, 2.0, 3.0, 1.0, 2.0, 3.0
1.0, 2.0, 3.0, 1.0, 2.0, 3.0
1.0, 2.0, 3.0, 1.0, 2.0, 3.0
1.0, 2.0, 3.0, 1.0, 2.0, 3.0
1.0, 2.0, 3.0, 1.0, 2.0, 3.0
1.0, 2.0, 3.0, 1.0, 2.0, 3.0
1.0, 2.0, 3.0, 1.0, 2.0, 3.0
1.0, 2.0, 3.0, 1.0, 2.0, 3.0
1.0, 2.0, 3.0, 1.0, 2.0, 3.0
1.0, 2.0, 3.0, 1.0, 2.0, 3.0
1.0, 2.0, 3.0, 1.0, 2.0, 3.0
测试运行文件
#!/usr/bin/env python
# -*- coding:utf-8   -*-

# import re
# import numpy as np
import matplotlib.pyplot as plt


def loadData(filePath):
    fr = open(filePath, 'r+')
    lines = fr.readlines()
    length = len(lines)
    # 这里可以记录一下挨个数值分别是啥意思
    ep_0 = []
    ep_1 = []
    ep_2 = []
    for line in lines:
        items = line.strip().split(',')
        ep_0.append(items[0])
        ep_1.append(items[1])
        ep_2.append(items[2])
    return ep_0, ep_1, ep_2, length


if __name__ == '__main__':
    ep_0, ep_1, ep_2, length = loadData('log_test_fyo.txt')
    # plt.title('Stock')
    # plt.xlabel('date')
    # plt.ylabel('price')
    x = list(range(1, length+1))
    # print x
    plt.plot(x, ep_0)
    plt.plot(x, ep_1)
    plt.plot(x, ep_2)

    plt.show()
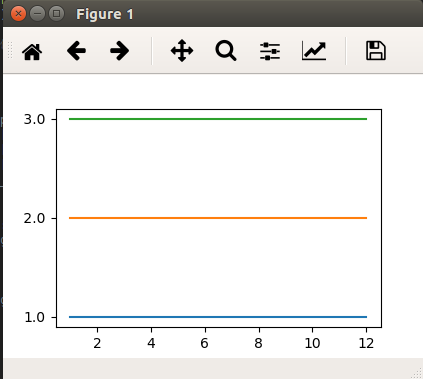
结果图


 1123
1123


 被折叠的 条评论
为什么被折叠?
被折叠的 条评论
为什么被折叠?
 到【灌水乐园】发言


