


 本文介绍了在生态学数据分析中,如何利用R语言进行混合效应模型的探索。通过数据探索,检查异常值、共线性和变量关系,并讨论了线性模型的局限性。接着,文章详细讲解了非线性问题的解决方案——广义加性模型(GAM),包括单变量和多变量GAM模型的构建与交互作用的理解。
Mixed effects models 回顾(一)
A.F. Zuur et al., Mixed Effects Models and Extensions in Ecology with R, 11 Statistics
数据探索
在进行数据分析之前,首先要对原始数据进行数据探索 (Data Exploration)。数据探索的目的如下:
(1) 检查响应变量、解释变量中是否存在异常值 (outliers);
(2) 检查解释变量间是否存在共线性 (collinearity);
(3) 考察解释变量与响应变量间的关系 (relationships)。
探索工具 (R language):
Outliers: dotchart()
attach(Nereis) #暂时无法使用管道,故使用attach,一定记得deattach
dotchart(concentration,
         groups = factor(nutrient),
         xlab = 'Concentrations',
         ylab = 'Nutrients',
         main = 'Cleveland dotplot',
         pch = nutrient) #点的区分
detach(Nereis)

Collinearity and relationships: ggpairs() in GGally package
ggpairs(dataframe)
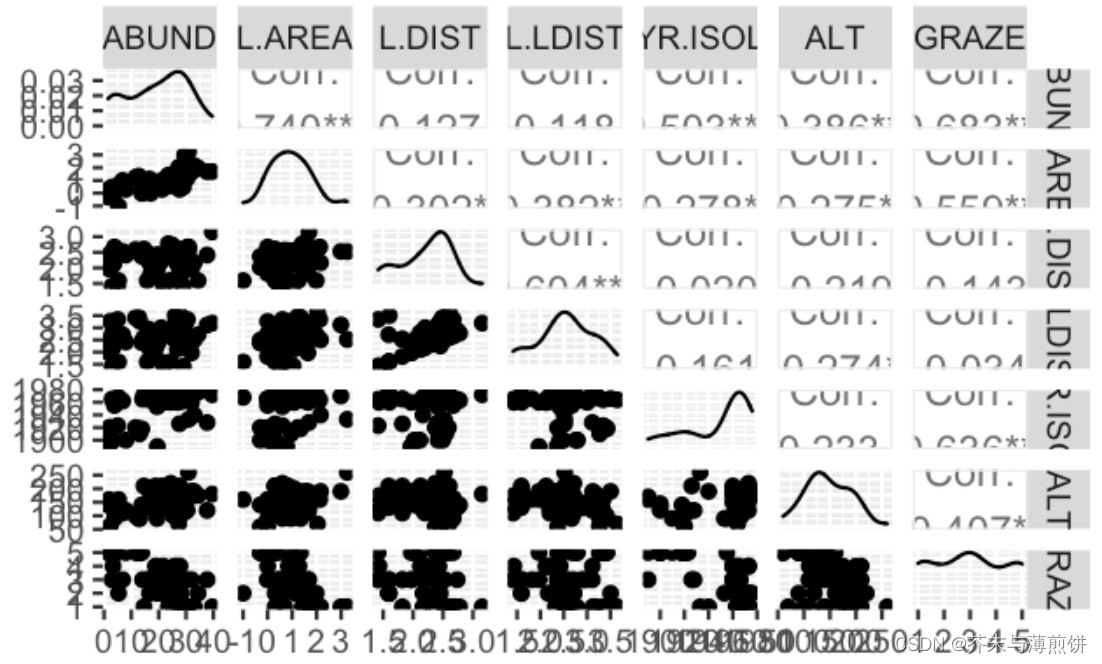
Collinearity: VIF
待补充。
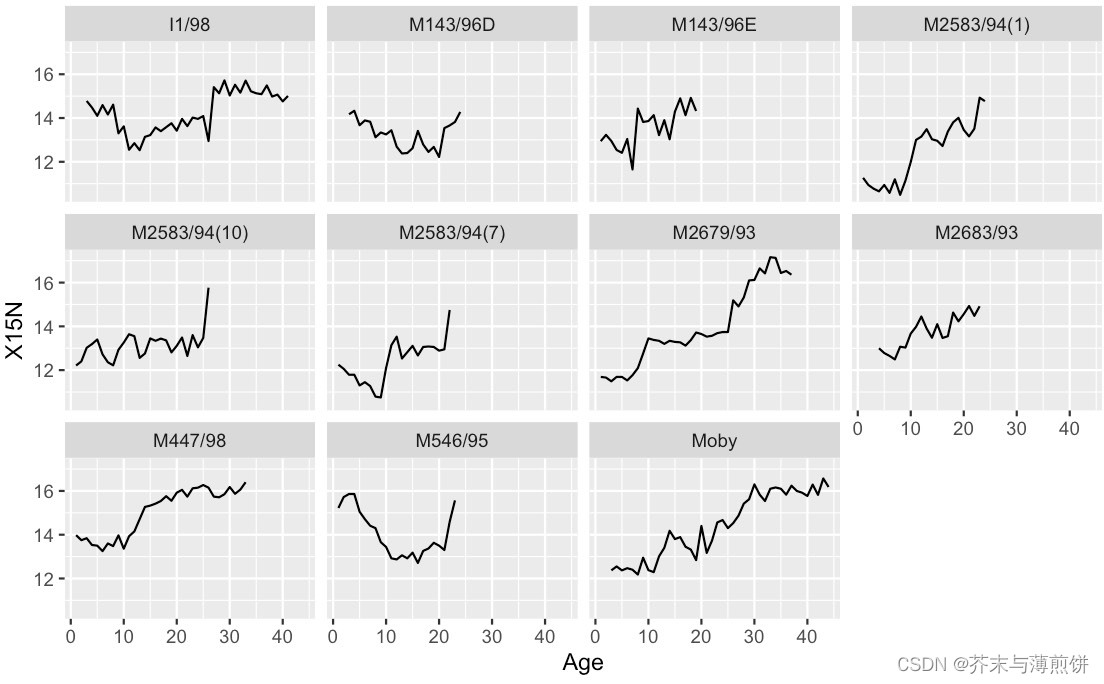
relationships: 分面
TeethNitrogen %>%
  ggplot() +
  geom_line(aes(x = Age, y = X15N)) +
  facet_wrap(.~Tooth)
 最低0.47元/天 解锁文章


 1万+
1万+

 被折叠的 条评论
为什么被折叠?
被折叠的 条评论
为什么被折叠?
 到【灌水乐园】发言


