


1。字符串离散化案例
案例:'Genre’字段为每部电影属于哪几种类型,统计所有电影类型各有多少部电影
思路:先构造一个全为0的DataFrame,再将属于的那个类变为1


#coding=utf-8
import pandas as pd
import numpy as np
from matplotlib import pyplot as plt

#读取表格中的数据
file_path = 'G:\\pytorch_learning\\数据分析资料\\day05\\code\\IMDB-Movie-Data.csv'
df = pd.read_csv(file_path)

#统计分类的列表
temp_list = df['Genre'].str.split(',').tolist()

genre_list = list(set([i for j in temp_list for i in j]))  ##获取所有的电影类型!!!!!!

#构造全为0的数组
zeros_df = pd.DataFrame(np.zeros((df.shape[0],len(genre_list))),columns=genre_list)

#给每个电影出现分类的位置赋值
for i in range(df.shape[0]):
    #zeros_df.loc[0,['Sci-fi','Mucical']]=1
    zeros_df.loc[i,temp_list[i]]=1     #把对应的位置赋为1!!!!!!!
print(zeros_df)

#t统计每个分类的电影的数量和
sum_genre = zeros_df.sum(axis = 0)#列求和
print(sum_genre)

#排序
sum_genre = sum_genre.sort_values()
_x = sum_genre.index
_y = sum_genre.values

#画图
plt.figure(figsize=(18,7),dpi = 80)
plt.bar(range(len(_x)),_y,width=0.4,color = 'orange')
plt.xticks(range(len(_x)),_x)
plt.show()
结果:

2.数据合并join
join:把行索引相同的数据合并到一起
t1.join(t2) 或t2.join(t1) ,效果不同
merge:把列索引相同的数据合并到一起
t1 . merge(t2,on = ‘a’),
on,内连接,取交集
out,外连接,取并集
left,左连接,左边为准,NAN补全
right,右连接,右边为准,NAN补全


t1 = pd.DataFrame(np.ones((2,4)),index= ['A','B'],columns=list('abcd'))
print(t1)
t2 = pd.DataFrame(np.arange(9).reshape(3,3),index= ['A','B','C'],columns=list('abc'))
print(t2)
merge_t1_t2 = t1.merge(t2,on='b')
merge_t2_t1 = t2.merge(t1,on='b')
print(merge_t1_t2)
print(merge_t2_t1)
join_t1_t2 = t1.join(t2,lsuffix='_caller', rsuffix='_other')
print(join_t1_t2)
'''result
     a    b    c    d
A  1.0  1.0  1.0  1.0
B  1.0  1.0  1.0  1.0
   a  b  c
A  0  1  2
B  3  4  5
C  6  7  8
   a_x    b  c_x    d  a_y  c_y
0  1.0  1.0  1.0  1.0    0    2
1  1.0  1.0  1.0  1.0    0    2
   a_x  b  c_x  a_y  c_y    d
0    0  1    2  1.0  1.0  1.0
1    0  1    2  1.0  1.0  1.0
   a_caller  b_caller  c_caller    d  a_other  b_other  c_other
A       1.0       1.0       1.0  1.0        0        1        2
B       1.0       1.0       1.0  1.0        3        4        5
'''
3.数据分组聚合
分组:df.groupby (by=‘Country’)
案例:

(1)中国和美国的星巴克数量
#coding=utf-8
import pandas as pd
import numpy as np
from matplotlib import pyplot as plt

#读取csv数据
file_path = 'G:\\pytorch_learning\\数据分析资料\\day05\\code\\starbucks_store_worldwide.csv'
df = pd.read_csv(file_path)
#分组
grouped = df.groupby(by='Country')
for i,j in grouped:
    print(i) #country
    print('-'*100)
    print(j)#group内的数据,DataFrame
    print('*'*100)
#分组,分出中国和美国
grouped_count = grouped['Brand'].count()#按brand计数
CN_count = grouped_count['CN']
US_count = grouped_count['US']
print('中国:',CN_count)
print('美国:',US_count)
'''result:
中国: 2734
美国: 13608
'''
(2)中国每个省份的星巴克数量
#coding=utf-8
import pandas as pd
import numpy as np
from matplotlib import pyplot as plt

#读取csv数据
file_path = 'G:\\pytorch_learning\\数据分析资料\\day05\\code\\starbucks_store_worldwide.csv'
df = pd.read_csv(file_path)
#统计中国每个省的店铺数量
china_data = df[df['Country']=='CN']#选出中国
grouped = china_data.groupby(by='State/Province')#按省分组
province_count = grouped['Brand'].count()#按Brand计数
print(province_count)
(3)按照多个条件分组(国家和省份)
会两个index,复合索引

#coding=utf-8
import pandas as pd
import numpy as np
from matplotlib import pyplot as plt

#读取csv数据
file_path = 'G:\\pytorch_learning\\数据分析资料\\day05\\code\\starbucks_store_worldwide.csv'
df = pd.read_csv(file_path)
#数据按照多个条件分组,此是的grouped是Series
grouped = df['Brand'].groupby(by=[df['Country'],df['State/Province']]).count()
print(grouped)

#返回DataFrame,grouped1,2,3是一样的
grouped1 = df[['Brand']].groupby(by=[df['Country'],df['State/Province']]).count()
grouped2 = df.groupby(by=[df['Country'],df['State/Province']])[['Brand']].count()
grouped3 = df[['Brand']].groupby(by=[df['Country'],df['State/Province']]).count()[['Brand']]
print(grouped1)
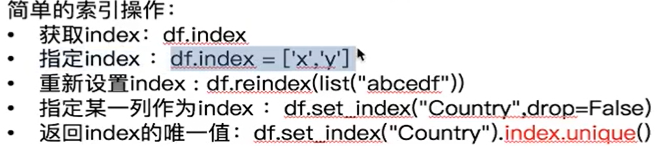
4.索引
#coding=utf-8
import pandas as pd
import numpy as np
from matplotlib import pyplot as plt

print('#####指定index和reindex不同#####')
df = pd.DataFrame(np.ones((2,4)),index= ['A','B'],columns=list('abcd'))
df.iloc[0,0] =100
print(df)
df.index = ['x','y']
print(df)
df_reindex=df.reindex(['x','q'])
print(df_reindex)

print('#####设置某一列或几列为索引#####')
df_a = df.set_index('a')
print('a这一列设为索引\n',df_a)
df_a2 = df.set_index('a',drop=False)
print('a这一列设为索引,且不删除a这一列\n',df_a2)
df_ab = df.set_index(['a','b'])
print('设置两列作为索引\n',df_ab)
df_ab = df.set_index('b').index.unique()
print('返回索引唯一值\n',df_ab)
'''result
#####指定index和reindex不同#####
       a    b    c    d
A  100.0  1.0  1.0  1.0
B    1.0  1.0  1.0  1.0
       a    b    c    d
x  100.0  1.0  1.0  1.0
y    1.0  1.0  1.0  1.0
       a    b    c    d
x  100.0  1.0  1.0  1.0
q    NaN  NaN  NaN  NaN
#####设置某一列作为索引#####
a这一列设为索引
          b    c    d
a
100.0  1.0  1.0  1.0
1.0    1.0  1.0  1.0
a这一列设为索引,且不删除a这一列
            a    b    c    d
a
100.0  100.0  1.0  1.0  1.0
1.0      1.0  1.0  1.0  1.0
设置两列作为索引
              c    d
a     b
100.0 1.0  1.0  1.0
1.0   1.0  1.0  1.0
返回索引唯一值
 Float64Index([1.0], dtype='float64', name='b')
'''
5.总结练习
df.swaplavel(),交换复合索引的顺序
复合索引的DadaFrame,取一列变为Series,再进行索引:
#coding=utf-8
import pandas as pd
import numpy as np

a = pd.DataFrame({'a':range(7),'b':range(7,0,-1),'c':['one','one','one','two','two','two','two'],'d':list('hjklmno')})
print(a)
b = a.set_index(['c','d'])#复合索引的DataFrame
print(b)

c = b['a'] #取其中一列,得到复合索引的Series
print(c)
print('只取one数据:\n',c['one'])
print('只取其中一个元素:\n',c['one','j'])     #c['one']['j']也可以

####交换复合索引顺序####
b2 = a.set_index(['d','c'])['a']
print(b2)
print('只取one数据:\n',b2.swaplevel()['one'])
'''result
   a  b    c  d
0  0  7  one  h
1  1  6  one  j
2  2  5  one  k
3  3  4  two  l
4  4  3  two  m
5  5  2  two  n
6  6  1  two  o
       a  b
c   d
one h  0  7
    j  1  6
    k  2  5
two l  3  4
    m  4  3
    n  5  2
    o  6  1
c    d
one  h    0
     j    1
     k    2
two  l    3
     m    4
     n    5
     o    6
Name: a, dtype: int64
只取one数据:
 d
h    0
j    1
k    2
Name: a, dtype: int64
只取其中一个元素:
 1
d  c
h  one    0
j  one    1
k  one    2
l  two    3
m  two    4
n  two    5
o  two    6
Name: a, dtype: int64
只取one数据:
 d
h    0
j    1
k    2
Name: a, dtype: int64
'''
复合索引的DadaFrame:
######b是DataFrame,对b的索引######
print('b中取到one,j对应的值:\n',b.loc['one'].loc['j'])
print('b中取h这一行的元素:\n',b.swaplevel().loc['h'])
'''result
b中取到one,j对应的值:
 a    1
b    6
Name: j, dtype: int64
b中取h这一行的元素:
      a  b
c
one  0  7
'''
(1)练习1
使用matplotlib呈现出店铺总数排名前10的国家
#coding=utf-8
import pandas as pd
import numpy as np
from matplotlib import pyplot as plt
from matplotlib import font_manager as fm

file_path = 'G:\\pytorch_learning\\数据分析资料\\day05\\code\\starbucks_store_worldwide.csv'
df = pd.read_csv(file_path)
#使用matplotlib呈现出店铺总数排名前10的国家
#准备数据
data1 = df.groupby(by ='Country').count()['Brand'].sort_values(ascending=False)[:10]
_x = data1.index
_y = data1.values
plt.figure(figsize=(18,7),dpi=80)
plt.bar(range(len(_x)),_y)
plt.xticks(range(len(_x)),_x)
plt.show()
使用matplotlib呈现中国每个城市的店铺数量(前15个城市)
#coding=utf-8
import pandas as pd
import numpy as np
from matplotlib import pyplot as plt
from matplotlib import font_manager as fm

my_font =  fm.FontProperties(fname='C:/Windows/Fonts/msyh.ttc')
file_path = 'G:\\pytorch_learning\\数据分析资料\\day05\\code\\starbucks_store_worldwide.csv'
df = pd.read_csv(file_path)
#使用matplotlib呈现中国每个城市的店铺数量(前15个城市)
data2 = df[df['Country']=='CN'].groupby(by = 'City').count()['Brand'].sort_values(ascending=False)[:15]
_x = data2.index
_y = data2.values
plt.figure(figsize=(18,7),dpi=80)
plt.bar(range(len(_x)),_y,width=0.5,color = 'orange')
plt.xticks(range(len(_x)),_x,fontproperties = my_font)
plt.show()
(2)练习2
#coding=utf-8
import pandas as pd
import numpy as np
from matplotlib import pyplot as plt

file_path = 'G:\\pytorch_learning\\数据分析资料\\day06\\code\\books.csv'
df = pd.read_csv(file_path)
#统计不同年份书的数量
#删除发表年份这一列有缺失的数据
data1 = df[pd.notnull(df['original_publication_year'])]
data1_count = data1.groupby(by='original_publication_year').count()['id']
print(data1_count)

#统计不同年份书的平均评分情况
data1_group = data1['average_rating'].groupby(by=data1['original_publication_year']).mean()#注意这里的by
_x = data1_group.index
_y = data1_group.values

#画图
plt.figure(figsize=(20,8),dpi=80)
plt.plot(range(len(_x)),_y)
plt.xticks(list(range(len(_x)))[::10],_x[::10],rotation = 45)#太密了,取间隔
plt.show()


 166
166


 被折叠的 条评论
为什么被折叠?
被折叠的 条评论
为什么被折叠?
 到【灌水乐园】发言


