


 本文介绍使用SKLearn进行红酒数据集的探索与分析,详细解析数据集的结构与属性,包括数据类型、特征变量、标签分布等,并利用pandas进行数据可视化。
刚刚使用SKLearn学习机器学习进行数据分析,分享一些概念和想法,希望可以大家一起讨论,如果理解或者表达有不准确的地方,请多多指点,不吝赐教,非常感谢~~
在sklearn.datasets库中有非常多的知名数据集,在使用数据集前我总是对数据没有直观了解,所以下面整理一些datasets库中数据集的属性及方法,以红酒数据集为例。随着学习还会持续更新!
- 导入数据集模块并实例化一个数据集
from sklearn.datasets import load_wine
wine = load_wine()
- 探索数据集
- 数据集类型
# 查看数据集类型
type(wine)						# 结果 sklearn.utils.Bunch
- 打印数据集
#这里是sklearn.datasets库中各个模块的方法和属性
#将此库中的数据实例化后,便继承了库中模块的功能和属性
wine
---------------------------
# 得到一个“字典”{key1:value1,key2:value2}
{'data': array([[1.423e+01, 1.710e+00, 2.430e+00, ..., 1.040e+00, 3.920e+00,
         1.065e+03],
        [1.320e+01, 1.780e+00, 2.140e+00, ..., 1.050e+00, 3.400e+00,
         1.050e+03],
        [1.316e+01, 2.360e+00, 2.670e+00, ..., 1.030e+00, 3.170e+00,
         1.185e+03],
        ...,
        [1.327e+01, 4.280e+00, 2.260e+00, ..., 5.900e-01, 1.560e+00,
         8.350e+02],
        [1.317e+01, 2.590e+00, 2.370e+00, ..., 6.000e-01, 1.620e+00,
         8.400e+02],
        [1.413e+01, 4.100e+00, 2.740e+00, ..., 6.100e-01, 1.600e+00,
         5.600e+02]]),
 'target': array([0, 0, 0, 0, 0, 0, 0, 0, 0, 0, 0, 0, 0, 0, 0, 0, 0, 0, 0, 0, 0, 0,
        0, 0, 0, 0, 0, 0, 0, 0, 0, 0, 0, 0, 0, 0, 0, 0, 0, 0, 0, 0, 0, 0,
        0, 0, 0, 0, 0, 0, 0, 0, 0, 0, 0, 0, 0, 0, 0, 1, 1, 1, 1, 1, 1, 1,
        1, 1, 1, 1, 1, 1, 1, 1, 1, 1, 1, 1, 1, 1, 1, 1, 1, 1, 1, 1, 1, 1,
        1, 1, 1, 1, 1, 1, 1, 1, 1, 1, 1, 1, 1, 1, 1, 1, 1, 1, 1, 1, 1, 1,
        1, 1, 1, 1, 1, 1, 1, 1, 1, 1, 1, 1, 1, 1, 1, 1, 1, 1, 1, 1, 2, 2,
        2, 2, 2, 2, 2, 2, 2, 2, 2, 2, 2, 2, 2, 2, 2, 2, 2, 2, 2, 2, 2, 2,
        2, 2, 2, 2, 2, 2, 2, 2, 2, 2, 2, 2, 2, 2, 2, 2, 2, 2, 2, 2, 2, 2,
        2, 2]),
 'target_names': array(['class_0', 'class_1', 'class_2'], dtype='<U7'),
 'DESCR': '.. _wine_dataset:\n\nWine recognition dataset\n------------------------\n\n**Data Set Characteristics:**\n\n    :Number of Instances: 178 (50 in each of three classes)\n    :Number of Attributes: 13 numeric, predictive attributes and the class\n    :Attribute Information:\n \t\t- Alcohol\n \t\t- Malic acid\n \t\t- Ash\n\t\t- Alcalinity of ash  \n \t\t- Magnesium\n\t\t- Total phenols\n \t\t- Flavanoids\n \t\t- Nonflavanoid phenols\n \t\t- Proanthocyanins\n\t\t- Color intensity\n \t\t- Hue\n \t\t- OD280/OD315 of diluted wines\n \t\t- Proline\n\n    - class:\n            - class_0\n            - class_1\n            - class_2\n\t\t\n    :Summary Statistics:\n    \n    ============================= ==== ===== ======= =====\n                                   Min   Max   Mean     SD\n    ============================= ==== ===== ======= =====\n    Alcohol:                      11.0  14.8    13.0   0.8\n    Malic Acid:                   0.74  5.80    2.34  1.12\n    Ash:                          1.36  3.23    2.36  0.27\n    Alcalinity of Ash:            10.6  30.0    19.5   3.3\n    Magnesium:                    70.0 162.0    99.7  14.3\n    Total Phenols:                0.98  3.88    2.29  0.63\n    Flavanoids:                   0.34  5.08    2.03  1.00\n    Nonflavanoid Phenols:         0.13  0.66    0.36  0.12\n    Proanthocyanins:              0.41  3.58    1.59  0.57\n    Colour Intensity:              1.3  13.0     5.1   2.3\n    Hue:                          0.48  1.71    0.96  0.23\n    OD280/OD315 of diluted wines: 1.27  4.00    2.61  0.71\n    Proline:                       278  1680     746   315\n    ============================= ==== ===== ======= =====\n\n    :Missing Attribute Values: None\n    :Class Distribution: class_0 (59), class_1 (71), class_2 (48)\n    :Creator: R.A. Fisher\n    :Donor: Michael Marshall (MARSHALL%PLU@io.arc.nasa.gov)\n    :Date: July, 1988\n\nThis is a copy of UCI ML Wine recognition datasets.\nhttps://archive.ics.uci.edu/ml/machine-learning-databases/wine/wine.data\n\nThe data is the results of a chemical analysis of wines grown in the same\nregion in Italy by three different cultivators. There are thirteen different\nmeasurements taken for different constituents found in the three types of\nwine.\n\nOriginal Owners: \n\nForina, M. et al, PARVUS - \nAn Extendible Package for Data Exploration, Classification and Correlation. \nInstitute of Pharmaceutical and Food Analysis and Technologies,\nVia Brigata Salerno, 16147 Genoa, Italy.\n\nCitation:\n\nLichman, M. (2013). UCI Machine Learning Repository\n[https://archive.ics.uci.edu/ml]. Irvine, CA: University of California,\nSchool of Information and Computer Science. \n\n.. topic:: References\n\n  (1) S. Aeberhard, D. Coomans and O. de Vel, \n  Comparison of Classifiers in High Dimensional Settings, \n  Tech. Rep. no. 92-02, (1992), Dept. of Computer Science and Dept. of  \n  Mathematics and Statistics, James Cook University of North Queensland. \n  (Also submitted to Technometrics). \n\n  The data was used with many others for comparing various \n  classifiers. The classes are separable, though only RDA \n  has achieved 100% correct classification. \n  (RDA : 100%, QDA 99.4%, LDA 98.9%, 1NN 96.1% (z-transformed data)) \n  (All results using the leave-one-out technique) \n\n  (2) S. Aeberhard, D. Coomans and O. de Vel, \n  "THE CLASSIFICATION PERFORMANCE OF RDA" \n  Tech. Rep. no. 92-01, (1992), Dept. of Computer Science and Dept. of \n  Mathematics and Statistics, James Cook University of North Queensland. \n  (Also submitted to Journal of Chemometrics).\n',
 'feature_names': ['alcohol',
  'malic_acid',
  'ash',
  'alcalinity_of_ash',
  'magnesium',
  'total_phenols',
  'flavanoids',
  'nonflavanoid_phenols',
  'proanthocyanins',
  'color_intensity',
  'hue',
  'od280/od315_of_diluted_wines',
  'proline']}

# 需要注意的是,字典数据类型本身是无法直接打印字典的
- 分别打印数据集的键和值
wine.keys()
wine.values()

dict_keys(['data', 'target', 'target_names', 'DESCR', 'feature_names'])
dict_values(...略...)
- 探索数据集的每一对键值
(1)data,数据类型是array——数据集中的数据
# 查看"data"对应的值
wine.data					# 结果 返回对应的值,数据类型为:“array”

# 查看“data"的数据“结构”
wine.data.shape				# 结果 (178, 13) 说明一共178行,13列(即数据集中有13个特征变量)

# 对比“字典”的基本操作中,是无法直接使用:字典.键值 获得其对应的值的
(2)target,数据类型是array——数据集中各个数据的标签
(3)feature_names,数据类型是list——数据集特征变量的名称
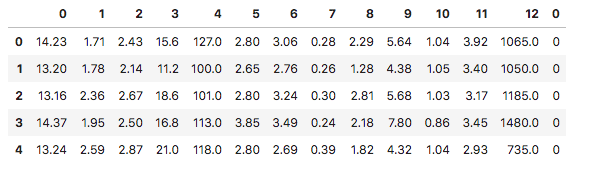
- 直观的观察样本的特征以及标签
# 使用pandas对数据进行可视化表操作
import pandas as pd
# 将“样本数据”和“标签”按照“行向”连接起来
sample=pd.concat([pd.DataFrame(wine.data),pd.DataFrame(wine.target)],axis=1)
# 展示表格的头5行数据
sample.head()
– 待续
想了解sklearn数据集是如何建模的,请访问其他文章,例如《sklearn的DecisionTreeClassifier与红酒数据集(criterion及创建一个树)》:https://blog.csdn.net/weixin_42969619/article/details/98884082
如果想了解pandas如何对数据操作的,请查看《python_pandas(创建/加载数据/选择数据)》:https://blog.csdn.net/weixin_42969619/article/details/96863875


 424
424

 被折叠的 条评论
为什么被折叠?
被折叠的 条评论
为什么被折叠?
 到【灌水乐园】发言


