


 本文档详细记录了一位博士研究生如何用C++通过matplotlib-cpp库实现类似Python的便捷绘图,过程中遇到的std::stod报错和Python接口链接问题,以及解决步骤,包括修改头文件、配置VS项目和安装对应Python版本。
作者简介
很高兴认识您!
我叫卢家波,河海大学水文学及水资源博士研究生,研究兴趣为高效洪水淹没预测、洪水灾害预警、机器学习、替代模型和降阶模型。
变化环境下,极端洪水事件多发,我希望能通过研究为水灾害防御做出贡献,为人民服务。
欢迎交流讨论和研究合作,vx Jiabo_Lu。
主页 https://lujiabo98.github.io
简历 https://lujiabo98.github.io/file/CV_JiaboLu_zh.pdf
博客 https://blog.csdn.net/weixin_43012724?type=blog
来信请说明博客标题及链接,谢谢。
目的
2022/4/8
本地目录:E:\Master\study\Cpp\Plot
想用C++实现Python、Matlab、R语言那样便捷的绘图,网上搜了一圈,发现有给Python的matplotlib做了C++接口的第三方库,于是尝试下载使用。
过程
花了一天时间,完成了配置。
主要参考了三篇博客:
VS项目中配置matplotlib-cpp绘制图片
VisualStudio2019 c++安装matplotlib-cpp
c++调用matplotlib一
配置
-
包含头文件及命名空间
#include "matplotlibcpp.h" namespace plt = matplotlibcpp; -
项目属性 → \rightarrow → 配置:所有配置 → \rightarrow → 平台:所有平台 → \rightarrow → C/C++ → \rightarrow → 常规 → \rightarrow → 附加包含目录 → \rightarrow → 添加python include文件夹和numpy include文件夹的位置
C:\Users\LJB\AppData\Local\Programs\Python\Python38-32\include C:\Users\LJB\AppData\Local\Programs\Python\Python38-32\Lib\site-packages\numpy\core\include -
项目属性 → \rightarrow → 链接器 → \rightarrow → 常规 → \rightarrow → 附加库目录 → \rightarrow → 添加python libs文件夹的位置
C:\Users\LJB\AppData\Local\Programs\Python\Python38-32\libs -
项目属性 → \rightarrow → 链接器 → \rightarrow → 输入 → \rightarrow → 添加依赖项 → \rightarrow → 添加libs文件夹内的.lib文件
python3.lib python38.lib _tkinter.lib -
项目属性 → \rightarrow → 常规 → \rightarrow → C++语言标准 → \rightarrow → ISO C++ 17标准 或 以上
遇到的问题
1
std::stod这句话会报错,原因是系统报std不包含stod函数。
第一篇博客里都提了解决办法,但是这个问题的原因是matplotlibcpp.h文件忘记包含string头文件了,添加即可
#include <string>
2
1>Plot.obj : error LNK2001: 无法解析的外部符号 __imp_PyFunction_Type
1>Plot.obj : error LNK2001: 无法解析的外部符号 __imp_PyImport_ImportModule
1>Plot.obj : error LNK2001: 无法解析的外部符号 __imp_PyExc_RuntimeError
1>Plot.obj : error LNK2001: 无法解析的外部符号 __imp_PyTuple_New
1>Plot.obj : error LNK2001: 无法解析的外部符号 __imp_PyDict_SetItemString
1>Plot.obj : error LNK2001: 无法解析的外部符号 __imp_PyFloat_FromDouble
1>Plot.obj : error LNK2001: 无法解析的外部符号 __imp_PyExc_AttributeError
1>Plot.obj : error LNK2001: 无法解析的外部符号 __imp_PyErr_SetString
1>Plot.obj : error LNK2001: 无法解析的外部符号 __imp_PyErr_Format
1>Plot.obj : error LNK2001: 无法解析的外部符号 __imp_Py_Finalize
1>Plot.obj : error LNK2001: 无法解析的外部符号 __imp_Py_SetProgramName
1>Plot.obj : error LNK2001: 无法解析的外部符号 __imp__Py_Dealloc
1>Plot.obj : error LNK2001: 无法解析的外部符号 __imp_Py_Initialize
1>Plot.obj : error LNK2001: 无法解析的外部符号 __imp_PyCapsule_GetPointer
1>Plot.obj : error LNK2001: 无法解析的外部符号 __imp_PyList_New
1>Plot.obj : error LNK2001: 无法解析的外部符号 __imp_PyObject_GetAttrString
1>Plot.obj : error LNK2001: 无法解析的外部符号 __imp_PyDict_New
1>Plot.obj : error LNK2001: 无法解析的外部符号 __imp_PyObject_CallMethod
1>Plot.obj : error LNK2001: 无法解析的外部符号 __imp_PyTuple_SetItem
1>Plot.obj : error LNK2001: 无法解析的外部符号 __imp_PySys_SetArgv
1>Plot.obj : error LNK2001: 无法解析的外部符号 __imp_PyObject_CallObject
1>Plot.obj : error LNK2001: 无法解析的外部符号 __imp_PyImport_Import
1>Plot.obj : error LNK2001: 无法解析的外部符号 __imp_PyCapsule_Type
1>Plot.obj : error LNK2001: 无法解析的外部符号 __imp_PyExc_ImportError
1>Plot.obj : error LNK2001: 无法解析的外部符号 __imp_PyList_SetItem
1>Plot.obj : error LNK2001: 无法解析的外部符号 __imp_PyErr_Print
1>Plot.obj : error LNK2001: 无法解析的外部符号 __imp_PyUnicode_FromString
1>Plot.obj : error LNK2001: 无法解析的外部符号 __imp_PyObject_Call
1>E:\Master\study\Cpp\Plot\x64\Release\Plot.exe : fatal error LNK1120: 28 个无法解析的外部命令
这个是由于测试程序的配置是x64,而我安装的是32位的Python,因此不能匹配,所以两种解决思路:
- 安装64位Python
- 配置改为
x86
3
还要注意用Vcpkg安装matplotlib-cpp时,选择对应版本安装
默认安装32位
.\vcpkg install matplotlib-cpp
这样是安装64位
.\vcpkg install matplotlib-cpp:x64-windows
如果下载慢,可以先下载,再编译
默认安装32位
.\vcpkg install matplotlib-cpp --only-downloads
.\vcpkg install matplotlib-cpp
这样是安装64位
.\vcpkg install matplotlib-cpp:x64-windows --only-downloads
.\vcpkg install matplotlib-cpp:x64-windows
最终成功
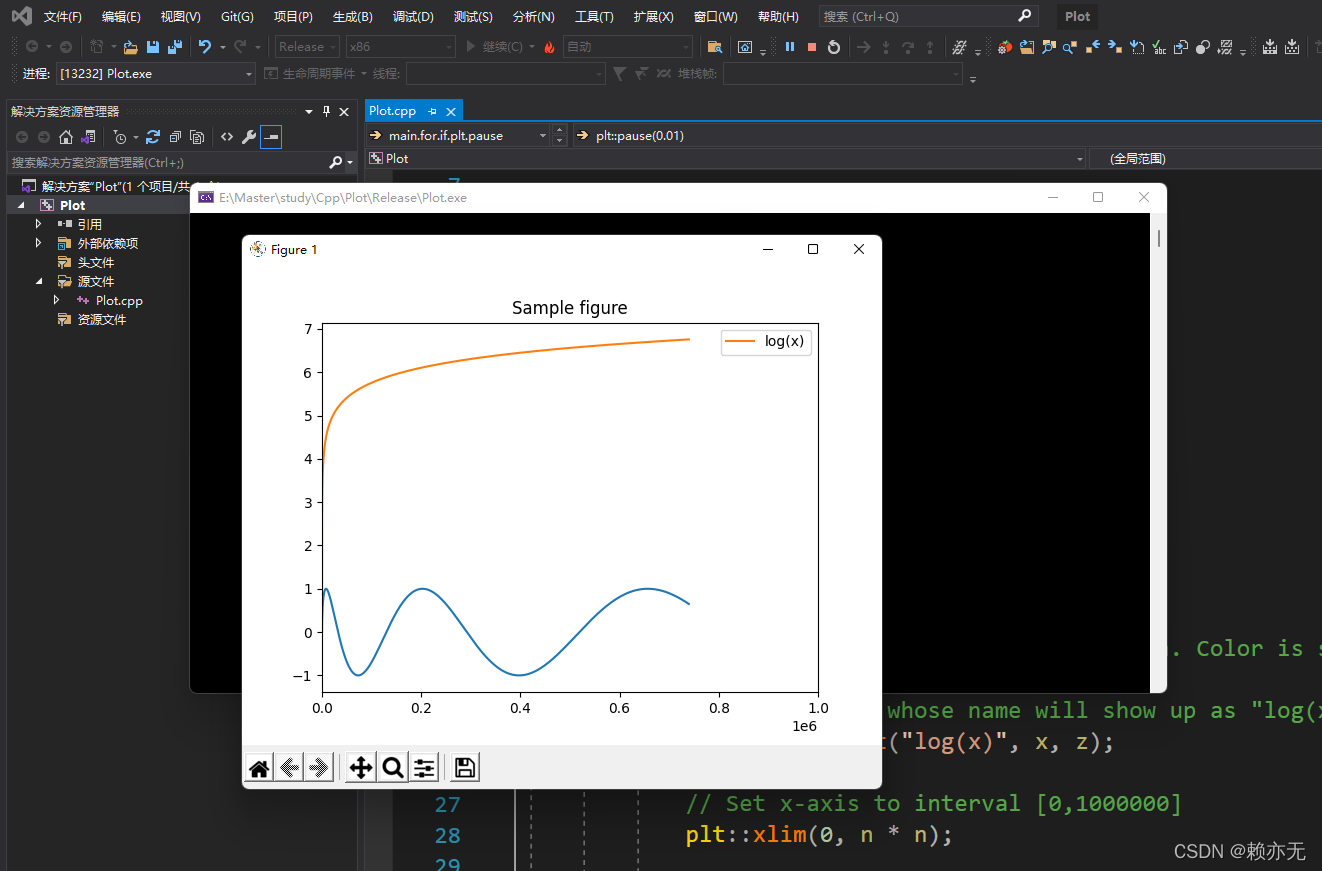
测试代码
本地目录:E:\Master\study\Cpp\Plot
Plot.cpp:
// Plot.cpp : 此文件包含 "main" 函数。程序执行将在此处开始并结束。
//

#include <iostream>

#include "matplotlibcpp.h"

namespace plt = matplotlibcpp;

int main() {
	int n = 1000;
	std::vector<double> x, y, z;
	int count = 1;
	for (int i = 0; i < n; i++) {
		x.push_back(i * i);
		y.push_back(sin(2 * 3.14 * i / 360.0));
		z.push_back(log(i));

		if (i % 10 == 0) {
			// Clear previous plot
			plt::clf();
			// Plot line from given x and y data. Color is selected automatically.
			plt::plot(x, y);
			// Plot a line whose name will show up as "log(x)" in the legend.
			plt::named_plot("log(x)", x, z);

			// Set x-axis to interval [0,1000000]
			plt::xlim(0, n * n);

			// Add graph title
			plt::title("Sample figure");
			// Enable legend.
			plt::legend();
			// Display plot continuously
			std::string pathObj = "animation//" + std::to_string(count);
			//plt::save(pathObj );
			plt::pause(0.01);
			count++;
		}
	}
}


 907
907

 被折叠的 条评论
为什么被折叠?
被折叠的 条评论
为什么被折叠?
 到【灌水乐园】发言


