


PS1: 以下代码使用py3.7执行,原书出版于2013年(大概是),示例代码都是10年和11年写的, 使用的是py2的语法, 有许多不能执行,如:
- dict_keys.keys()[*]
- dict.iteritems()
- 等
PS2:所有代码均在Jupyter Notebook上测试, 所需包及版本如下
- numpy :1.16.5
- matplotlib :3.1.1
3 决策树
计算给定数据集的香农熵
from math import log

def calcShannonEnt(dataSet):
    numEntrys = len(dataSet)
    labelCounts = {}
    for featVec in dataSet:
        currentLabel = featVec[-1]
        if currentLabel not in labelCounts.keys():
            labelCounts[currentLabel] = 0
        labelCounts[currentLabel] += 1
    shannonEnt = 0.0
    for key in labelCounts:
        prob = float(labelCounts[key])/numEntrys
        shannonEnt -= log(prob, 2)*prob
    return shannonEnt
dataSet = [[1,1,'yes'],[1,0,'yes'],[1,0,'no'],[0,1,'no'],[0,1,'no']]
calcShannonEnt(dataSet)
0.9709505944546686
按照给定的特征划分数据集
def splitDataSet(dataSet, axis, value):
    retDataSet = []
    for featVec in dataSet:
        if featVec[axis] == value:
            reduceFeatVec = featVec[:axis]
            reduceFeatVec.extend(featVec[axis+1:])
            retDataSet.append(reduceFeatVec)
    return retDataSet
splitDataSet(dataSet, 0, 0)
[[1, 'no'], [1, 'no']]
选择最好的数据集划分方式
def chooseBestFeatureToSplit(dataSet):
    numFeatures = len(dataSet[0]) - 1 # 最后一位是标签
    baseEntropy = calcShannonEnt(dataSet)
    bestInfoGain = 0.0; bestFeature = -1
    for i in range(numFeatures): #迭代所有特征
        print("The",str(i)+'th',"feature:")
        featList = [example[i] for example in dataSet]
        uniqueVals = set(featList)
        newEntropy = 0.0
        for value in uniqueVals:
            subDataSet = splitDataSet(dataSet, i, value)
            prob = len(subDataSet)/float(len(dataSet))
            newEntropy += prob * calcShannonEnt(subDataSet)
        print(newEntropy)
        infoGain = baseEntropy - newEntropy
        if (infoGain > bestInfoGain):
            bestInfoGain = infoGain
            bestFeature = i
    return bestFeature
chooseBestFeatureToSplit(dataSet)
The 0th feature:
0.5509775004326937
The 1th feature:
0.9509775004326937


0
set() 函数创建一个无序不重复元素集,可进行关系测试,删除重复数据,还可以计算交集、差集、并集等。
多数表决函数
该函数返回出现次数最多的分类名称
import operator
def majorityCnt(classList):
    classCount={}
    for vote in classList:
        if vote not in classCount.keys():
            classCount[vote] = 0
        classCount[vote] += 1
    sortedClassCount = sorted(classCount.items(), key=operator.itemgetter(1), reverse=True)
    return sortedClassCount[0][0]
创建树函数
def createTree(dataSet,labels):
    classList = [example[-1] for example in dataSet]
#     当所有分类都相同的话就停止继续划分
    if classList.count(classList[0]) == len(classList):
        return classList[0]
#     当没有特征的时候停止划分,因为没什么能够划分的了
#     dataSet[0]只是取第一个数据的特征,与后面数据的特征数相同
    if len(dataSet[0]) == 1:
        return majorityCnt(classList)
#   以上条件都不满足的情况下继续划分
#   找到最佳划分的特征
    bestFeat = chooseBestFeatureToSplit(dataSet)
    bestFeatLabel = labels[bestFeat]
    myTree = {bestFeatLabel:{}}
#   删除分类
    del(labels[bestFeat])
    featValues = [example[bestFeat] for example in dataSet]
#   得到剩余的特征
    uniqueVals = set(featValues)
    for value in uniqueVals:
        subLabels = labels[:]
        myTree[bestFeatLabel][value] = createTree(
            splitDataSet(dataSet, bestFeat, value),subLabels)
    return myTree
dataSet = [[1,1,'yes'],[1,0,'yes'],[1,0,'no'],[0,1,'no'],[0,1,'no']]
labels = ['no surfacing','flippers' ]
labels.index('no surfacing')
0
myTree = createTree(dataSet, labels)
The 0th feature:
0.5509775004326937
The 1th feature:
0.9509775004326937
The 0th feature:
0.6666666666666666
myTree
{'no surfacing': {0: 'no', 1: {'flippers': {0: 'yes', 1: 'yes'}}}}
测试函数
def classify(inputTree,featLabels,testVec):
#     print(list(inputTree.keys())[0])
    firstStr = list(inputTree.keys())[0]
#     print(firstStr)
    secondDict = inputTree[firstStr]
    featIndex = featLabels.index(firstStr)
    key = testVec[featIndex]
    valueOfFeat = secondDict[key]
    if isinstance(valueOfFeat, dict):
        classLabel = classify(valueOfFeat, featLabels, testVec)
    else: classLabel = valueOfFeat
    return classLabel
classify(myTree, labels, [0,0] )
---------------------------------------------------------------------------

NameError                                 Traceback (most recent call last)

<ipython-input-2-b04367226231> in <module>
----> 1 classify(myTree, labels, [0,0] )


NameError: name 'myTree' is not defined
存储树
def storeTree(inputTree,filename):
    import pickle
    fw = open(filename,'wb')
    pickle.dump(inputTree,fw)
    fw.close()
storeTree(myTree,'myTree')
myTree
{'no surfacing': {0: 'no', 1: {'flippers': {0: 'yes', 1: 'yes'}}}}
加载树
def grabTree(filename):
    import pickle
    fr = open(filename,'rb+')
    return pickle.load(fr)
grabTree('myTree')
{'no surfacing': {0: 'no', 1: {'flippers': {0: 'yes', 1: 'yes'}}}}
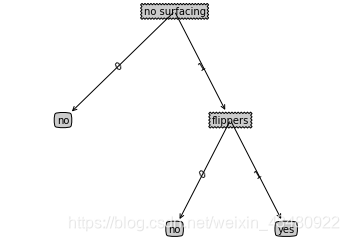
3.2 使用Matplotlib注解绘制树形图
Matplotlib提供了一个非常有用的注解工具annotations, 它可以在数据图形上添加文本注解
3.2.1 Matplotlib注解
import matplotlib.pyplot as plt
# 定义决策树决策结果的属性,用字典来定义
# 下面的字典定义也可写作 decisionNode={boxstyle:'sawtooth',fc:'0.8'}
# boxstyle为文本框的类型,sawtooth是锯齿形,fc是边框线粗细
decisionNode = dict(boxstyle="sawtooth", fc="0.8")
leafNode = dict(boxstyle="round4", fc="0.8")
arrow_args = dict(arrowstyle="<-")
<matplotlib.axes._subplots.AxesSubplot at 0x1af02b8feb8>
def plotNode(nodeTxt, centerPt, parentPt, nodeType):
    createPlot.ax1.annotate(nodeTxt, xy=parentPt,  xycoords='axes fraction',
                 xytext=centerPt, textcoords='axes fraction',
             va="center", ha="center", bbox=nodeType, arrowprops=arrow_args )
得到树的叶子数和深度
def getNumLeafs(myTree):
    numLeafs = 0
    firstStr = list(myTree.keys())[0]
    secondDict = myTree[firstStr]
    for key in secondDict.keys():
        if type(secondDict[key]).__name__=='dict':#test to see if the nodes are dictonaires, if not they are leaf nodes
            numLeafs += getNumLeafs(secondDict[key])
        else:   numLeafs +=1
    return numLeafs

def getTreeDepth(myTree):
    maxDepth = 0
    firstStr = list(myTree.keys())[0]
    secondDict = myTree[firstStr]
    for key in secondDict.keys():
        if type(secondDict[key]).__name__=='dict':#test to see if the nodes are dictonaires, if not they are leaf nodes
            thisDepth = 1 + getTreeDepth(secondDict[key])
        else:   thisDepth = 1
        if thisDepth > maxDepth: maxDepth = thisDepth
    return maxDepth
# 预先存储树的信息,避免每次测试代码都要从数据中创建树的麻烦
#
def retrieveTree(i):
    listOfTrees =[{'no surfacing': {0: 'no', 1: {'flippers': {0: 'no', 1: 'yes'}}}},
                  {'no surfacing': {0: 'no', 1: {'flippers': {0: {'head': {0: 'no', 1: 'yes'}}, 1: 'no'}}}}
                  ]
    return listOfTrees[i]
getNumLeafs(retrieveTree(0))
3
def plotMidText(cntrPt, parentPt, txtString):
    xMid = (parentPt[0]-cntrPt[0])/2.0 + cntrPt[0]
    yMid = (parentPt[1]-cntrPt[1])/2.0 + cntrPt[1]
    createPlot.ax1.text(xMid, yMid, txtString, va="center", ha="center", rotation=30)
def plotTree(myTree, parentPt, nodeTxt):#if the first key tells you what feat was split on
    numLeafs = getNumLeafs(myTree)  #this determines the x width of this tree
    depth = getTreeDepth(myTree)
    firstStr = list(myTree.keys())[0]     #the text label for this node should be this
    cntrPt = (plotTree.xOff + (1.0 + float(numLeafs))/2.0/plotTree.totalW, plotTree.yOff)
    plotMidText(cntrPt, parentPt, nodeTxt)
    plotNode(firstStr, cntrPt, parentPt, decisionNode)
    secondDict = myTree[firstStr]
    plotTree.yOff = plotTree.yOff - 1.0/plotTree.totalD
    for key in secondDict.keys():
        if type(secondDict[key]).__name__=='dict':#test to see if the nodes are dictonaires, if not they are leaf nodes
            plotTree(secondDict[key],cntrPt,str(key))        #recursion
        else:   #it's a leaf node print the leaf node
            plotTree.xOff = plotTree.xOff + 1.0/plotTree.totalW
            plotNode(secondDict[key], (plotTree.xOff, plotTree.yOff), cntrPt, leafNode)
            plotMidText((plotTree.xOff, plotTree.yOff), cntrPt, str(key))
    plotTree.yOff = plotTree.yOff + 1.0/plotTree.totalD
def createPlot(inTree):
    fig = plt.figure(1, facecolor='white')
    fig.clf()
    axprops = dict(xticks=[], yticks=[])
    createPlot.ax1 = plt.subplot(111, frameon=False, **axprops)    #no ticks
    #createPlot.ax1 = plt.subplot(111, frameon=False) #ticks for demo puropses
    plotTree.totalW = float(getNumLeafs(inTree))
    plotTree.totalD = float(getTreeDepth(inTree))
    plotTree.xOff = -0.5/plotTree.totalW; plotTree.yOff = 1.0;
    plotTree(inTree, (0.5,1.0), '')
    plt.show()
createPlot(myTree)


 653
653


 被折叠的 条评论
为什么被折叠?
被折叠的 条评论
为什么被折叠?
 到【灌水乐园】发言


