


论文地址:https://arxiv.org/abs/1902.09212
模型结构:HRNet网络简介-CSDN博客
模型代码:https://github.com/WZMIAOMIAO/deep-learning-for-image-processing/tree/master/pytorch_keypoint/HRNet
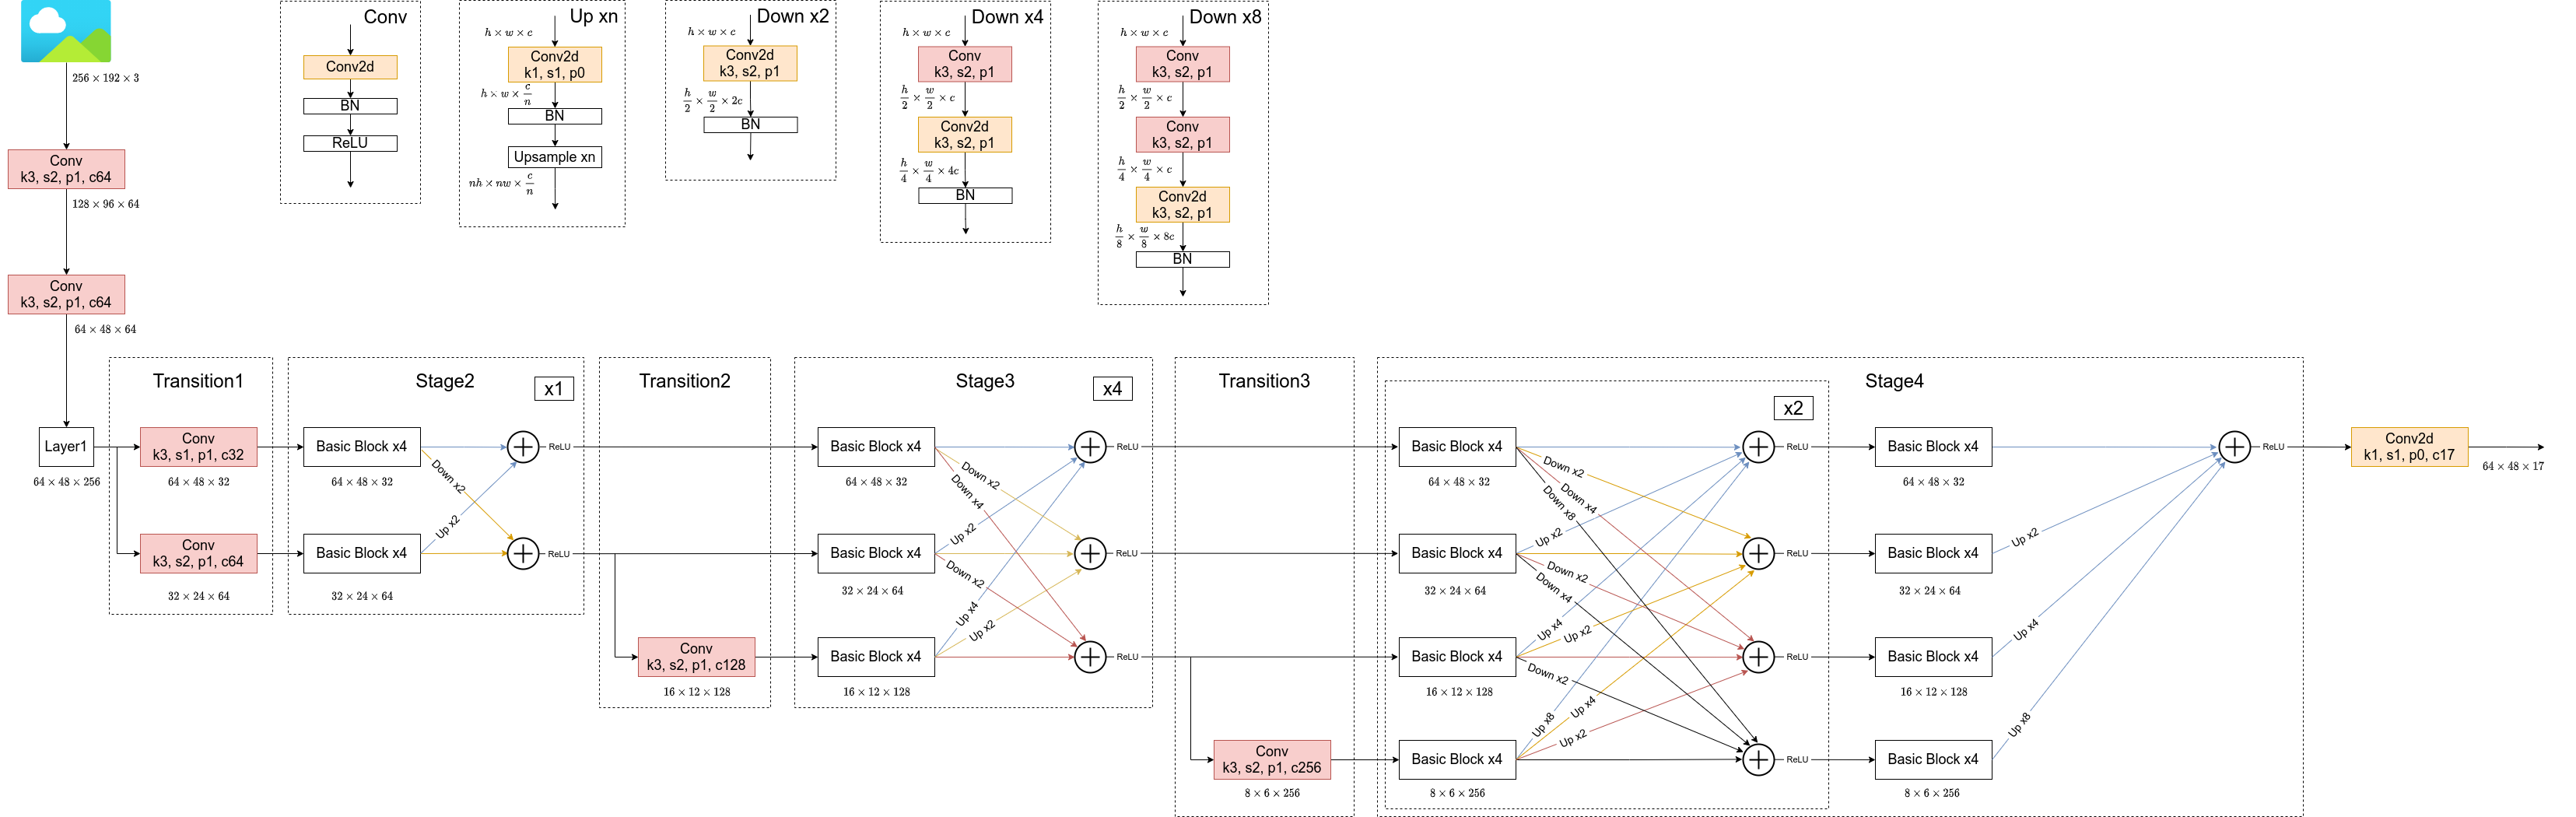
1. 模型结构图
2. 数据预处理
2.1. 训练数据
data_transform = {
"train": transforms.Compose([
transforms.HalfBody(0.3, person_kps_info["upper_body_ids"], person_kps_info["lower_body_ids"]),
transforms.AffineTransform(scale=(0.65, 1.35), rotation=(-45, 45), fixed_size=fixed_size),
transforms.RandomHorizontalFlip(0.5, person_kps_info["flip_pairs"]),
transforms.KeypointToHeatMap(heatmap_hw=heatmap_hw, gaussian_sigma=2, keypoints_weights=kps_weights),
transforms.ToTensor(),
transforms.Normalize(mean=[0.485, 0.456, 0.406], std=[0.229, 0.224, 0.225])
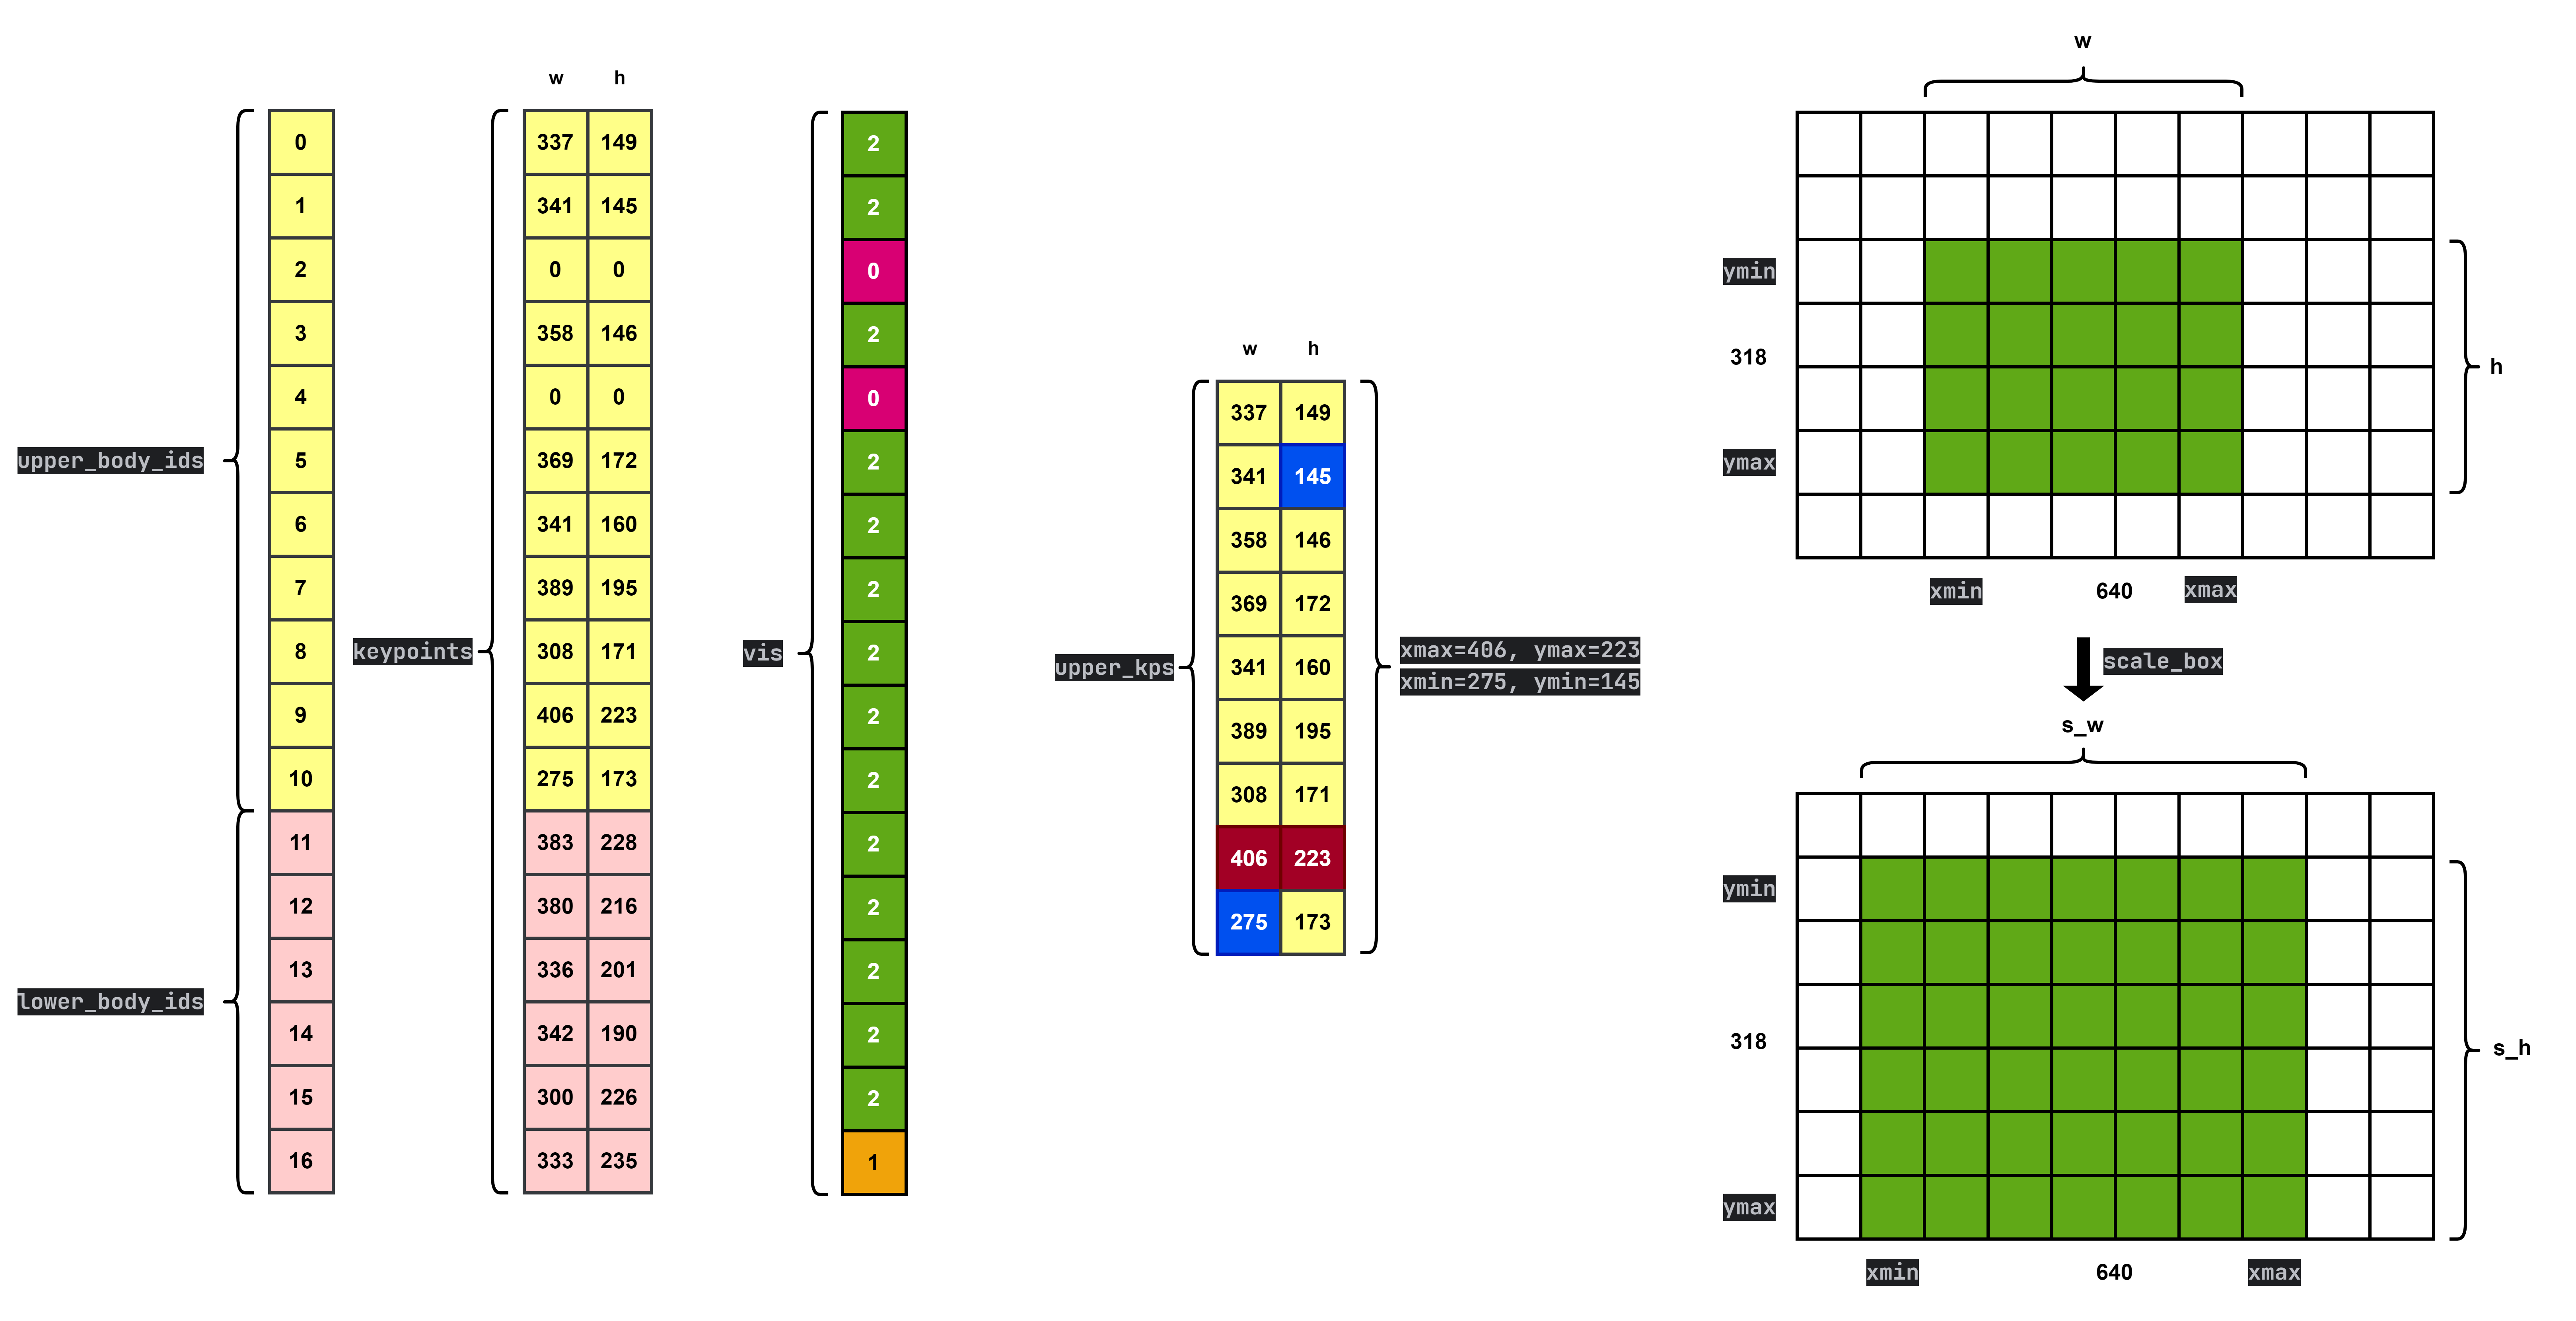
]),2.1.1. HalfBody
随机选择上半身或者下半身关键点
class HalfBody(object):
    def __init__(self, p: float = 0.3, upper_body_ids=None, lower_body_ids=None):
        assert upper_body_ids is not None
        assert lower_body_ids is not None
        self.p = p
        self.upper_body_ids = upper_body_ids
        self.lower_body_ids = lower_body_ids

    def __call__(self, image, target):
        if random.random() < self.p:
            kps = target["keypoints"]
            vis = target["visible"]
            upper_kps = []
            lower_kps = []

            # 对可见的keypoints进行归类
            for i, v in enumerate(vis):
                if v > 0.5:
                    if i in self.upper_body_ids:
                        upper_kps.append(kps[i])
                    else:
                        lower_kps.append(kps[i])

            # 50%的概率选择上或下半身
            if random.random() < 0.5:
                selected_kps = upper_kps
            else:
                selected_kps = lower_kps

            # 如果点数太少就不做任何处理
            if len(selected_kps) > 2:
                selected_kps = np.array(selected_kps, dtype=np.float32)
                xmin, ymin = np.min(selected_kps, axis=0).tolist()
                xmax, ymax = np.max(selected_kps, axis=0).tolist()
                w = xmax - xmin
                h = ymax - ymin
                if w > 1 and h > 1:
                    # 把w和h适当放大点,要不然关键点处于边缘位置
                    xmin, ymin, w, h = scale_box(xmin, ymin, w, h, (1.5, 1.5))
                    target["box"] = [xmin, ymin, w, h]

return image, target输入:image(array 格式的图片 [h, w, 3])、target(字典结构)
![]()
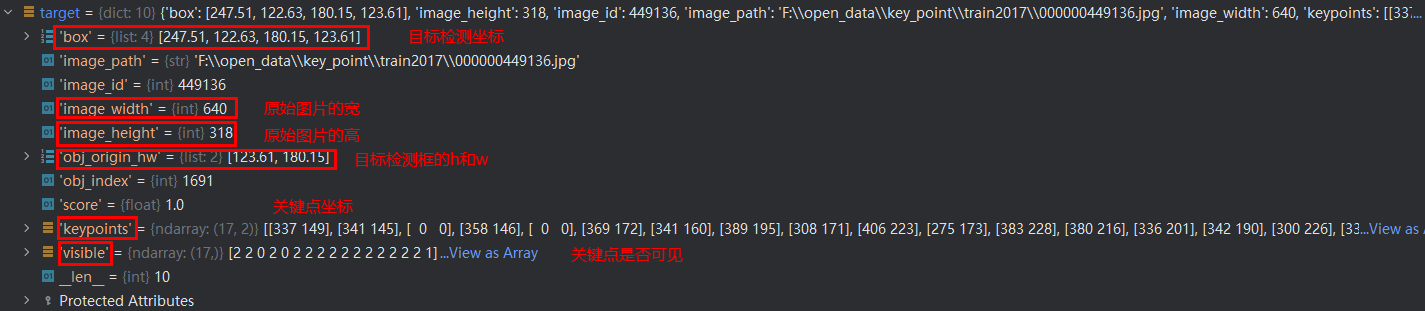
输出:image(同输入一致)、target(缩放之后的target,box 参数为缩放之后的 xmin,ymin,w,h)
以上代码画图解释如下:
2.1.2. AffineTransform
仿射变换
class AffineTransform(object):
    """scale+rotation"""
    def __init__(self,
                 scale: Tuple[float, float] = None,  # e.g. (0.65, 1.35)
                 rotation: Tuple[int, int] = None,   # e.g. (-45, 45)
                 fixed_size: Tuple[int, int] = (256, 192)):
        self.scale = scale				# (0.65, 1.35)
        self.rotation = rotation		# (-45, 45)
        self.fixed_size = fixed_size	# (256, 192)

    def __call__(self, img, target):
        # 调整关键点区域大小
        src_xmin, src_ymin, src_xmax, src_ymax = adjust_box(*target["box"], fixed_size=self.fixed_size)
        src_w = src_xmax - src_xmin		# 131.0775		fixed_size的w为192
        src_h = src_ymax - src_ymin		# 174.7700		fixed_size的h为256
        src_center = np.array([(src_xmin + src_xmax) / 2, (src_ymin + src_ymax) / 2])
        src_p2 = src_center + np.array([0, -src_h / 2])  # top middle
        src_p3 = src_center + np.array([src_w / 2, 0])   # right middle
        # (95.5, 127.5)
        dst_center = np.array([(self.fixed_size[1] - 1) / 2, (self.fixed_size[0] - 1) / 2])
        # (95.5, 0)
        dst_p2 = np.array([(self.fixed_size[1] - 1) / 2, 0])  # top middle
        # (191, 127.5)
        dst_p3 = np.array([self.fixed_size[1] - 1, (self.fixed_size[0] - 1) / 2])  # right middle

        if self.scale is not None:
            # 在(0.65,1.35)之间随机缩放
            scale = random.uniform(*self.scale)
            src_w = src_w * scale
            src_h = src_h * scale
            src_p2 = src_center + np.array([0, -src_h / 2])  # top middle
            src_p3 = src_center + np.array([src_w / 2, 0])   # right middle

        if self.rotation is not None:
            # 在(-45,45)之间随机旋转一个角度
            angle = random.randint(*self.rotation)  # 角度制
            angle = angle / 180 * math.pi  # 弧度制
            # 以中心点旋转,得到旋转之后top middle的坐标
            src_p2 = src_center + np.array([src_h / 2 * math.sin(angle), -src_h / 2 * math.cos(angle)])
            # 以中心点旋转,得到旋转之后right middle的坐标
            src_p3 = src_center + np.array([src_w / 2 * math.cos(angle), src_w / 2 * math.sin(angle)])

        src = np.stack([src_center, src_p2, src_p3]).astype(np.float32)	# (3, 2)
        dst = np.stack([dst_center, dst_p2, dst_p3]).astype(np.float32)	# (3, 2)

        trans = cv2.getAffineTransform(src, dst)  # 计算正向仿射变换矩阵
        dst /= 4  # 网络预测的heatmap尺寸是输入图像的1/4
        reverse_trans = cv2.getAffineTransform(dst, src)  # 计算逆向仿射变换矩阵,方便后续还原

        # 对图像进行仿射变换
        resize_img = cv2.warpAffine(img,
                                    trans,
                                    tuple(self.fixed_size[::-1]),  # [w, h]
                                    flags=cv2.INTER_LINEAR)

        if "keypoints" in target:
            kps = target["keypoints"]
            mask = np.logical_and(kps[:, 0] != 0, kps[:, 1] != 0)
            kps[mask] = affine_points(kps[mask], trans)
            target["keypoints"] = kps

        # import matplotlib.pyplot as plt
        # from draw_utils import draw_keypoints
        # resize_img = draw_keypoints(resize_img, target["keypoints"])
        # plt.imshow(resize_img)
        # plt.show()

        target["trans"] = trans
        target["reverse_trans"] = reverse_trans
        return resize_img, target
其中,
src_xmin, src_ymin, src_xmax, src_ymax = adjust_box(*target["box"], fixed_size=self.fixed_size),其作用是将 box(目标检测的检测框) 的 h 和 w 的比例调整为fixed_size 的 h 和 w 的比例,以 fixed_size=(4, 2),调整前的 box 的 h=5, w=3,调整后的 h=6, w=3, h / w = 2 为例。 用可视化的方式解释如下:
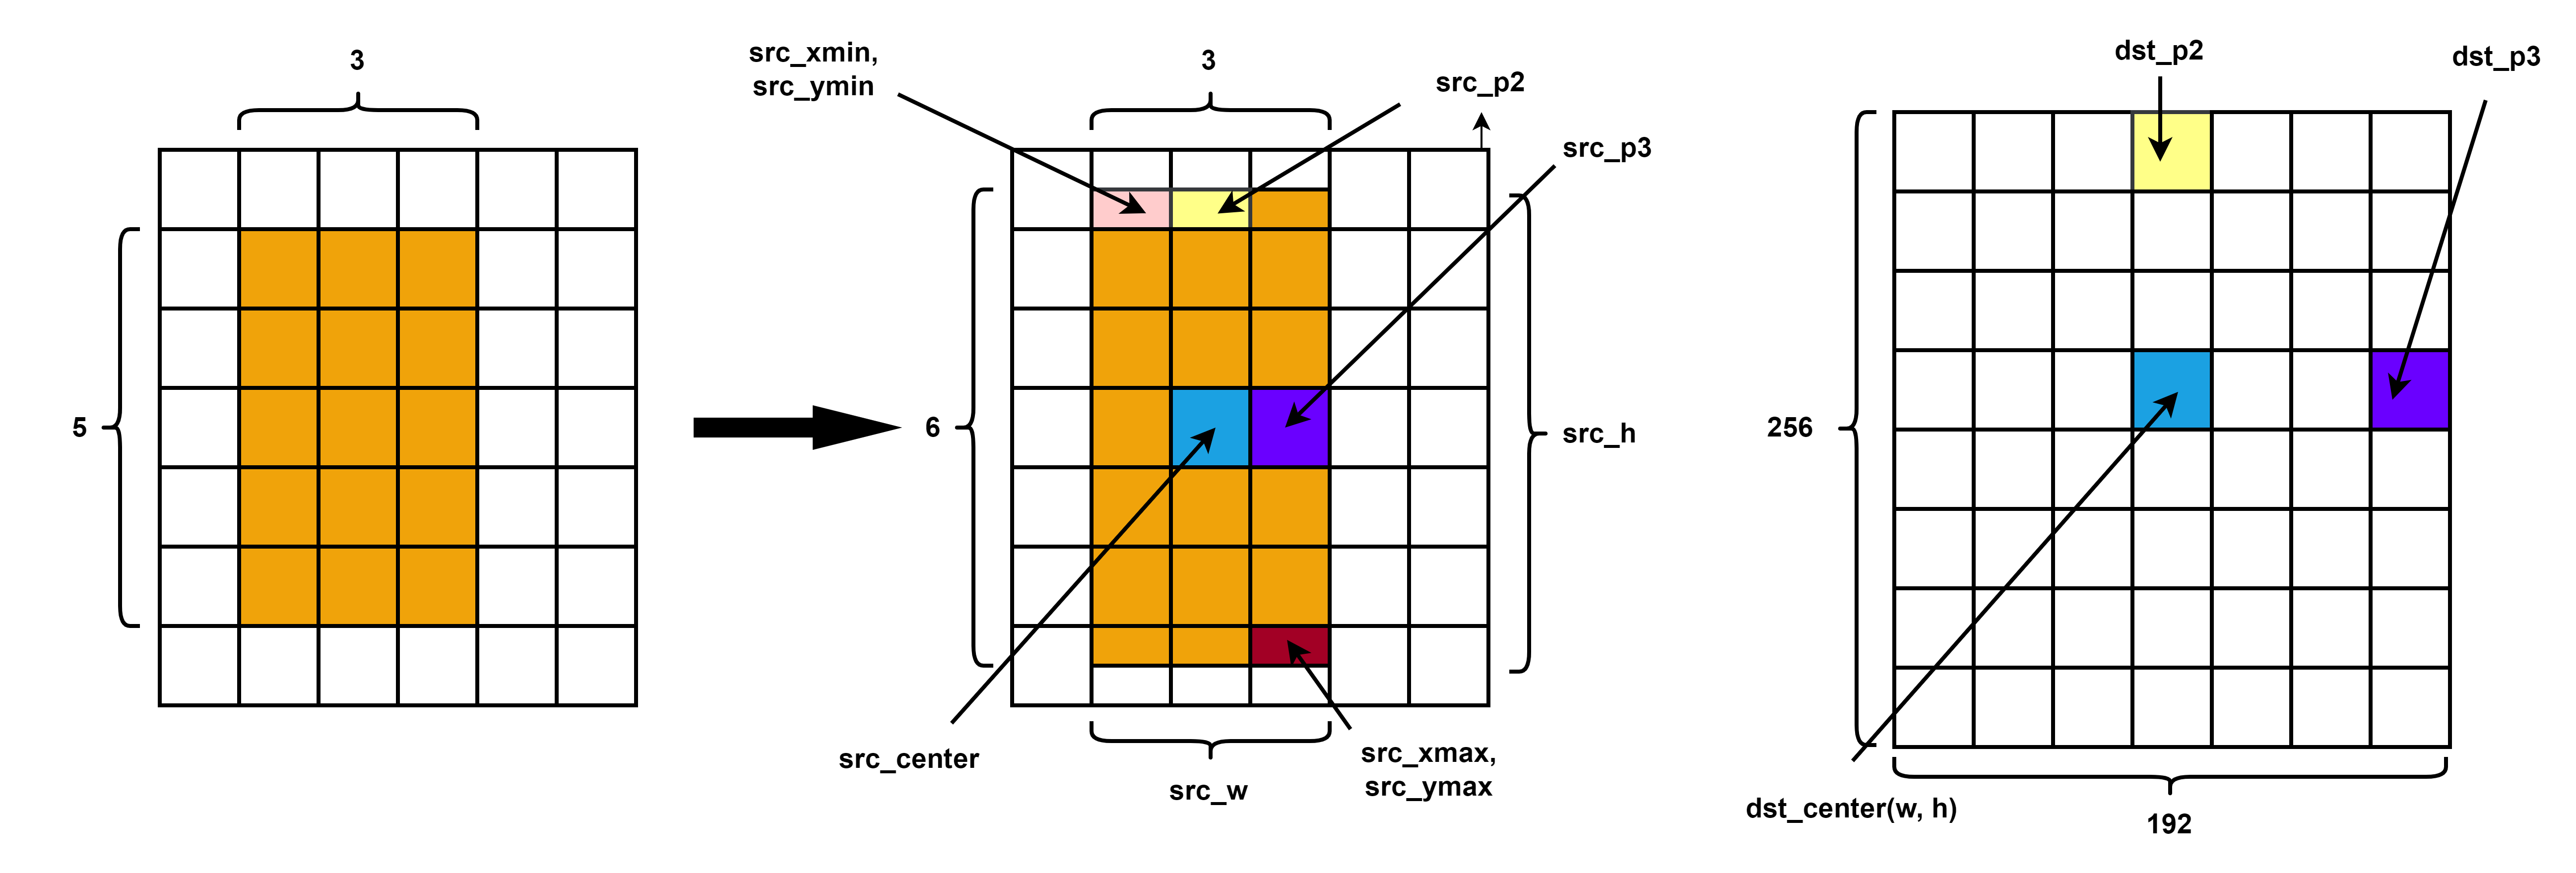
scale 和 rotation 的结果可视化如下:
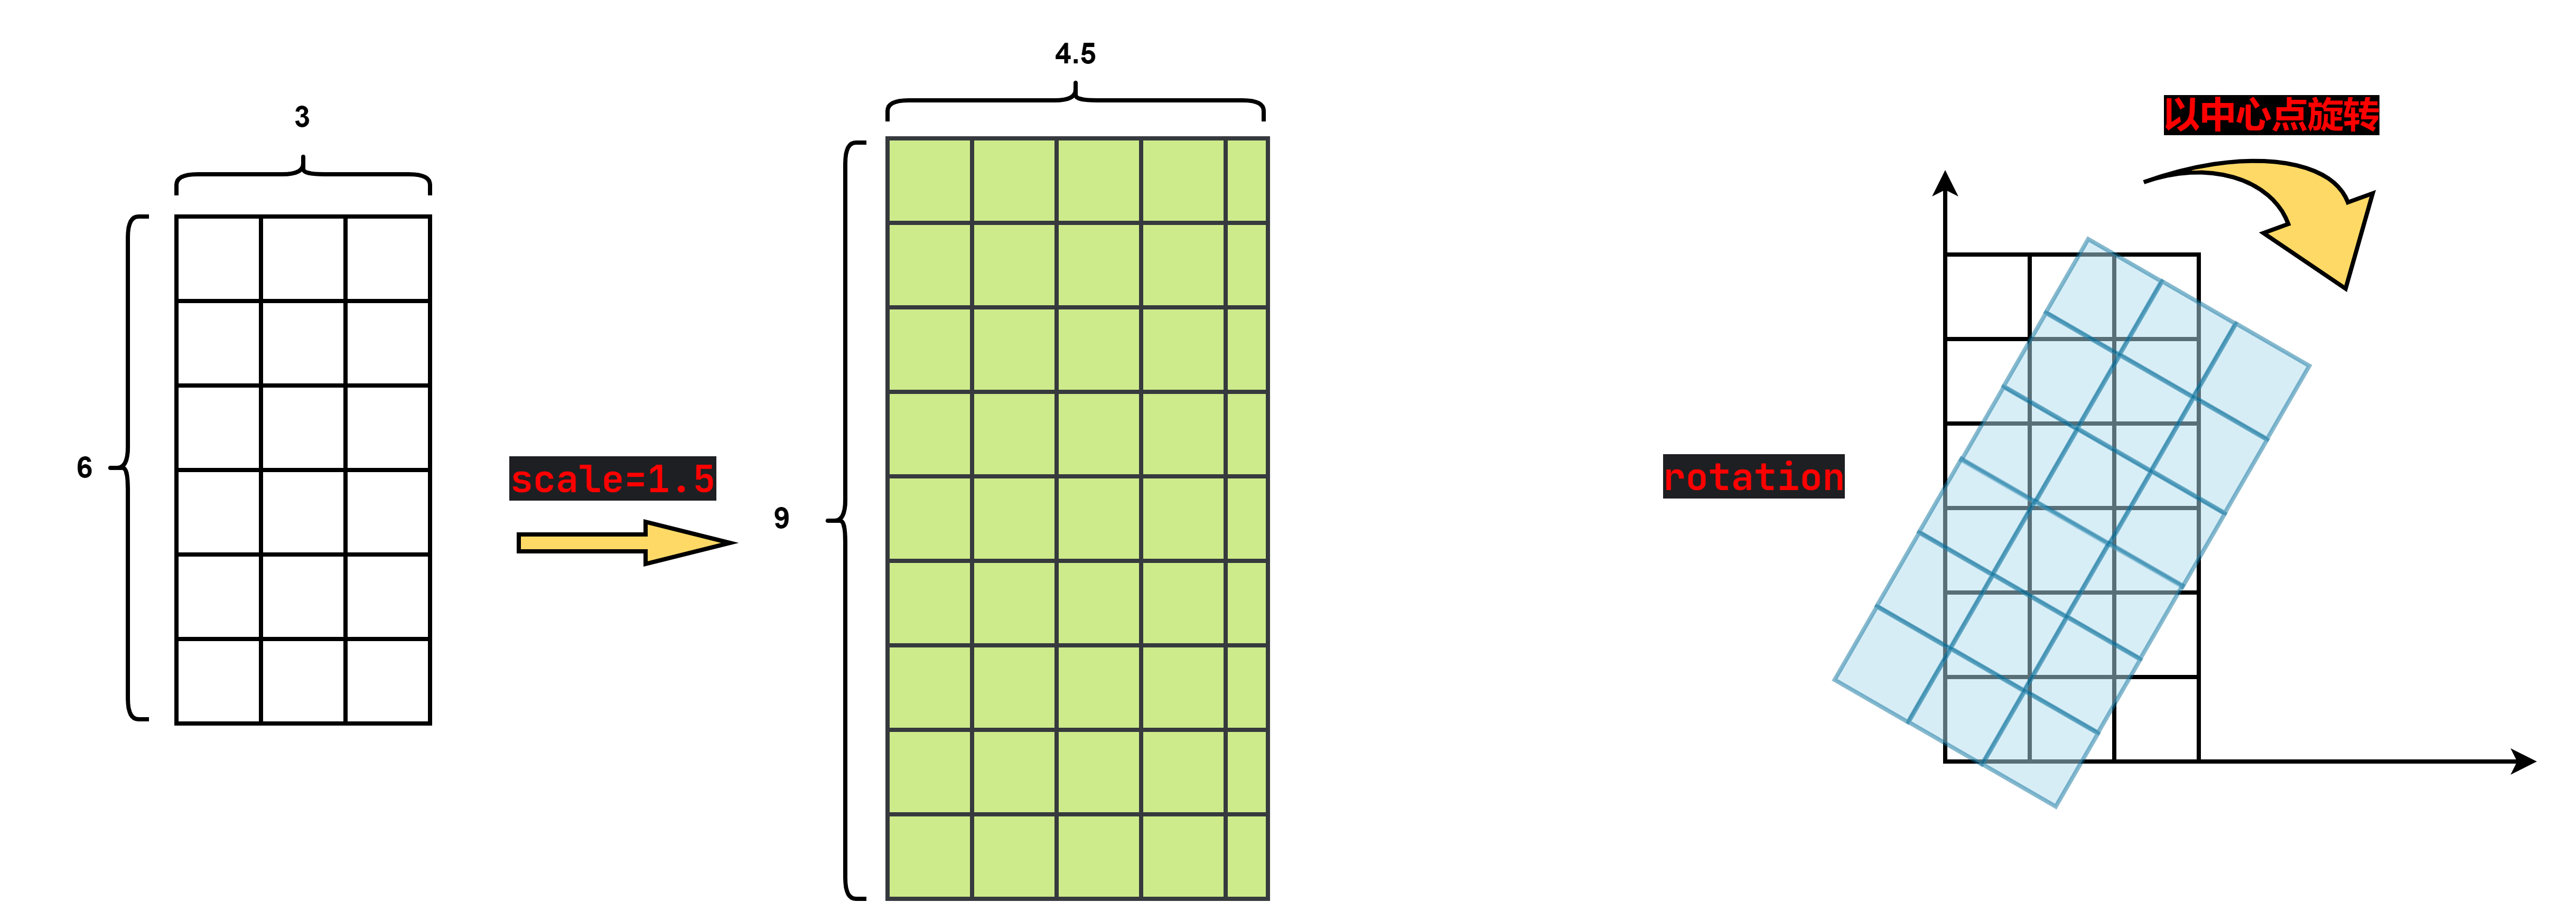
在经过scale 和 rotation 之后,将其仿射变换成(256,192)大小。
2.1.3. KeypointToHeatMap(重点)
将关键点转换成 heatmap
class KeypointToHeatMap(object):
    def __init__(self,
                 heatmap_hw: Tuple[int, int] = (256 // 4, 192 // 4),
                 gaussian_sigma: int = 2,
                 keypoints_weights=None):
        self.heatmap_hw = heatmap_hw
        self.sigma = gaussian_sigma	# 3
        self.kernel_radius = self.sigma * 3	# 6
        self.use_kps_weights = False if keypoints_weights is None else True
        self.kps_weights = keypoints_weights

        # generate gaussian kernel(not normalized)
        kernel_size = 2 * self.kernel_radius + 1	# 13
        kernel = np.zeros((kernel_size, kernel_size), dtype=np.float32)
        x_center = y_center = kernel_size // 2
        for x in range(kernel_size):
            for y in range(kernel_size):
                kernel[y, x] = np.exp(-((x - x_center) ** 2 + (y - y_center) ** 2) / (2 * self.sigma ** 2))
        # print(kernel)

        self.kernel = kernel

    def __call__(self, image, target):
        kps = target["keypoints"]
        num_kps = kps.shape[0]
        kps_weights = np.ones((num_kps,), dtype=np.float32)
        if "visible" in target:
            visible = target["visible"]
            kps_weights = visible

        heatmap = np.zeros((num_kps, self.heatmap_hw[0], self.heatmap_hw[1]), dtype=np.float32)
        heatmap_kps = (kps / 4 + 0.5).astype(np.int)  # round
        for kp_id in range(num_kps):
            v = kps_weights[kp_id]
            if v < 0.5:
                # 如果该点的可见度很低,则直接忽略
                continue

            x, y = heatmap_kps[kp_id]
            ul = [x - self.kernel_radius, y - self.kernel_radius]  # up-left x,y
            br = [x + self.kernel_radius, y + self.kernel_radius]  # bottom-right x,y
            # 如果以xy为中心kernel_radius为半径的辐射范围内与heatmap没交集,则忽略该点(该规则并不严格)
            if ul[0] > self.heatmap_hw[1] - 1 or \
                    ul[1] > self.heatmap_hw[0] - 1 or \
                    br[0] < 0 or \
                    br[1] < 0:
                # If not, just return the image as is
                kps_weights[kp_id] = 0
                continue

            # Usable gaussian range
            # 计算高斯核有效区域(高斯核坐标系)
            g_x = (max(0, -ul[0]), min(br[0], self.heatmap_hw[1] - 1) - ul[0])
            g_y = (max(0, -ul[1]), min(br[1], self.heatmap_hw[0] - 1) - ul[1])
            # image range
            # 计算heatmap中的有效区域(heatmap坐标系)
            img_x = (max(0, ul[0]), min(br[0], self.heatmap_hw[1] - 1))
            img_y = (max(0, ul[1]), min(br[1], self.heatmap_hw[0] - 1))

            if kps_weights[kp_id] > 0.5:
                # 将高斯核有效区域复制到heatmap对应区域
                heatmap[kp_id][img_y[0]:img_y[1] + 1, img_x[0]:img_x[1] + 1] = \
                    self.kernel[g_y[0]:g_y[1] + 1, g_x[0]:g_x[1] + 1]

        if self.use_kps_weights:
            kps_weights = np.multiply(kps_weights, self.kps_weights)

        # plot_heatmap(image, heatmap, kps, kps_weights)

        target["heatmap"] = torch.as_tensor(heatmap, dtype=torch.float32)
        target["kps_weights"] = torch.as_tensor(kps_weights, dtype=torch.float32)

        return image, target
heatmap(17, 64, 48)
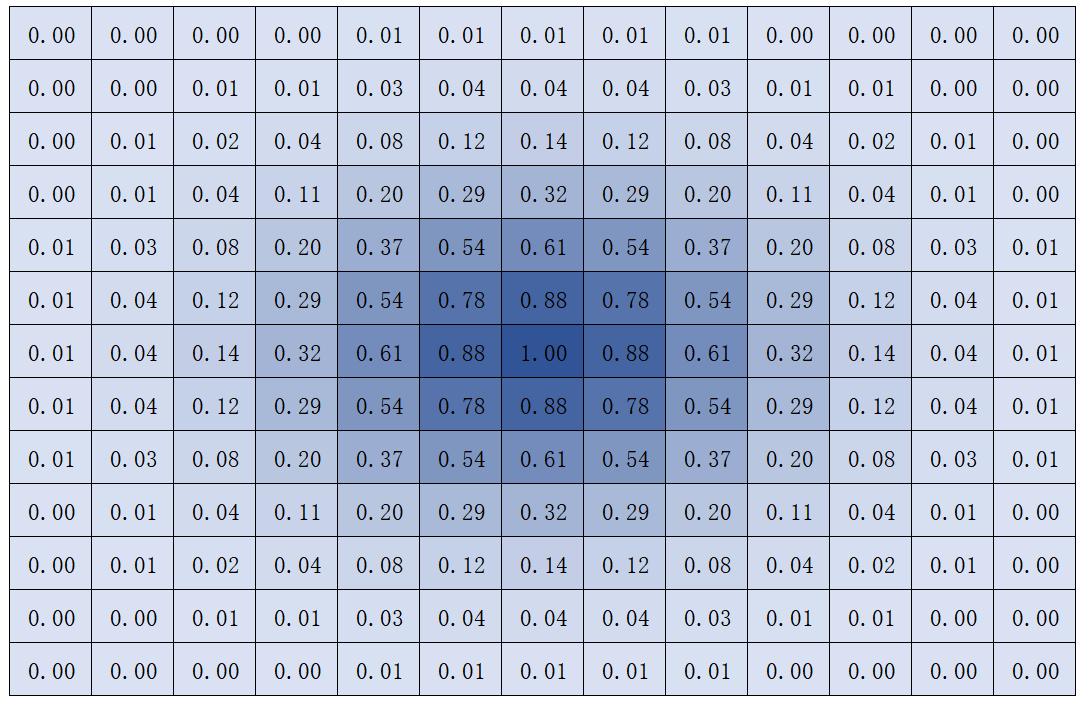
kernel(13*13)
上面代码中,
if ul[0] > self.heatmap_hw[1] - 1 or \
        ul[1] > self.heatmap_hw[0] - 1 or \
        br[0] < 0 or \
        br[1] < 0:
    # If not, just return the image as is
    kps_weights[kp_id] = 0
    continue
ul[0] > self.heatmap_hw[1] - 1的情况
ul[1] > self.heatmap_hw[0] - 1的情况
br[0] < 0 的情况
br[1] < 0 的情况
上面代码中,
g_x = (max(0, -ul[0]), min(br[0], self.heatmap_hw[1] - 1) - ul[0])
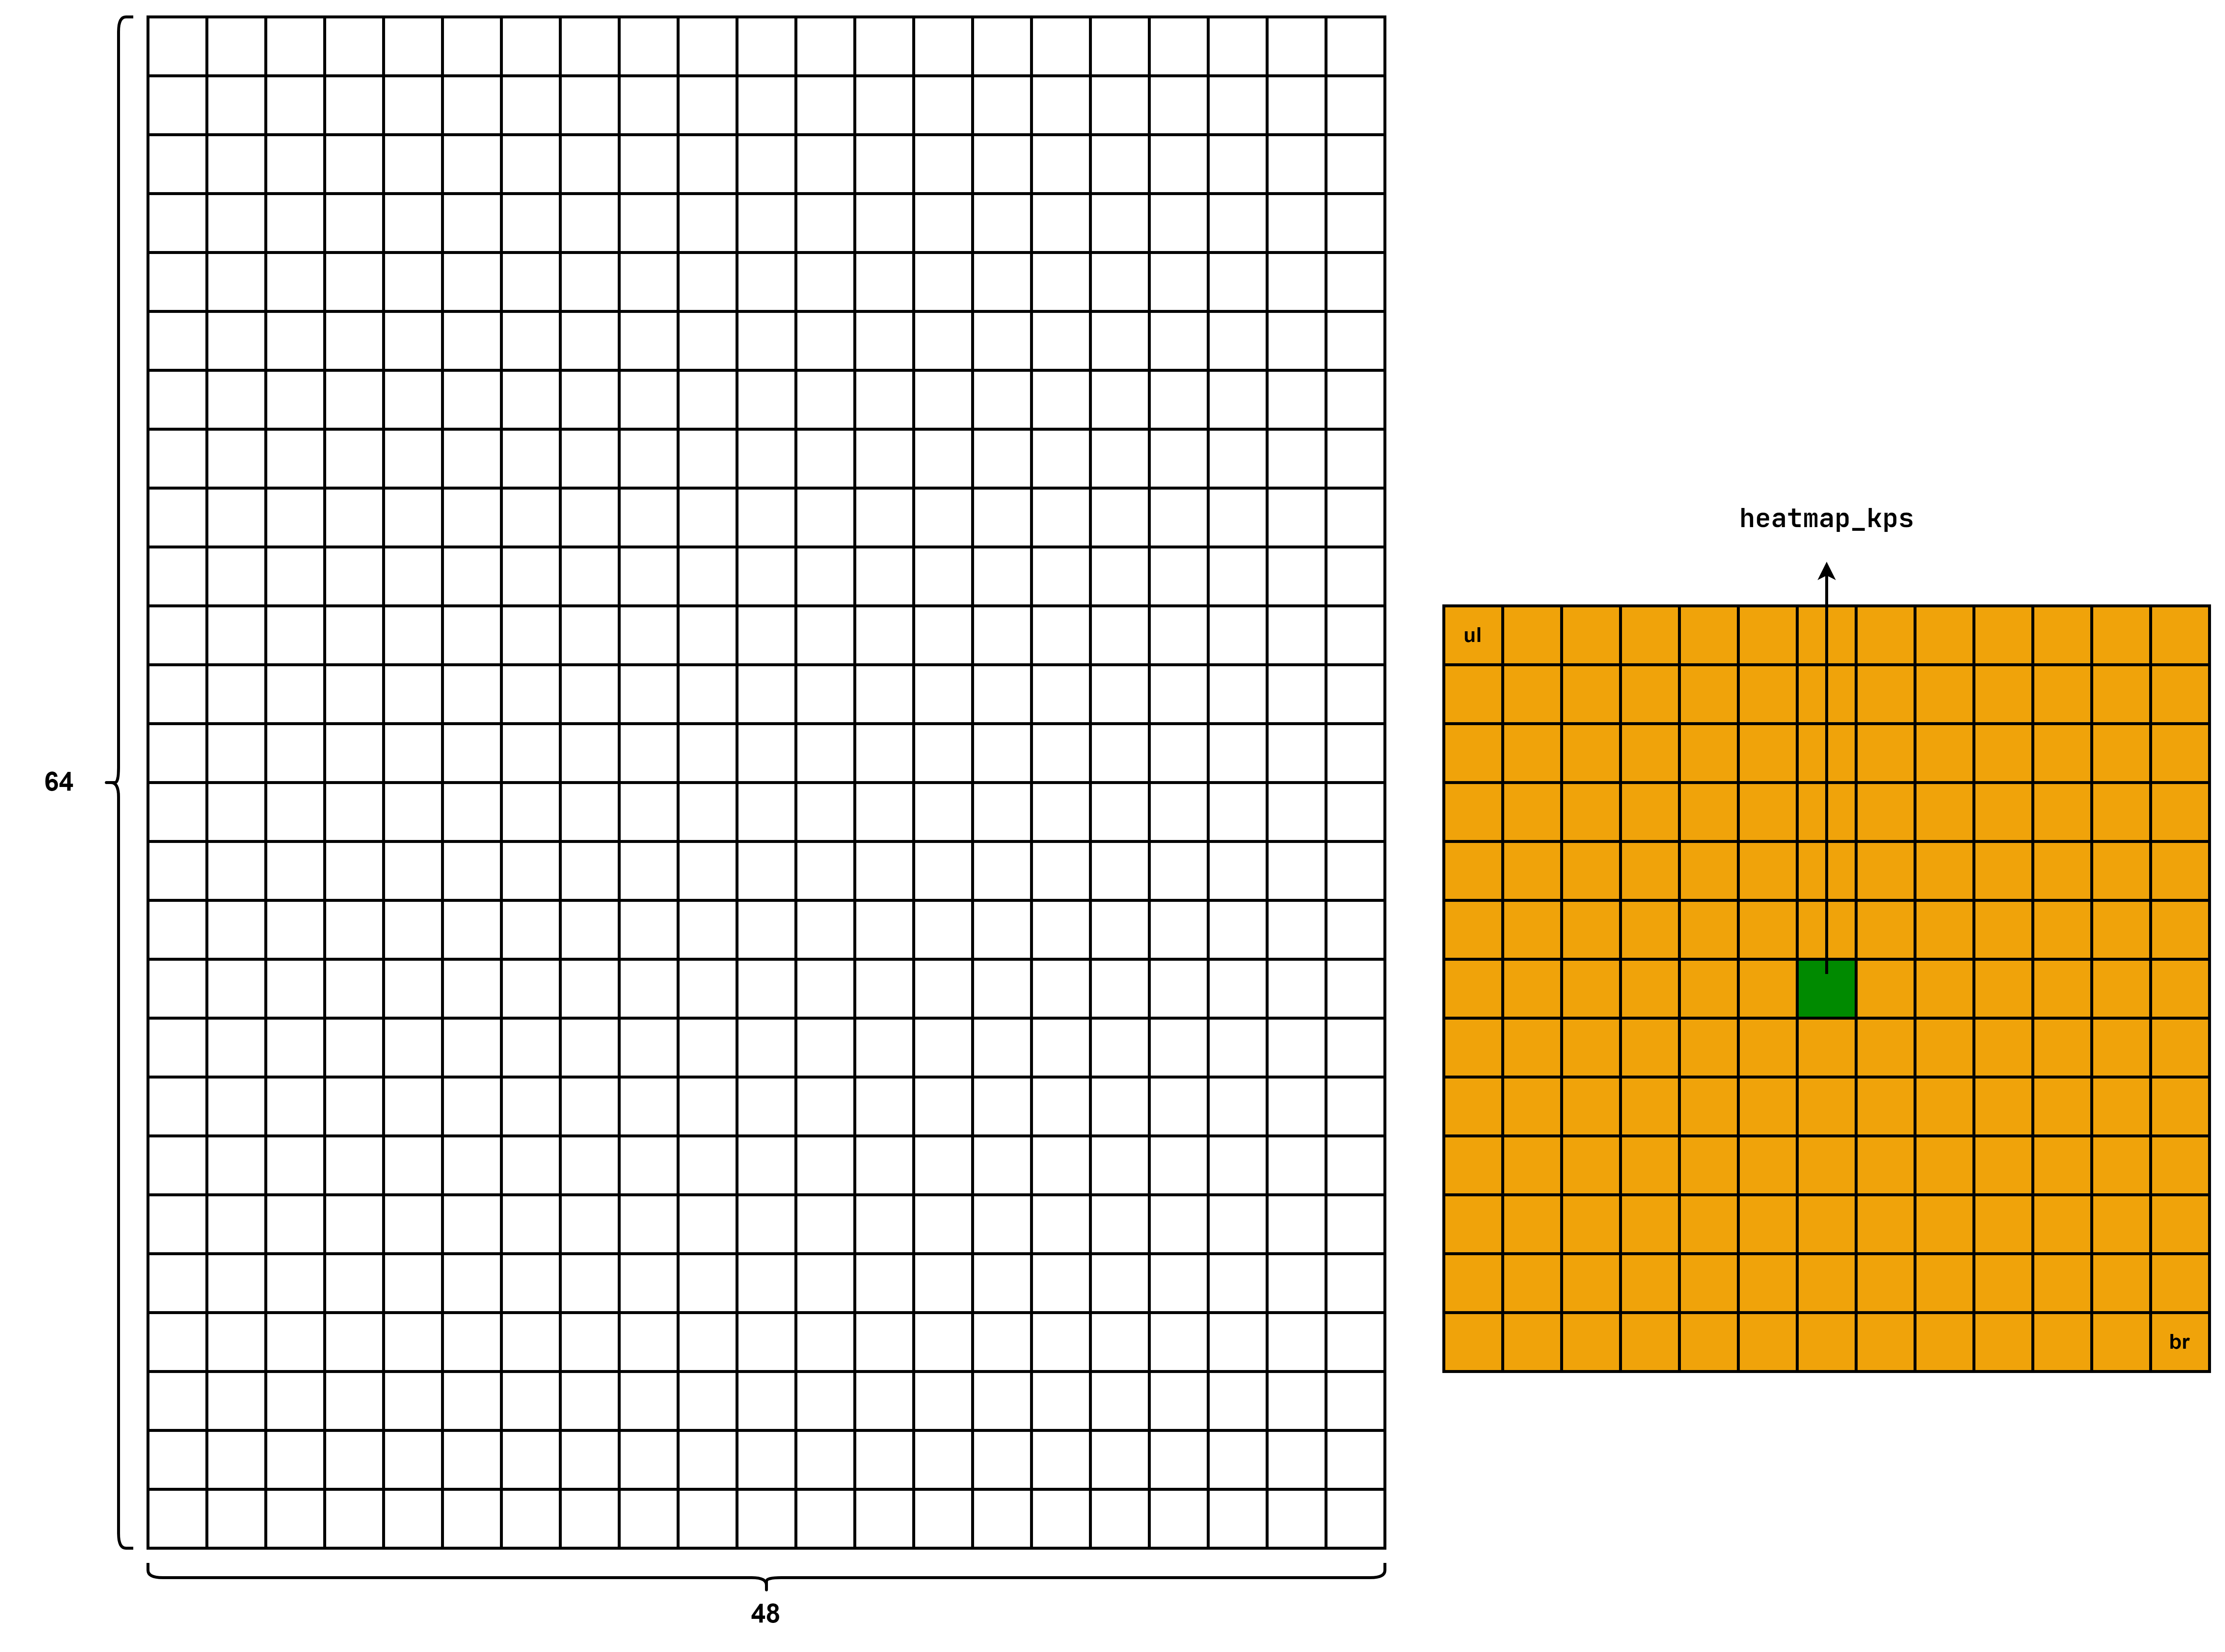
g_y = (max(0, -ul[1]), min(br[1], self.heatmap_hw[0] - 1) - ul[1])g_x 和 g_y 表示的范围如下图所示:
上面代码中,
# 计算heatmap中的有效区域(heatmap坐标系)
img_x = (max(0, ul[0]), min(br[0], self.heatmap_hw[1] - 1))
img_y = (max(0, ul[1]), min(br[1], self.heatmap_hw[0] - 1))
if kps_weights[kp_id] > 0.5:
# 将高斯核有效区域复制到heatmap对应区域
heatmap[kp_id][img_y[0]:img_y[1] + 1, img_x[0]:img_x[1] + 1] = \
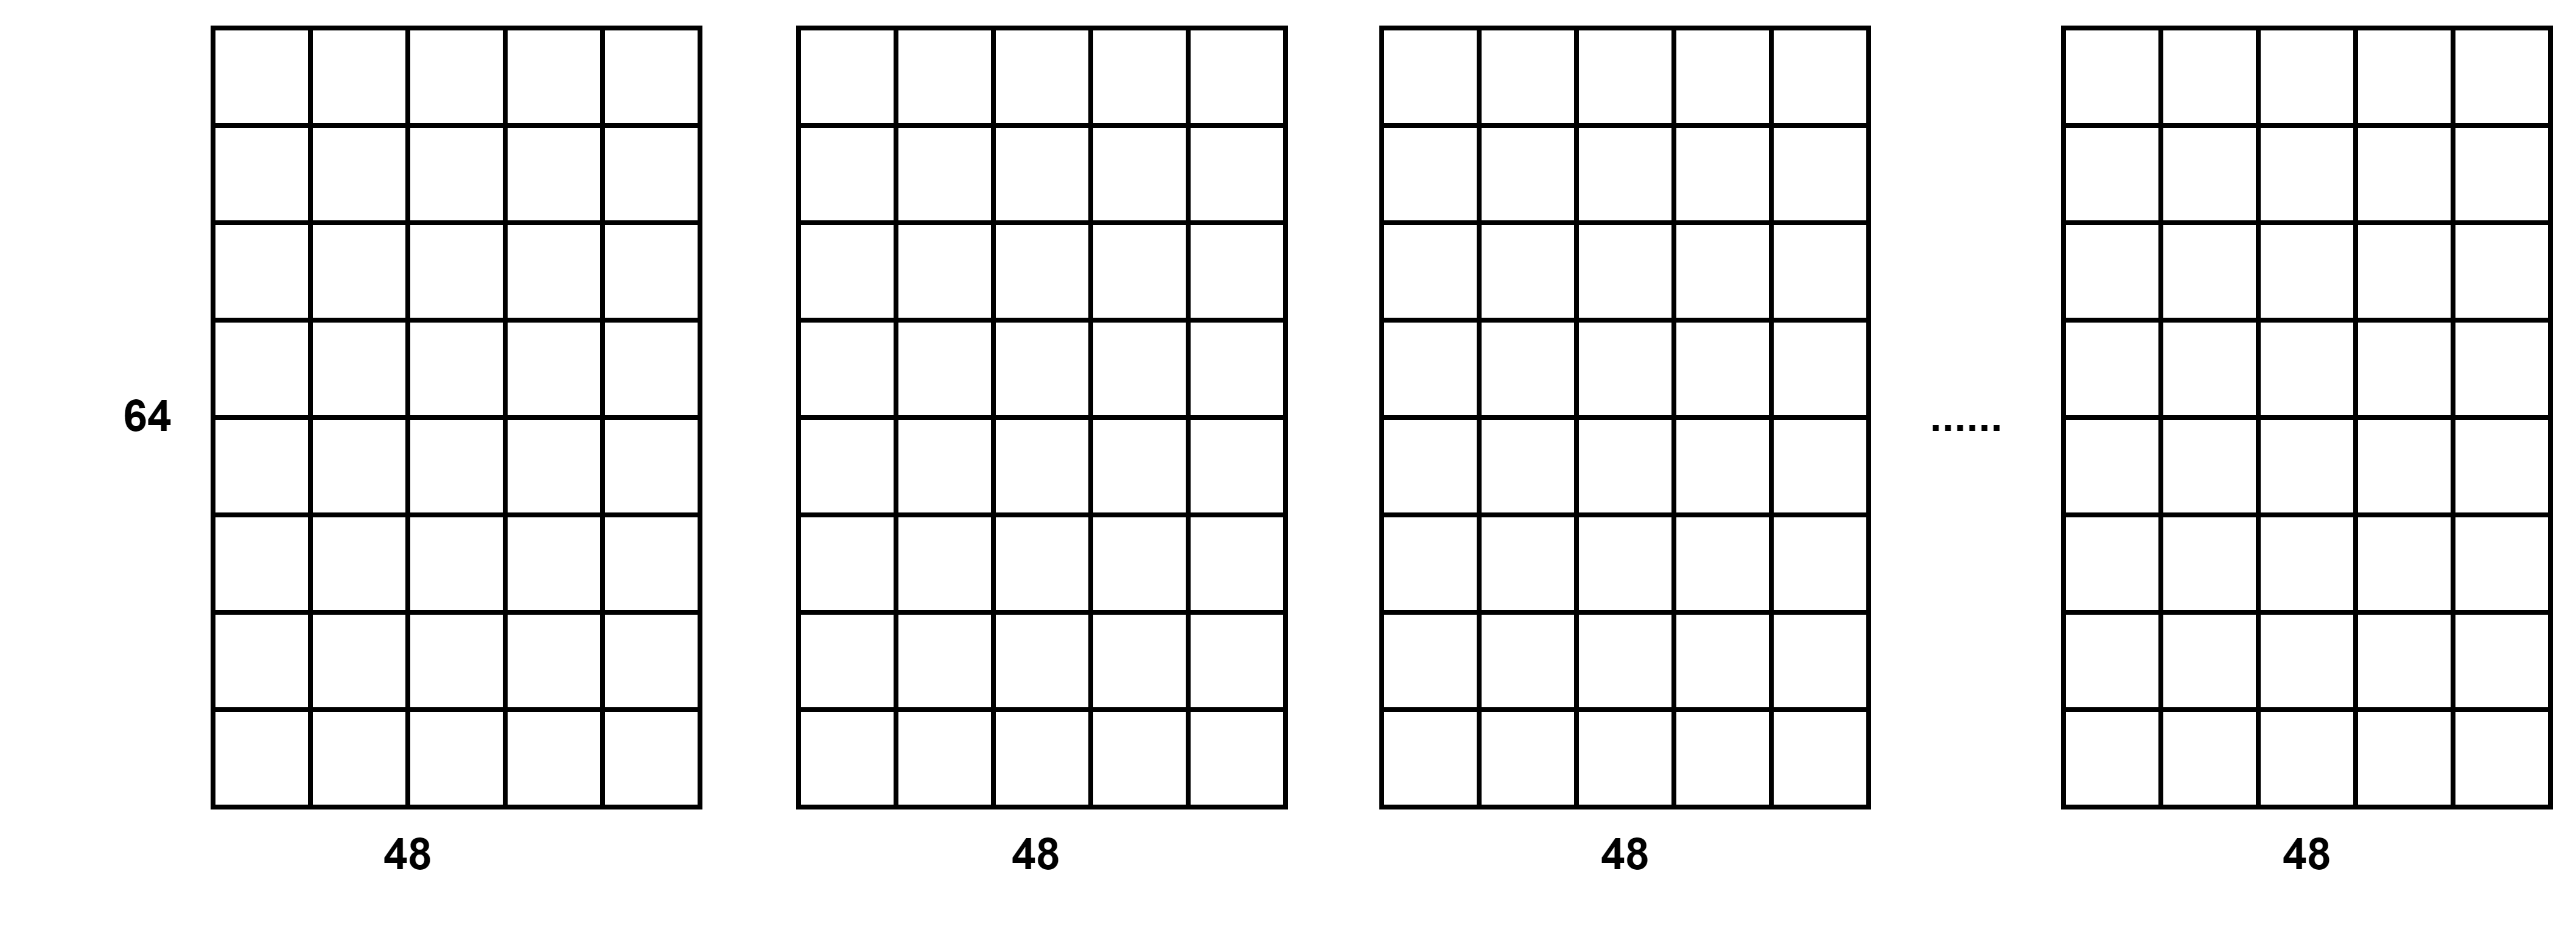
self.kernel[g_y[0]:g_y[1] + 1, g_x[0]:g_x[1] + 1]假设 kernel 和heatmap_kp 分别如下:
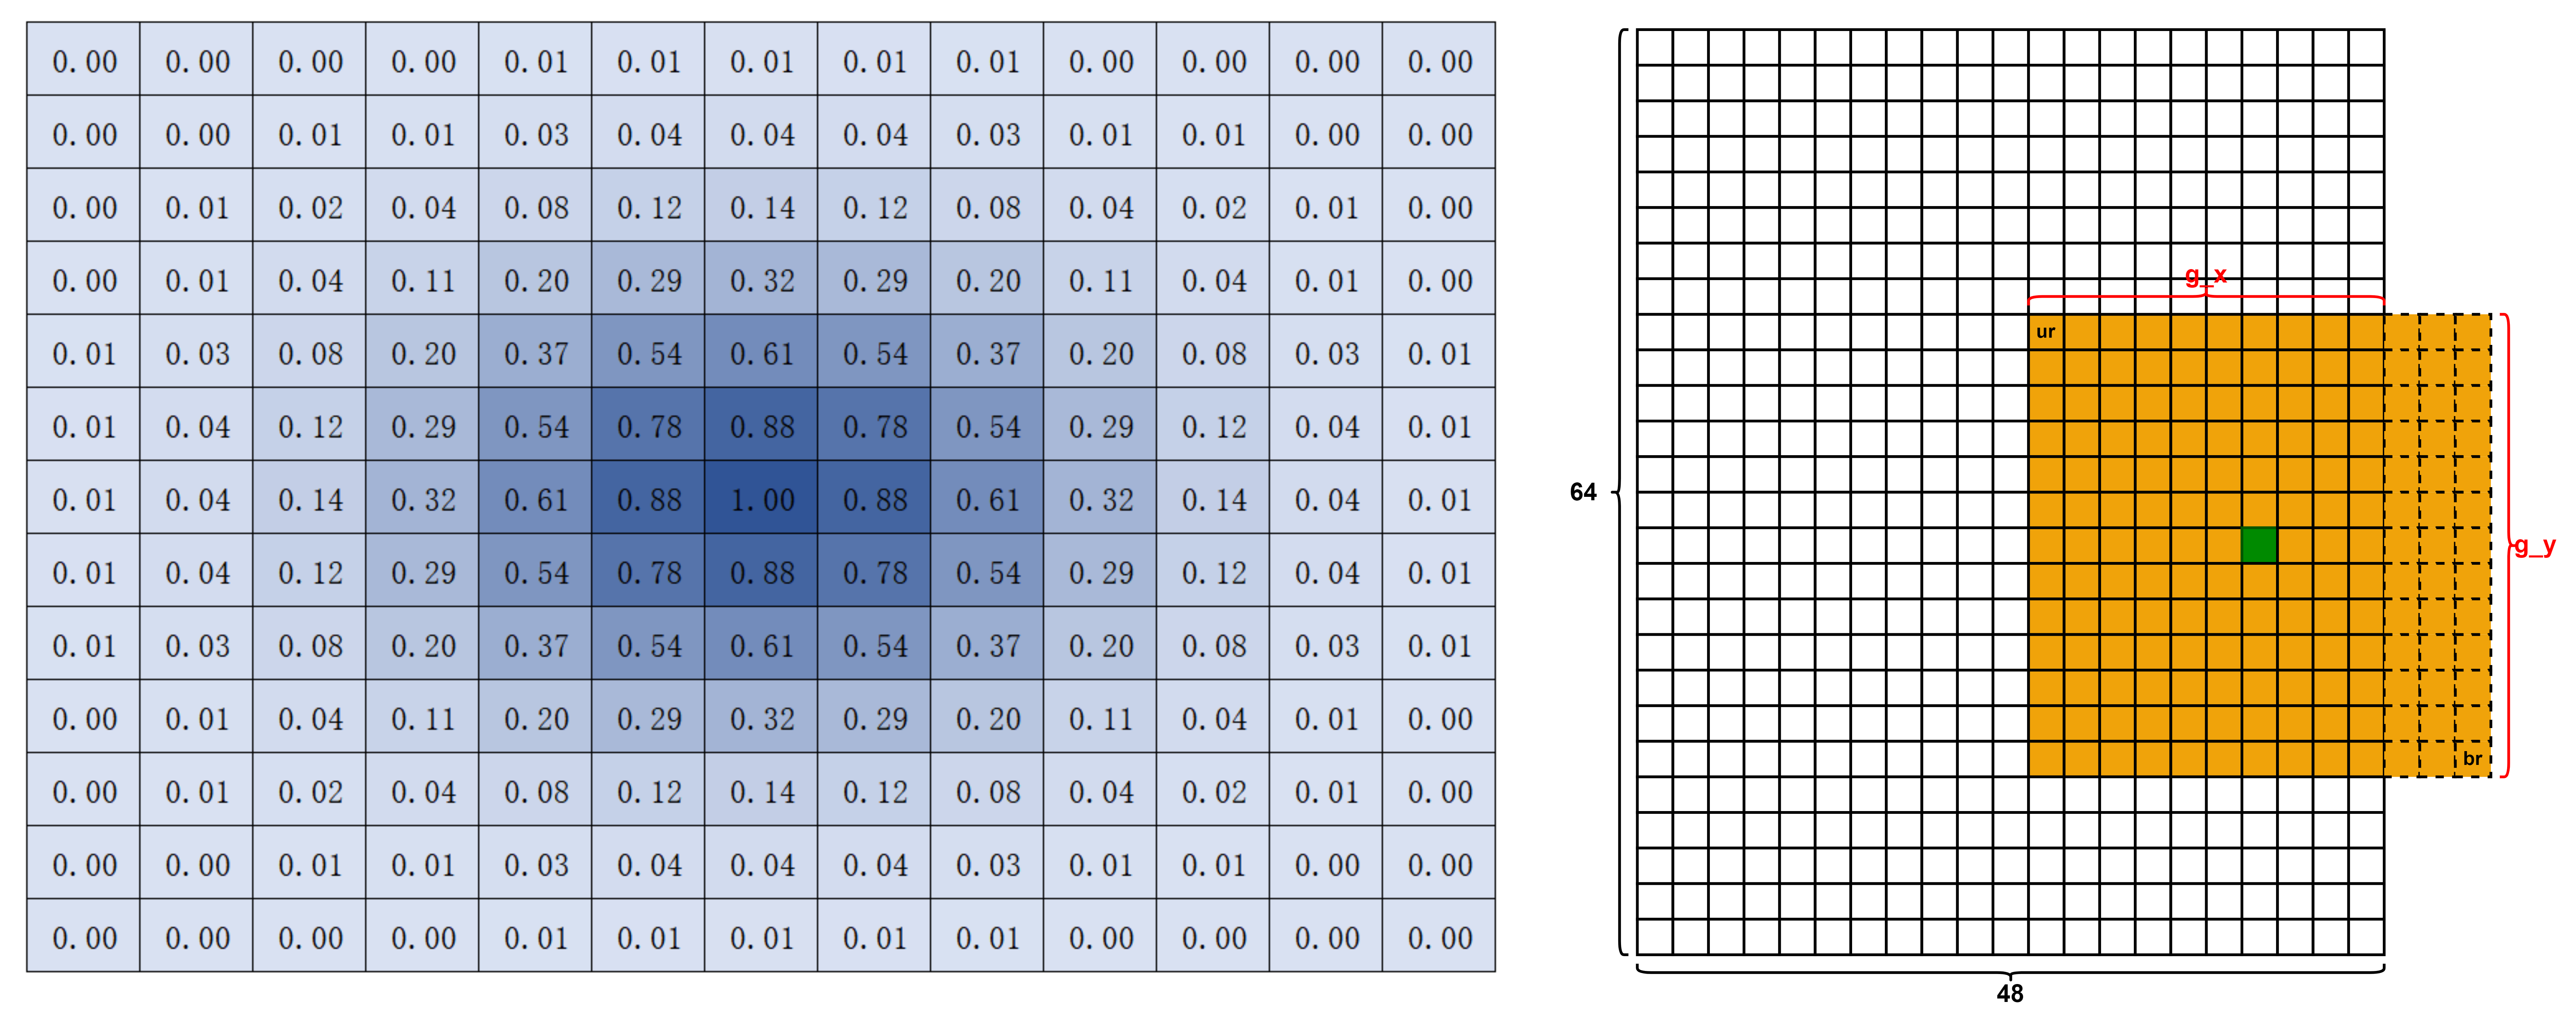
将高斯核有效区域复制到heatmap对应区域的结果,如下图所示(64*48):
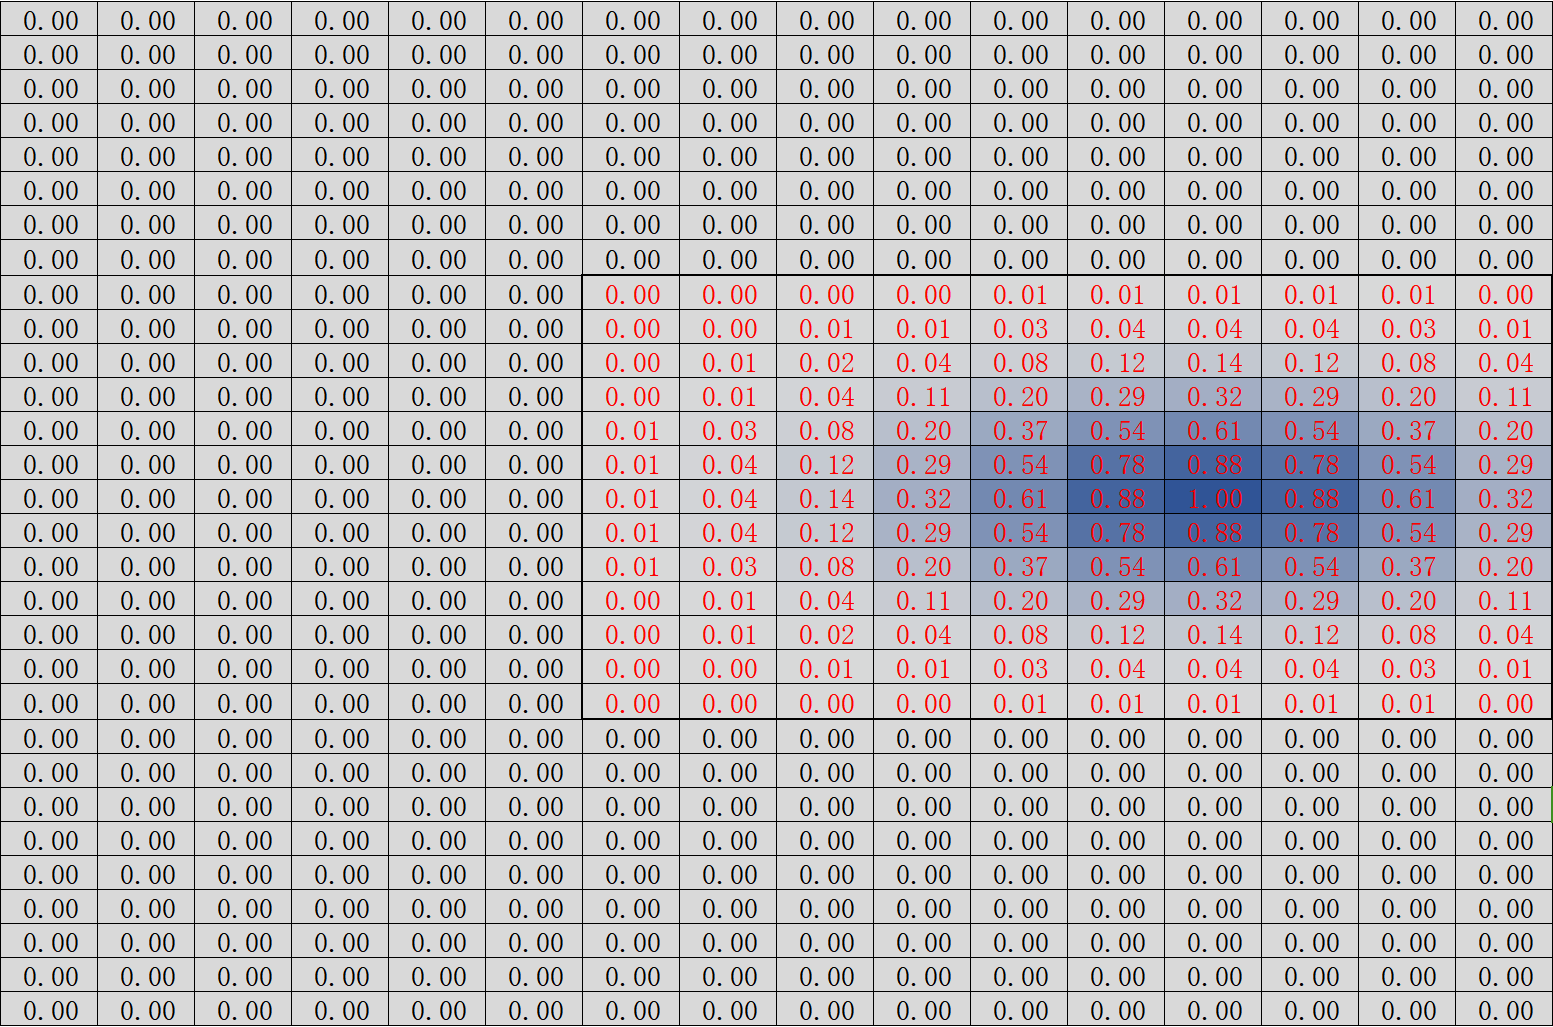
kernel 中超出 heatmap 的部分就被截取了
3. 模型结构
关于模型结构部分的代码,可以参考第一部分的模型结构图(其他大佬画的),我觉得已经画的非常详细了,代码实际上也是这样的。这里就不再展开了。
4. 损失函数
均方误差
# mse损失
losses = mse(results, targets)


heatmaps = torch.stack([t["heatmap"].to(device) for t in targets])
# [num_kps] -> [B, num_kps]
kps_weights = torch.stack([t["kps_weights"].to(device) for t in targets])

# [B, num_kps, H, W] -> [B, num_kps]
loss = self.criterion(logits, heatmaps).mean(dim=[2, 3])	# self.criterion = torch.nn.MSELoss(reduction='none')
loss = torch.sum(loss * kps_weights) / bs
return loss
results:(2, 17, 64, 48)。2 表示 batch_size,17 表示有 17 个关键点。即每个关键点都要预测一个 heatmap(64, 48)
targets:
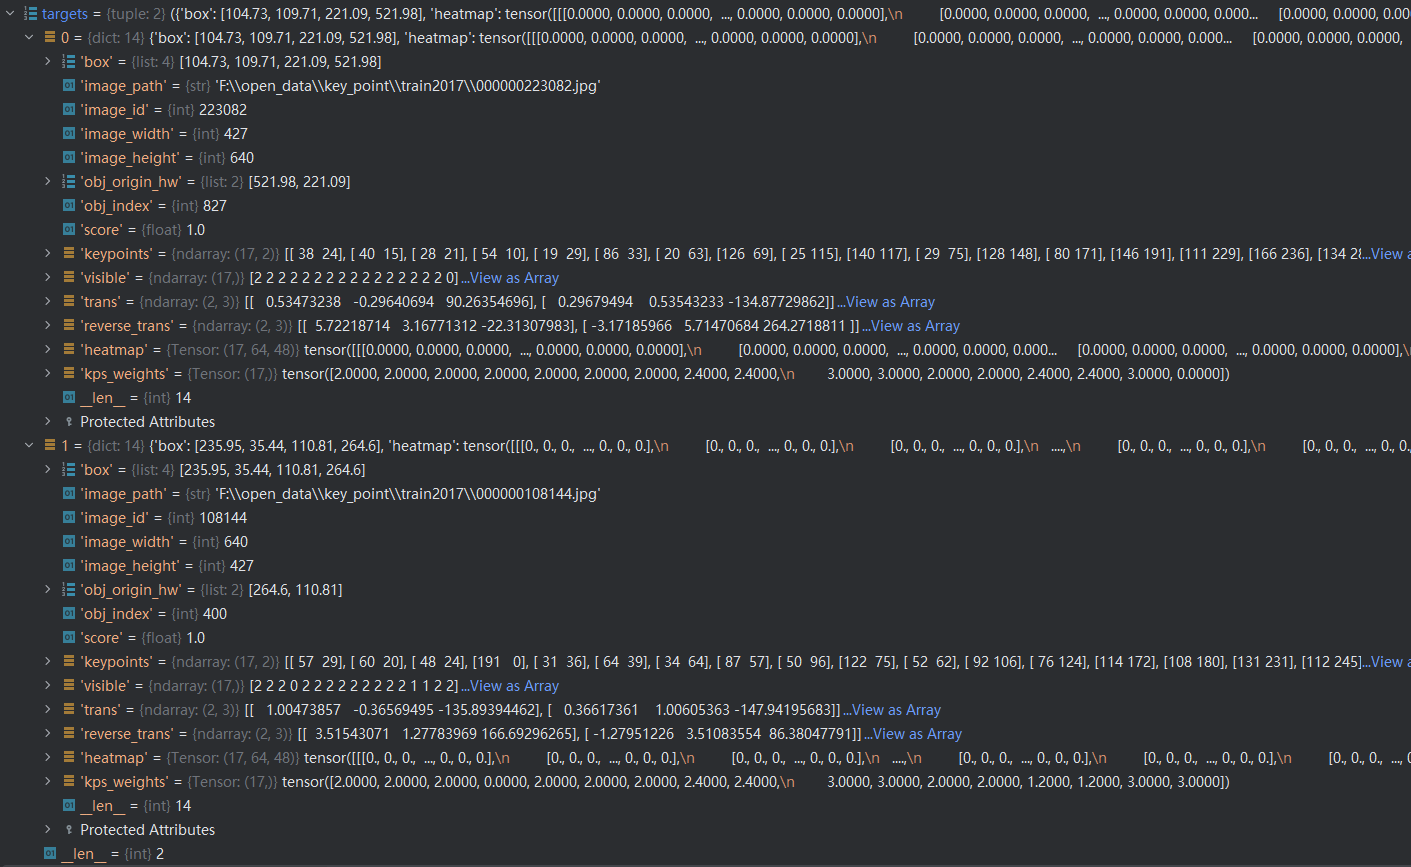
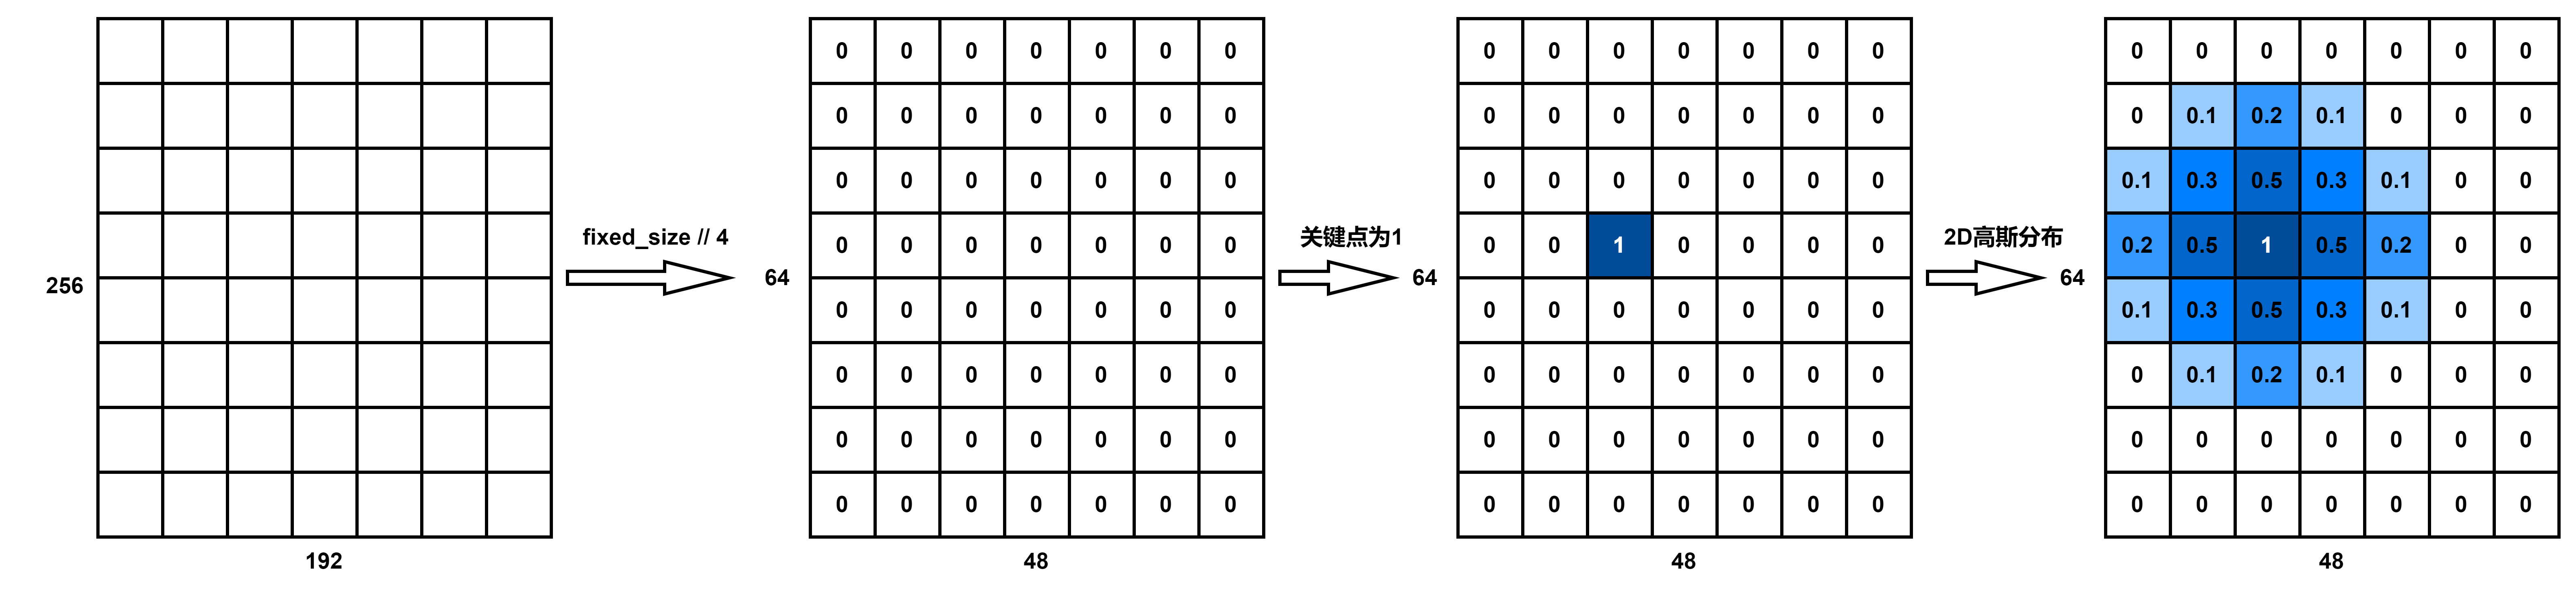
其中,heatmap 的 GT 是如何生成的呢?先将图片 resize 成固定大小(256, 192),然后将坐标都 // 4。针对每个关键点,我们先生成一张值全为0的heatmap,然后将对应关键点坐标处填充1就得到下面左侧的图片。如果直接拿左侧的heatmap作为GT去训练网络的话,你会发现网络很难收敛(可以理解为针对每个关键点只有一个点为正样本,其他64x48-1个点都是负样本,正负样本极度不均),为了解决这个问题一般会以关键点坐标为中心应用一个2D的高斯分布(没有做标准化处理)得到如右图所示的GT(随手画的不必深究)。利用这个GT heatmap配合网络预测的heatmap就能计算MSE损失了。如下图所示:


 7193
7193

 被折叠的 条评论
为什么被折叠?
被折叠的 条评论
为什么被折叠?
 到【灌水乐园】发言


