


一、使用步骤
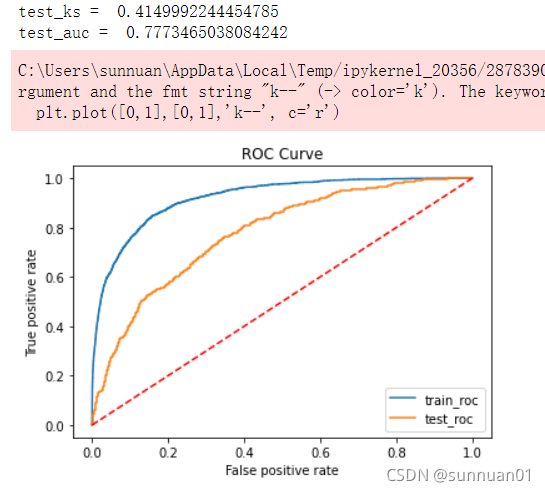
0.首先展示最后的结果
# 参数含义
# learning_rate 一般设置在0.05-0.1之间
# n_estimators  100-1000  boosting的迭代次数
# min_split_gain  0  执行节点分裂的最小增益  不建议去调整
# min_child_sample  一个叶子上的最小数据量,默认设置为20。根据数据量来确定,当数据量比较大时,应提升这个数值,
# 让叶子节点的数据分布相对稳定。
# min_child_weight  一个叶子上的最小hessian和。默认设置为0.001,一般设置为1。

# 需要算法调节的参数
# max_depth   树模型的最大深度。防止过拟合的最重要的参数,一般限制为3~5之间
# num_leaves  一棵树上的叶子节点个数。默认设置为31,和max_depth配合来空值树的形状,一般设置为(0, 2^max_depth - 1]的一个数值。
# subsample   默认设置为1,一般设置为0。8~1.0之间,防止过拟合。
# colsample_bytree  一般设置为0.8~1.0之间,防止过拟合
# reg_alpha   L1正则化参数
# reg_lambda  L2正则化参数 较大的数值会让各个特征对模型的影响力趋于均匀


def roc_auc_plot(clf,x_train,y_train,x_test, y_test):
    train_auc = roc_auc_score(y_train,clf.predict_proba(x_train)[:,1])
    train_fpr, train_tpr, _ = roc_curve(y_train,clf.predict_proba(x_train)[:,1])
    train_ks = abs(train_fpr-train_tpr).max()
    print('train_ks = ', train_ks)
    print('train_auc = ', train_auc)

    test_auc = roc_auc_score(y_test,clf.predict_proba(x_test)[:,1])
    test_fpr, test_tpr, _ = roc_curve(y_test,clf.predict_proba(x_test)[:,1])
    test_ks = abs(test_fpr-test_tpr).max()
    print('test_ks = ', test_ks)
    print('test_auc = ', test_auc)

    from matplotlib import pyplot as plt
    plt.plot(train_fpr,train_tpr,label = 'train_roc')
    plt.plot(test_fpr,test_tpr,label = 'test_roc')
    plt.plot([0,1],[0,1],'k--', c='r')
    plt.xlabel('False positive rate')
    plt.ylabel('True positive rate')
    plt.title('ROC Curve')
    plt.legend(loc = 'best')
    plt.show()

lgb_model = lgb.LGBMClassifier(n_estimators=800,
                                boosting_type='gbdt',
                               learning_rate=0.04,
                               min_child_samples=68,
                               min_child_weight=0.01,
                                  max_depth=4,
                              num_leaves=16,
                              colsample_bytree=0.8,
                              subsample=0.8,
                              reg_alpha=0.7777777777777778,
                              reg_lambda=0.3,
                               objective='binary')

clf = lgb_model.fit(x_train, y_train,
              eval_set=[(x_train, y_train),(x_test,y_test)],
              eval_metric='auc',early_stopping_rounds=100)
roc_auc_plot(clf,x_train,y_train,x_test, y_test)
1.读入清洗后的数据集
代码如下:
import pandas as pd
from sklearn.model_selection import train_test_split, cross_val_score
from sklearn.metrics import roc_auc_score,roc_curve,auc
import lightgbm as lgb
from multiprocessing import cpu_count
from sklearn.model_selection import KFold
import time
from sklearn.model_selection import GridSearchCV, StratifiedKFold, cross_val_score
import numpy as np

df_Master_clean = pd.read_csv(r'F:\教师培训\ppd7\df_Master_clean.csv', encoding='gb18030')
c=['Idx','target','ListingInfo','sample_status']
x = df_Master_clean[df_Master_clean['target'].notnull()].drop(columns=c)
y = df_Master_clean[df_Master_clean['target'].notnull()]['target']
x_train,x_test, y_train, y_test = train_test_split(x,y,random_state=2,test_size=0.2)
2.参数调整
代码如下(示例):
#随机设置一组参数为基础
lgb_model1 = lgb.LGBMClassifier(n_estimators=20,
                                boosting_type='gbdt',
                               learning_rate=0.01,
                               min_child_samples=100,
                               min_child_weight=0.003,
                                  max_depth=4,
                              num_leaves=100,
                              colsample_bytree=0.7,
                              subsample=0.6,
                              reg_alpha=0.03,
                              reg_lambda=0.3,
                               objective='binary',
                               max_features = 140,)
import matplotlib.pyplot as plt
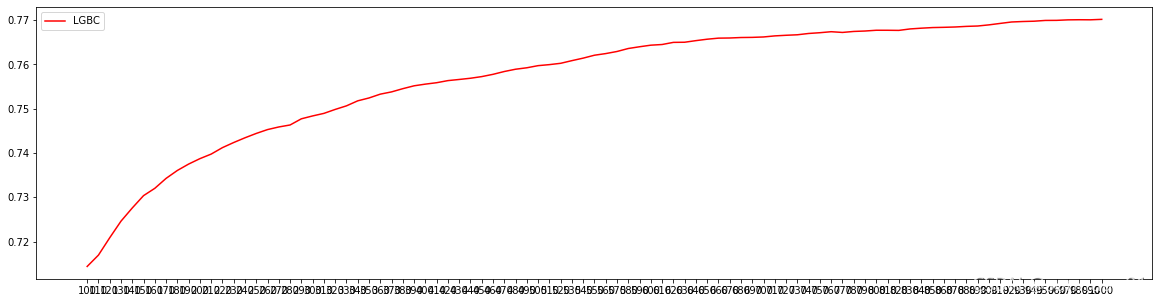
# 通过观察auc大小调参,找到最佳n_estimators
axisx = range(100,1001,10)
test_aucs = []
for i in axisx:
lgb_model = lgb.LGBMClassifier(n_estimators=i,
boosting_type='gbdt',
learning_rate=0.01,
min_child_samples=100,
min_child_weight=0.003,
max_depth=4,
num_leaves=100,
colsample_bytree=0.7,
subsample=0.6,
reg_alpha=0.03,
reg_lambda=0.3,
objective='binary',
max_features = 140,)
clf = lgb_model.fit(x_train, y_train,
eval_set=[(x_train, y_train),(x_test,y_test)],
eval_metric='auc',early_stopping_rounds=100)
test_auc = roc_auc_score(y_test,clf.predict_proba(x_test)[:,1])
test_aucs.append(test_auc)
plt.figure(figsize=(20,5))
plt.plot(axisx, test_aucs,c="red",label="LGBC")
plt.xticks(axisx)
plt.legend()
plt.show()
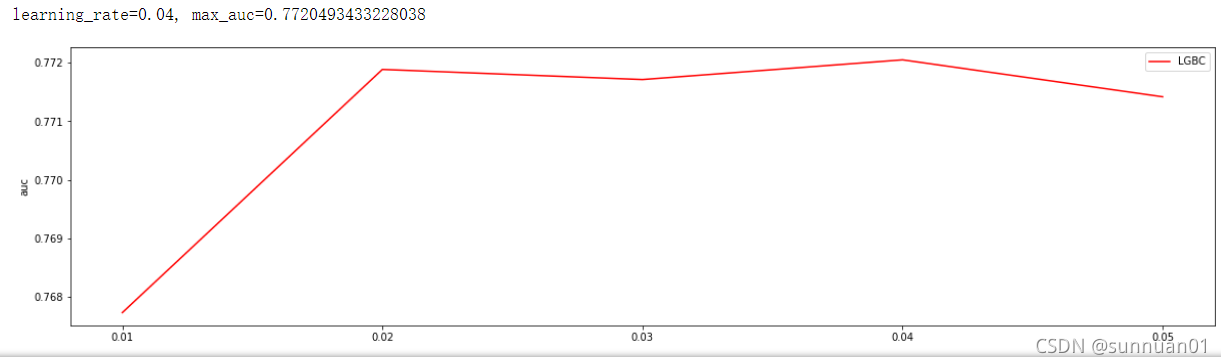
import matplotlib.pyplot as plt

# 通过观察auc大小调参,找到最佳learning_rate,learning_rate=0.04, max_auc=0.7720493433228038
axisx = np.linspace(0.01,0.05,5)

test_aucs = []
for i in axisx:
    lgb_model = lgb.LGBMClassifier(n_estimators=800,
                                boosting_type='gbdt',
                               learning_rate=i,
                               min_child_samples=100,
                               min_child_weight=0.003,
                                  max_depth=4,
                              num_leaves=100,
                              colsample_bytree=0.7,
                              subsample=0.6,
                              reg_alpha=0.03,
                              reg_lambda=0.3,
                               objective='binary',
                               max_features = 140,)
    clf = lgb_model.fit(x_train, y_train,
              eval_set=[(x_train, y_train),(x_test,y_test)],
              eval_metric='auc',early_stopping_rounds=100)
    test_auc = roc_auc_score(y_test,clf.predict_proba(x_test)[:,1])
    test_aucs.append(test_auc)
print('learning_rate={}, max_auc={}'.format(axisx[test_aucs.index(max(test_aucs))], max(test_aucs)))

plt.figure(figsize=(20,5))
plt.plot(axisx, test_aucs,c="red",label="LGBC")
plt.ylabel('auc')
plt.xticks(axisx)
plt.legend()
plt.show()
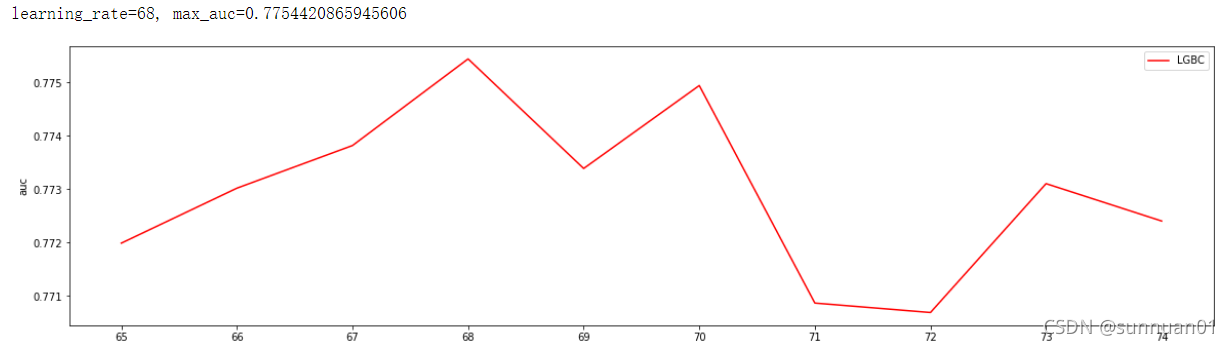
# 通过观察auc大小调参,找到最佳min_child_samples   min_child_samples=68, max_auc=0.7754420865945606
# axisx = np.linspace(0.01,0.05,5)
axisx = range(65,75,1)
test_aucs = []
for i in axisx:
    lgb_model = lgb.LGBMClassifier(n_estimators=800,
                                boosting_type='gbdt',
                               learning_rate=0.04,
                               min_child_samples=i,
                               min_child_weight=0.003,
                                  max_depth=4,
                              num_leaves=100,
                              colsample_bytree=0.7,
                              subsample=0.6,
                              reg_alpha=0.03,
                              reg_lambda=0.3,
                               objective='binary',
                               max_features = 140,)
    clf = lgb_model.fit(x_train, y_train,
              eval_set=[(x_train, y_train),(x_test,y_test)],
              eval_metric='auc',early_stopping_rounds=100)
    test_auc = roc_auc_score(y_test,clf.predict_proba(x_test)[:,1])
    test_aucs.append(test_auc)
print('min_child_samples={}, max_auc={}'.format(axisx[test_aucs.index(max(test_aucs))], max(test_aucs)))
#     test_fpr, test_tpr, _ = roc_curve(y_test,clf.predict_proba(x_test)[:,1])
#     test_ks = abs(test_fpr-test_tpr).max()
#     print('test_ks = ', test_ks)
#     print('test_auc = ', test_auc)


plt.figure(figsize=(20,5))
plt.plot(axisx, test_aucs,c="red",label="LGBC")
plt.ylabel('auc')
plt.xticks(axisx)
plt.legend()
plt.show()
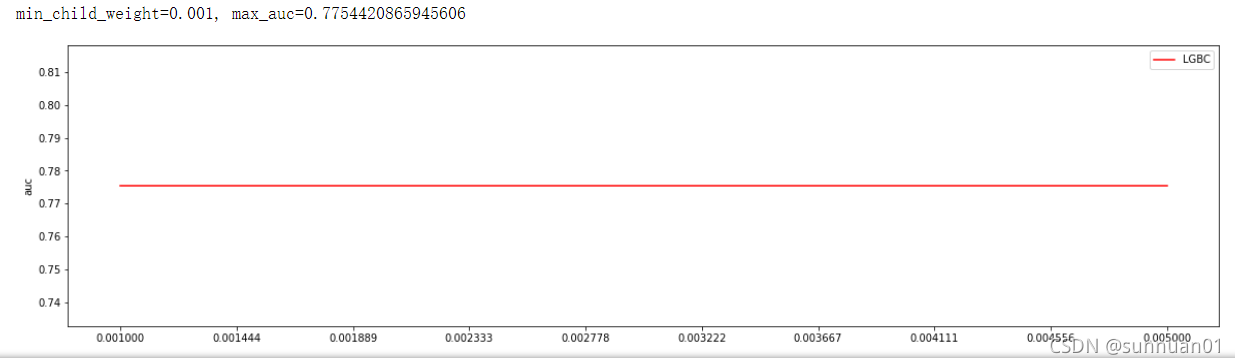
# 通过观察auc大小调参,min_child_weight对auc面积没有影响
axisx = np.linspace(0.001,0.005,10)
# axisx = range(65,75,1)
# axisx = [0.001, 0.005]
test_aucs = []
for i in axisx:
    lgb_model = lgb.LGBMClassifier(n_estimators=800,
                                boosting_type='gbdt',
                               learning_rate=0.04,
                               min_child_samples=68,
                               min_child_weight=i,
                                  max_depth=4,
                              num_leaves=100,
                              colsample_bytree=0.7,
                              subsample=0.6,
                              reg_alpha=0.03,
                              reg_lambda=0.3,
                               objective='binary',
                               max_features = 140,)
    clf = lgb_model.fit(x_train, y_train,
              eval_set=[(x_train, y_train),(x_test,y_test)],
              eval_metric='auc',early_stopping_rounds=100)
    test_auc = roc_auc_score(y_test,clf.predict_proba(x_test)[:,1])
    test_aucs.append(test_auc)
print('min_child_weight={}, max_auc={}'.format(axisx[test_aucs.index(max(test_aucs))], max(test_aucs)))
#     test_fpr, test_tpr, _ = roc_curve(y_test,clf.predict_proba(x_test)[:,1])
#     test_ks = abs(test_fpr-test_tpr).max()
#     print('test_ks = ', test_ks)
#     print('test_auc = ', test_auc)


plt.figure(figsize=(20,5))
plt.plot(axisx, test_aucs,c="red",label="LGBC")
plt.ylabel('auc')
plt.xticks(axisx)
plt.legend()
plt.show()
# 通过观察auc大小调参max_depth,  max_depth=4, max_auc=0.7754420865945606
# axisx = np.linspace(0.001,0.005,10)
# axisx = range(65,75,1)
axisx = [3, 4, 5, 6, 7]
test_aucs = []
for i in axisx:
    lgb_model = lgb.LGBMClassifier(n_estimators=800,
                                boosting_type='gbdt',
                               learning_rate=0.04,
                               min_child_samples=68,
                               min_child_weight=0.01,
                                  max_depth=i,
                              num_leaves=100,
                              colsample_bytree=0.7,
                              subsample=0.6,
                              reg_alpha=0.03,
                              reg_lambda=0.3,
                               objective='binary',
                               max_features = 140,)
    clf = lgb_model.fit(x_train, y_train,
              eval_set=[(x_train, y_train),(x_test,y_test)],
              eval_metric='auc',early_stopping_rounds=100)
    test_auc = roc_auc_score(y_test,clf.predict_proba(x_test)[:,1])
    test_aucs.append(test_auc)
print('max_depth={}, max_auc={}'.format(axisx[test_aucs.index(max(test_aucs))], max(test_aucs)))
#     test_fpr, test_tpr, _ = roc_curve(y_test,clf.predict_proba(x_test)[:,1])
#     test_ks = abs(test_fpr-test_tpr).max()
#     print('test_ks = ', test_ks)
#     print('test_auc = ', test_auc)


plt.figure(figsize=(20,5))
plt.plot(axisx, test_aucs,c="red",label="LGBC")
plt.ylabel('auc')
plt.xticks(axisx)
plt.legend()
plt.show()

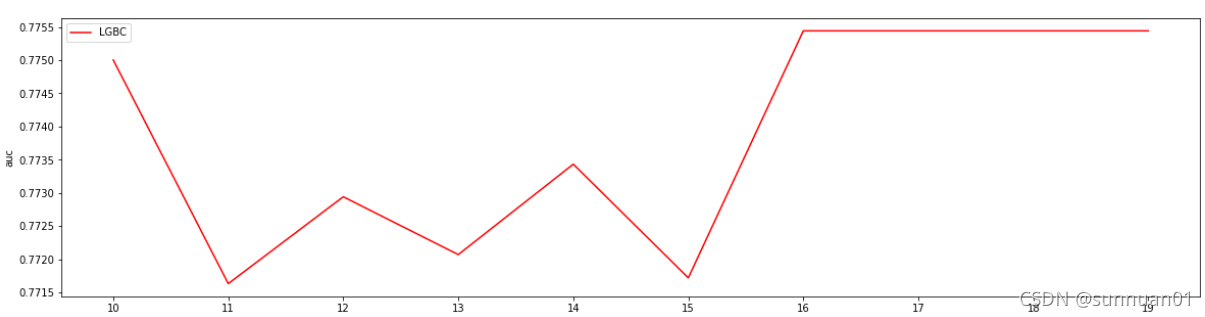
# 通过观察auc大小调参num_leaves,  num_leaves=16, max_auc=0.7754420865945606
# axisx = np.linspace(0.001,0.005,10)
axisx = range(10,20,1)
# axisx = [3, 4, 5, 6, 7]
test_aucs = []
for i in axisx:
    lgb_model = lgb.LGBMClassifier(n_estimators=800,
                                boosting_type='gbdt',
                               learning_rate=0.04,
                               min_child_samples=68,
                               min_child_weight=0.01,
                                  max_depth=4,
                              num_leaves=i,
                              colsample_bytree=0.7,
                              subsample=0.6,
                              reg_alpha=0.03,
                              reg_lambda=0.3,
                               objective='binary',
                               max_features = 140,)
    clf = lgb_model.fit(x_train, y_train,
              eval_set=[(x_train, y_train),(x_test,y_test)],
              eval_metric='auc',early_stopping_rounds=100)
    test_auc = roc_auc_score(y_test,clf.predict_proba(x_test)[:,1])
    test_aucs.append(test_auc)
print('num_leaves={}, max_auc={}'.format(axisx[test_aucs.index(max(test_aucs))], max(test_aucs)))
#     test_fpr, test_tpr, _ = roc_curve(y_test,clf.predict_proba(x_test)[:,1])
#     test_ks = abs(test_fpr-test_tpr).max()
#     print('test_ks = ', test_ks)
#     print('test_auc = ', test_auc)


plt.figure(figsize=(20,5))
plt.plot(axisx, test_aucs,c="red",label="LGBC")
plt.ylabel('auc')
plt.xticks(axisx)
plt.legend()
plt.show()
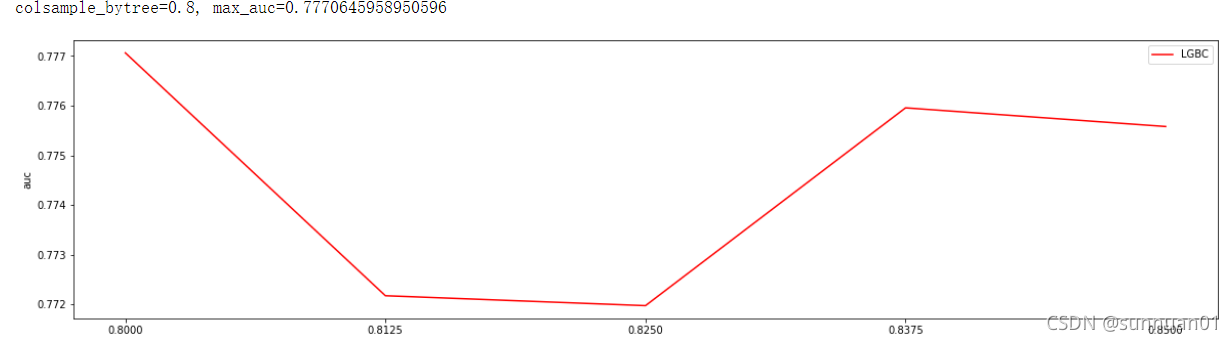
# 通过观察auc大小调参colsample_bytree,  colsample_bytree=0.8, max_auc=0.7770645958950596
axisx = np.linspace(0.8,0.85,5)
# axisx = range(10,101,10)
# axisx = [3, 4, 5, 6, 7]
test_aucs = []
for i in axisx:
    lgb_model = lgb.LGBMClassifier(n_estimators=800,
                                boosting_type='gbdt',
                               learning_rate=0.04,
                               min_child_samples=68,
                               min_child_weight=0.01,
                                  max_depth=4,
                              num_leaves=16,
                              colsample_bytree=i,
                              subsample=0.6,
                              reg_alpha=0.03,
                              reg_lambda=0.3,
                               objective='binary',
                               max_features = 140,)
    clf = lgb_model.fit(x_train, y_train,
              eval_set=[(x_train, y_train),(x_test,y_test)],
              eval_metric='auc',early_stopping_rounds=100)
    test_auc = roc_auc_score(y_test,clf.predict_proba(x_test)[:,1])
    test_aucs.append(test_auc)
print('colsample_bytree={}, max_auc={}'.format(axisx[test_aucs.index(max(test_aucs))], max(test_aucs)))
#     test_fpr, test_tpr, _ = roc_curve(y_test,clf.predict_proba(x_test)[:,1])
#     test_ks = abs(test_fpr-test_tpr).max()
#     print('test_ks = ', test_ks)
#     print('test_auc = ', test_auc)


plt.figure(figsize=(20,5))
plt.plot(axisx, test_aucs,c="red",label="LGBC")
plt.ylabel('auc')
plt.xticks(axisx)
plt.legend()
plt.show()
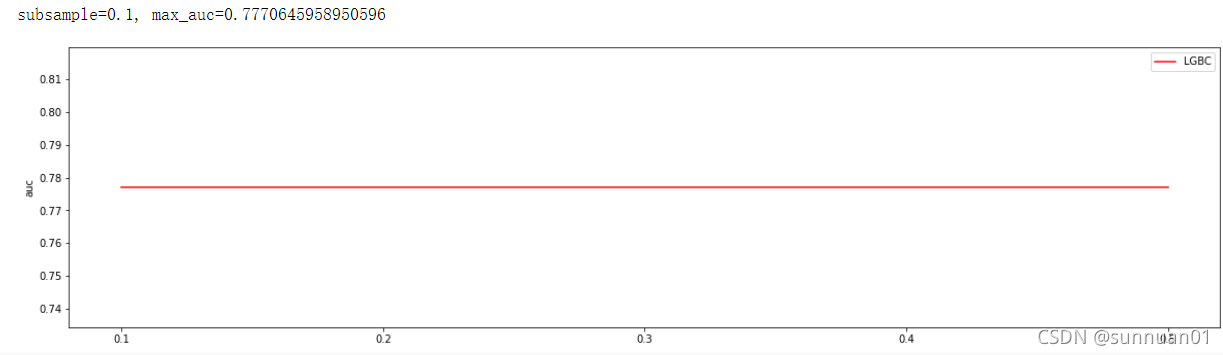
# 通过观察auc大小调参subsample, 此参数没有对auc产生影响
axisx = np.linspace(0.7,0.8,10)
# axisx = range(10,101,10)
# axisx = [3, 4, 5, 6, 7]
test_aucs = []
for i in axisx:
    lgb_model = lgb.LGBMClassifier(n_estimators=800,
                                boosting_type='gbdt',
                               learning_rate=0.04,
                               min_child_samples=68,
                               min_child_weight=0.01,
                                  max_depth=4,
                              num_leaves=16,
                              colsample_bytree=0.8,
                              subsample=i,
                              reg_alpha=0.03,
                              reg_lambda=0.3,
                               objective='binary',
                               )
    clf = lgb_model.fit(x_train, y_train,
              eval_set=[(x_train, y_train),(x_test,y_test)],
              eval_metric='auc',early_stopping_rounds=100)
    test_auc = roc_auc_score(y_test,clf.predict_proba(x_test)[:,1])
    test_aucs.append(test_auc)
print('subsample={}, max_auc={}'.format(axisx[test_aucs.index(max(test_aucs))], max(test_aucs)))
#     test_fpr, test_tpr, _ = roc_curve(y_test,clf.predict_proba(x_test)[:,1])
#     test_ks = abs(test_fpr-test_tpr).max()
#     print('test_ks = ', test_ks)
#     print('test_auc = ', test_auc)


plt.figure(figsize=(20,5))
plt.plot(axisx, test_aucs,c="red",label="LGBC")
plt.ylabel('auc')
plt.xticks(axisx)
plt.legend()
plt.show()
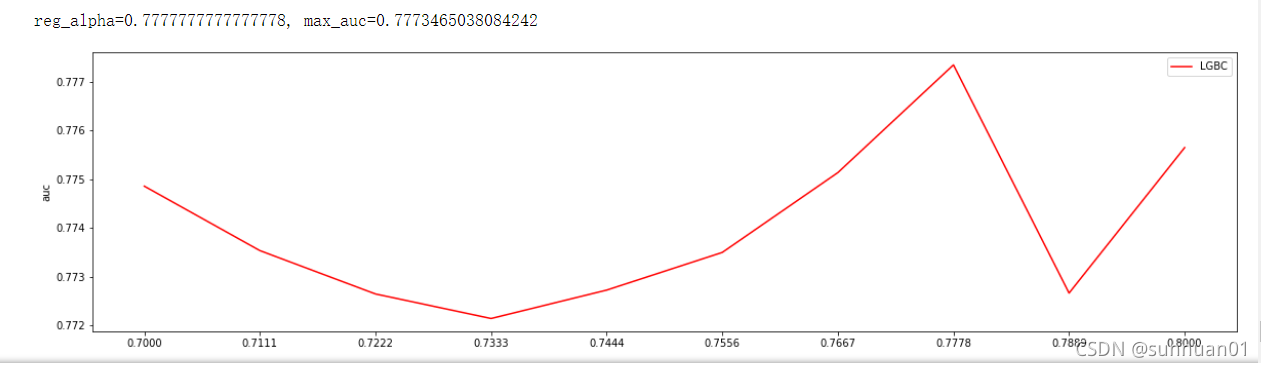
# 通过观察auc大小调参reg_alpha, reg_alpha=0.7777777777777778, max_auc=0.7773465038084242
axisx = np.linspace(0.7,0.8,10)
# axisx = range(0,1,10)
# axisx = [3, 4, 5, 6, 7]
test_aucs = []
for i in axisx:
    lgb_model = lgb.LGBMClassifier(n_estimators=800,
                                boosting_type='gbdt',
                               learning_rate=0.04,
                               min_child_samples=68,
                               min_child_weight=0.01,
                                  max_depth=4,
                              num_leaves=16,
                              colsample_bytree=0.8,
                              subsample=0.8,
                              reg_alpha=i,
                              reg_lambda=0.3,
                               objective='binary',
                               )
    clf = lgb_model.fit(x_train, y_train,
              eval_set=[(x_train, y_train),(x_test,y_test)],
              eval_metric='auc',early_stopping_rounds=100)
    test_auc = roc_auc_score(y_test,clf.predict_proba(x_test)[:,1])
    test_aucs.append(test_auc)
print('reg_alpha={}, max_auc={}'.format(axisx[test_aucs.index(max(test_aucs))], max(test_aucs)))
#     test_fpr, test_tpr, _ = roc_curve(y_test,clf.predict_proba(x_test)[:,1])
#     test_ks = abs(test_fpr-test_tpr).max()
#     print('test_ks = ', test_ks)
#     print('test_auc = ', test_auc)


plt.figure(figsize=(20,5))
plt.plot(axisx, test_aucs,c="red",label="LGBC")
plt.ylabel('auc')
plt.xticks(axisx)
plt.legend()
plt.show()
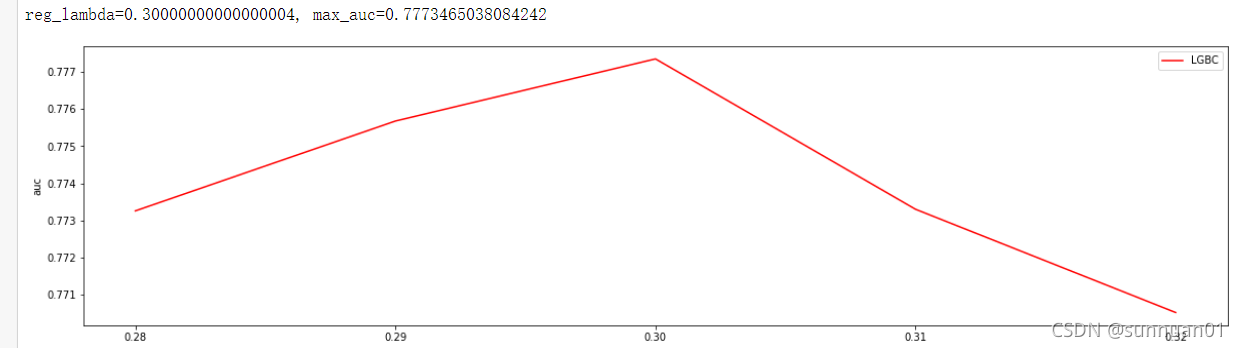
# 通过观察auc大小调参reg_lambda, reg_lambda=0.30000000000000004, max_auc=0.7773465038084242
axisx = np.linspace(0.28,0.32,5)
# axisx = range(0,1,10)
# axisx = [3, 4, 5, 6, 7]
test_aucs = []
for i in axisx:
    lgb_model = lgb.LGBMClassifier(n_estimators=800,
                                boosting_type='gbdt',
                               learning_rate=0.04,
                               min_child_samples=68,
                               min_child_weight=0.01,
                                  max_depth=4,
                              num_leaves=16,
                              colsample_bytree=0.8,
                              subsample=0.8,
                              reg_alpha=0.7777777777777778,
                              reg_lambda=i,
                               objective='binary',
                               )
    clf = lgb_model.fit(x_train, y_train,
              eval_set=[(x_train, y_train),(x_test,y_test)],
              eval_metric='auc',early_stopping_rounds=100)
    test_auc = roc_auc_score(y_test,clf.predict_proba(x_test)[:,1])
    test_aucs.append(test_auc)
print('reg_lambda={}, max_auc={}'.format(axisx[test_aucs.index(max(test_aucs))], max(test_aucs)))
#     test_fpr, test_tpr, _ = roc_curve(y_test,clf.predict_proba(x_test)[:,1])
#     test_ks = abs(test_fpr-test_tpr).max()
#     print('test_ks = ', test_ks)
#     print('test_auc = ', test_auc)


plt.figure(figsize=(20,5))
plt.plot(axisx, test_aucs,c="red",label="LGBC")
plt.ylabel('auc')
plt.xticks(axisx)
plt.legend()
plt.show()
总结
我们观察整个调参过程,有的参数并没有对auc产生影响,有的效果很明显,总的来说调参后的效果要好些。


 759
759

 被折叠的 条评论
为什么被折叠?
被折叠的 条评论
为什么被折叠?
 到【灌水乐园】发言


