


import numpy as np
import pandas as pd
import matplotlib.pyplot as plt
import seaborn as sns
from sklearn import metrics
from sklearn.model_selection import train_test_split
from sklearn.ensemble import RandomForestRegressor 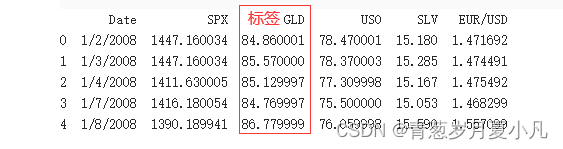
#读取数据
gold_data = pd.read_csv('data/gld_price_data.csv')
gold_data.head()

# 划分特征和标签
X = gold_data.drop(columns=['Date','GLD'],axis=1)
y = gold_data['GLD']

划分数据集
X_train,X_test,y_train,y_test = train_test_split(X,y,test_size = 0.2,random_state =2)
model = RandomForestRegressor(n_estimators=100)
model.fit(X_train,y_train)
#模型预测
pred = model.predict(X_test)
#结果可视化
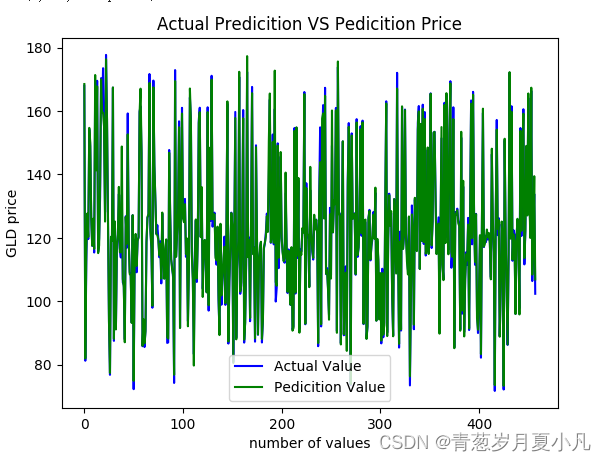
plt.plot(y_test,color = 'blue',label = 'Actual Value')
plt.plot(pred,color = 'green',label = 'Pedicition Value')
plt.legend()
plt.title('Actual Predicition VS Pedicition Price')
plt.xlabel('number of values')
plt.ylabel('GLD price') 工作流程:
工作流程:
可视化预测值与实际值:


 710
710

 被折叠的 条评论
为什么被折叠?
被折叠的 条评论
为什么被折叠?
 到【灌水乐园】发言


