


1. 绘制天空视图源码(Matlab)
clear;clc;
close all

filename='posgo_azel.txt';
fid = fopen(filename, 'r');MAXSAT=211;ix=0;
az=zeros(1,MAXSAT);el=zeros(1,MAXSAT);
% read file
while(1)
    line=fgetl(fid);
    if (line == -1)
        break;
    end
    if(line(1:1)=='>')
        fprintf('%s\n',line);ix=ix+1;
        yr=str2double(line(3:6));mon=str2double(line(8:9));day=str2double(line(11:12));
        hr=str2double(line(14:15));min=str2double(line(17:18));sec=str2double(line(20:26));
    else
        if(line(1:1)=='G')
            prn_s=0;
        elseif(line(1:1)=='R')
            prn_s=32;
        elseif(line(1:1)=='E')
            prn_s=59;
        elseif(line(1:1)=='C')
            prn_s=95;
        end
        sat=prn_s+str2double(line(2:3));
        az(ix,sat)=str2double(line(4:12));el(ix,sat)=str2double(line(13:21));
    end
end

tip=1;ms=5;
for i=1:MAXSAT
    id=find(abs(az(:,i))>0);
    if ~isempty(id)
        [row,col]=size(id);
        rho = rad2deg(el(id,i));% 极径=90度-高度角(deg)
        theta =az(id,i); % 极角=方位角(rad)
        if(i<33)
            polarplot(theta, rho, 'b.','MarkerSize',ms);
            leg{tip}=num2str(i,'G%02d');tip=tip+1;%#ok
        elseif(i<32+27)
            polarplot(theta, rho, 'c.','MarkerSize',ms);
            leg{tip}=num2str(i-32,'R%02d');tip=tip+1;%#ok
        elseif(i<32+27+36)
            polarplot(theta, rho, 'm.','MarkerSize',ms);
            leg{tip}=num2str(i-32-27,'E%02d');tip=tip+1;%#ok
        else
            polarplot(theta, rho, 'r.','MarkerSize',ms);
            leg{tip}=num2str(i-95,'C%02d');tip=tip+1;%#ok
        end
        text(theta(end), rho(end), leg{tip-1}, 'HorizontalAlignment', 'center',...
            'VerticalAlignment', 'middle','FontName','Times New Roman');
        hold on
    end
end
rlim([0,90]); % 设置极径范围(0到90度)
thetaticks([0:30:360]);%#ok
ax=gca;
ax.ThetaZeroLocation = 'top';
ax.RTick=[0,15,30,45,60,75,90];
ax.RTickLabel={'','15','30','45','60','75',''};
ax.RDir='reverse';
ax.ThetaTickLabel={'North','30^{o}','60^{o}','East','120^{o}','150^{o}',...
    'South','210^{o}','240^{o}','West','300^{o}','330^{o}'};
set(gca,'FontName','Times New Roman','ThetaDir','clockwise',...
    'GridLineStyle','--','gridalpha',0.5,'Fontsize',11);
2. 绘图结果
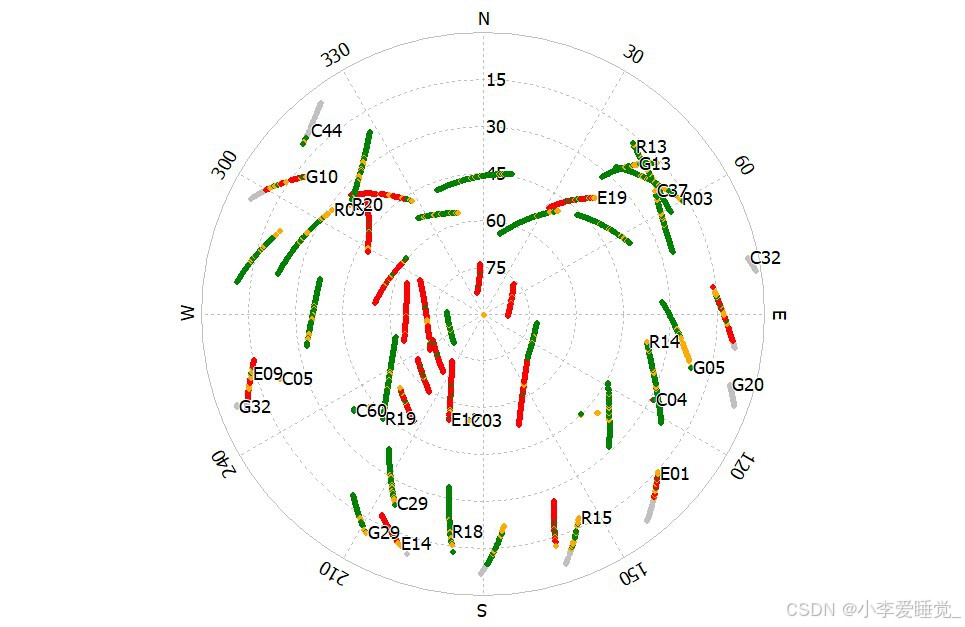
(1) rtklib plot
(2) 脚本绘图
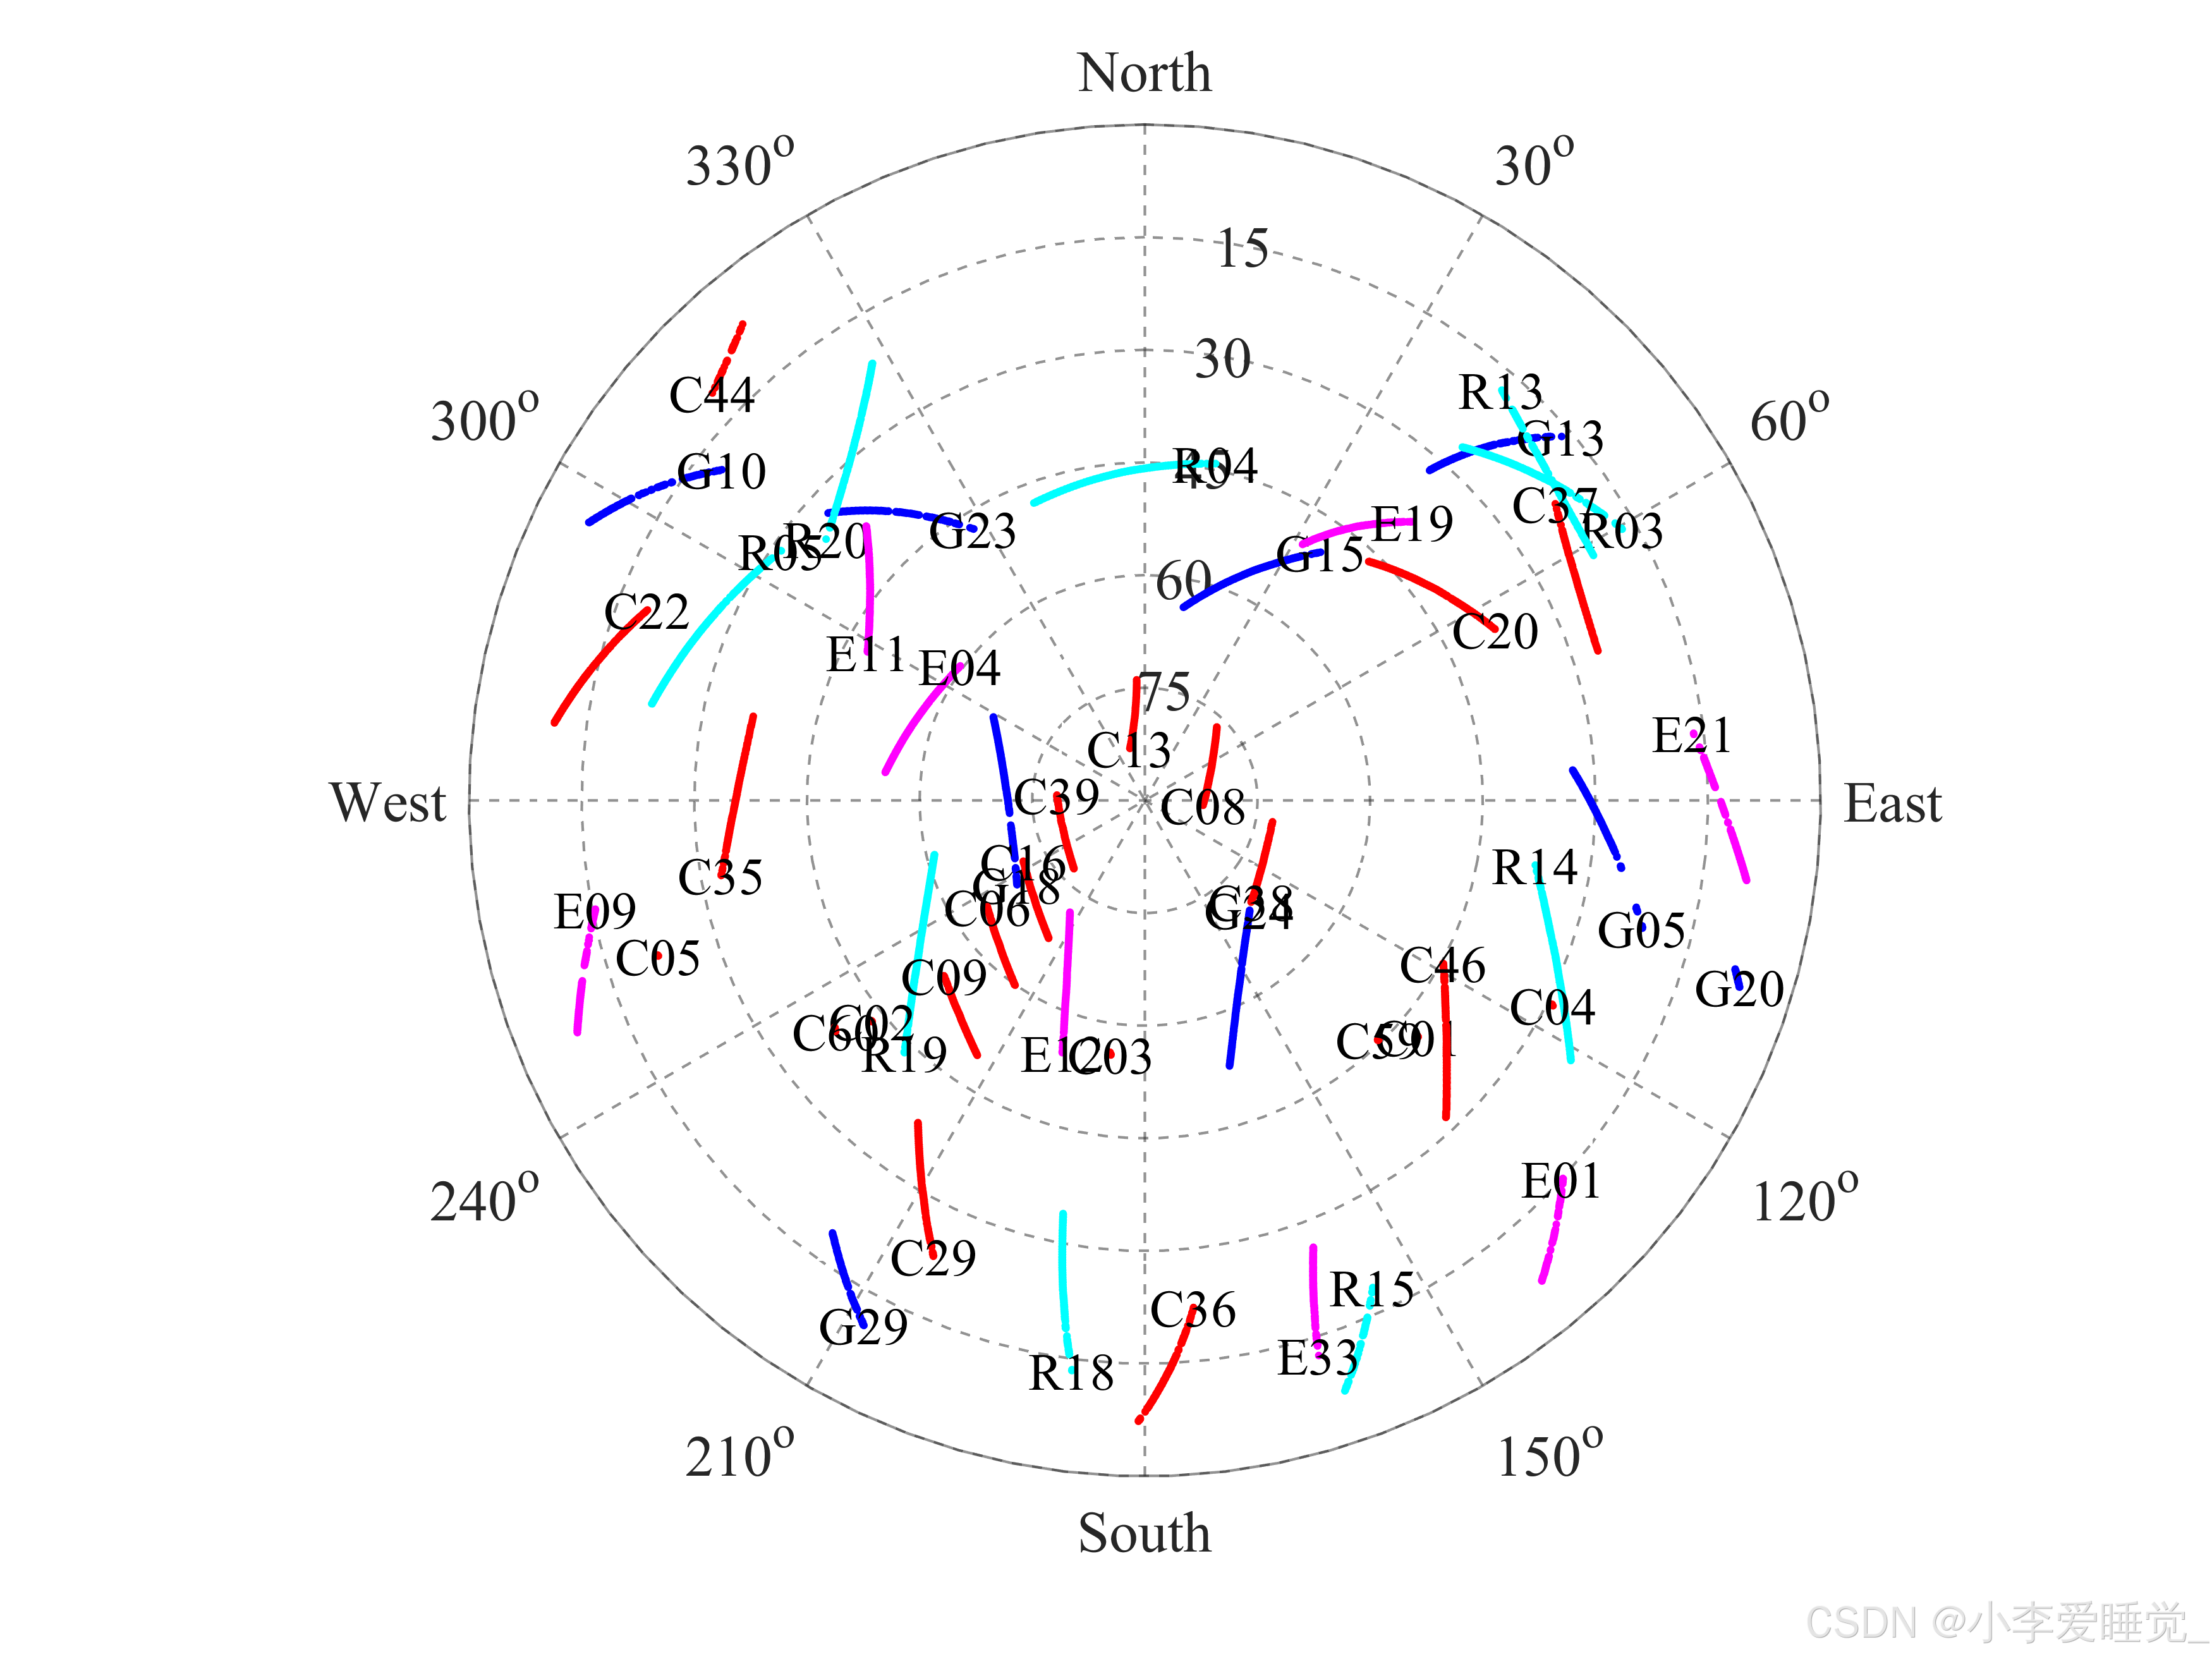
注:部分系统中的卫星(如E14)因健康状况或其它原因被剔除,即未参与解算,导致脚本未输出其信息。
参考链接


 2202
2202

 被折叠的 条评论
为什么被折叠?
被折叠的 条评论
为什么被折叠?
 到【灌水乐园】发言


