


前言
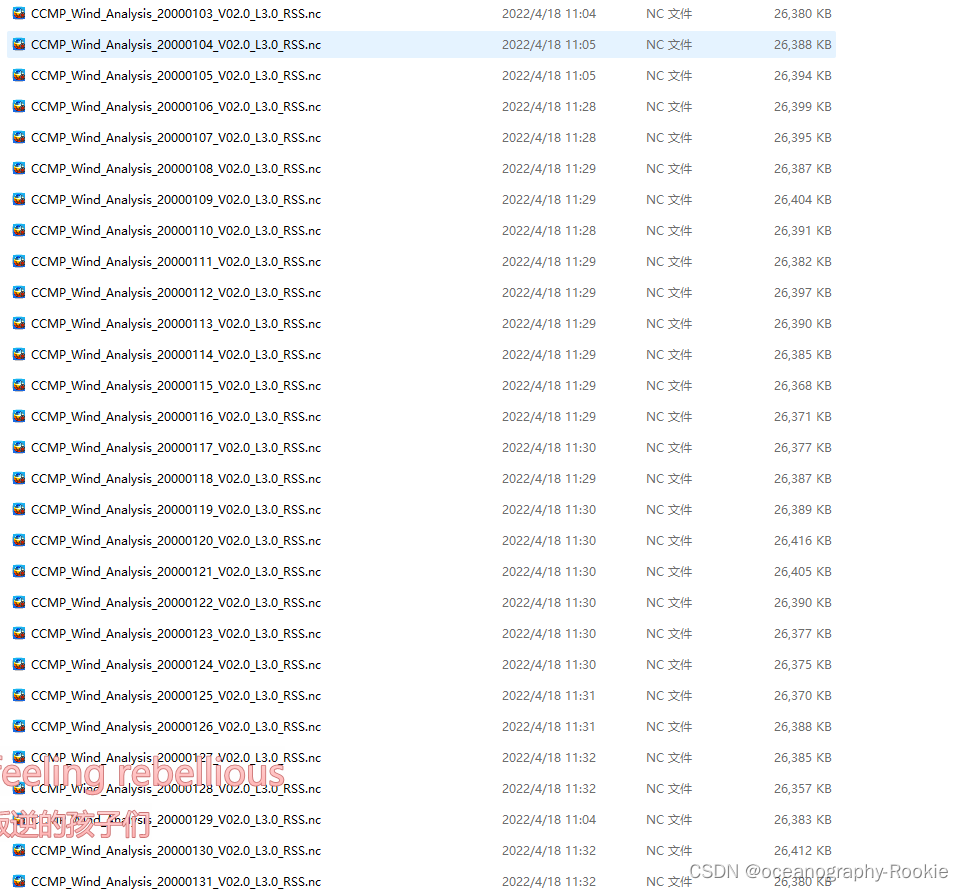
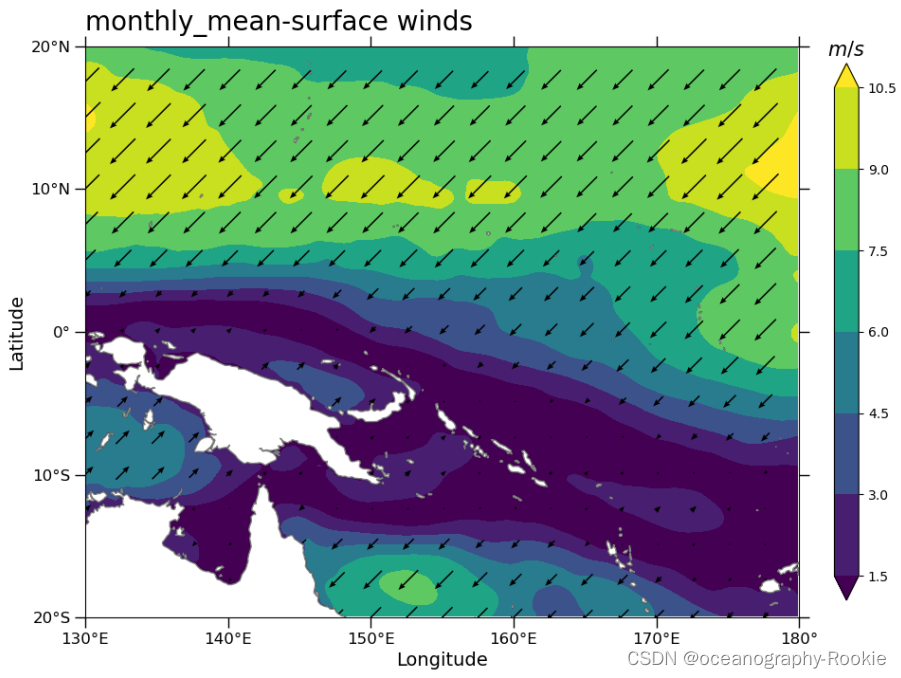
- 如下图所示,现有1月逐日的一天四次的风场资料,现需要计算1月月平均数据并绘制二维空间填色图
- 处理思路如下:
- 1、通过for循环读取数据
- 2、对于读取的日数据按照时间维求平均,将一天四次的资料处理为日平均资料
- 3、读取风速分量,将一个月内所以日平均资料存到一个空矩阵中
- 4、计算存储的风速矩阵,按照时间维求平均得到月平均数据
- 5、将月平均数据进行绘图
- 注意点:
- 对于数据名称比较统一,使用字符串进行循环读取
- 考虑到数据大小,可以在读取数据时截取部分区域,节省时间
- 先读取一个数据查看要设置的矩阵的size
code:
# -*- coding: utf-8 -*-
"""
Created on %(date)s

@author: %(jixianpu)s

Email : 211311040008@hhu.edu.cn

introduction : keep learning althongh walk slowly
"""
##########导入库###############################################################
import xarray as xr
import numpy as np
import matplotlib.pyplot as plt
import cartopy.crs as ccrs
import cartopy.feature as cfeature
from cartopy.mpl.ticker import LongitudeFormatter,LatitudeFormatter
# import glob

##########导入文件、创建空矩阵用来存储日数据################################


str0 = 'D:\mql\wind\\'
str1 = 'CCMP_Wind_Analysis_200001'
str2 = '_V02.0_L3.0_RSS.nc'


u_mean=np.zeros((160,200,31))

u_mean[:] = np.nan

v_mean=np.zeros((160,200,31))

v_mean[:] = np.nan


##########循环读入日数据、将存储的日数据求平均,得到月平均########################
i = 0

for i in range(1,31):
    file=str0+str1+'%02.0f'%(i)+str2


    da=xr.open_dataset(file).sel(longitude=slice(130,180),latitude=slice(-20,20)) #按照经纬度区域读取数据

    da_m = da.mean('time')  #  对数据的时间那一维求平均,使得一天四次的数据为一天一次
    lon  = da.longitude.data
    lat  = da.latitude.data
    u_mean[:,:,i] =da_m.uwnd  #  读取u 分量
    v_mean[:,:,i] =da_m.uwnd  #  读取v 分量

    x,y=np.meshgrid(lon.data,lat.data)
    i=i+1
#################计算月平均数据,按照时间纬度计算################################
u_monthlymean =np.nanmean(u_mean,axis=2)
v_monthlymean =np.nanmean(v_mean,axis=2)

##########读取经纬度############################################################


##########计算月均的实际风速####################################################
w =  np.sqrt(u_monthlymean*u_monthlymean+v_monthlymean*v_monthlymean)
##########封装绘图函数、保护绘图区域、投影、陆地、标题、字体大小#########################
def make_map(ax, title):
    # set_extent  set crs
    ax.set_extent(box, crs=ccrs.PlateCarree())
    land = cfeature.NaturalEarthFeature('physical',
                                        'land',
                                        scale,
                                        edgecolor='grey',
                                        facecolor='white'
                                        ,zorder=2
                                        )
    ax.add_feature(land)  # set land color
    ax.coastlines(scale)  # set coastline resolution
    # set coordinate axis
    ax.set_xticks(np.arange(box[0],box[1]+10, xstep),crs=ccrs.PlateCarree())
    ax.set_yticks(np.arange(box[2], box[3]+10, ystep),crs=ccrs.PlateCarree())
    ax.xaxis.set_major_formatter(LongitudeFormatter(zero_direction_label =False))#经度0不加标识
    ax.yaxis.set_major_formatter(LatitudeFormatter())
    # plt.tick_params(labelsize=25)

    ax.set_title(title, fontsize=20, loc='left',pad=12)
    # ax.yaxis.set_minor_locator(AutoMinorLocator(5))
    # ax.xaxis.set_minor_locator(AutoMinorLocator(10))
    ax.tick_params(which='minor',
                    direction='out', length=4,width=0.59,
                    right=True, top=True)
    ax.tick_params(which='major',
                    direction='out',
                    length=8,
                    width=0.99,
                    pad=3,
                    labelsize=12,
                    bottom=True, left=True, right=True, top=True)
    return ax

##########绘图区域、投影陆地的分辨率、经度、纬度的间隔############################
box = [130, 180, -20, 20]
scale = '50m'
xstep, ystep = 10, 10


##########进行绘图,设置一个画板##################################

fig =plt.figure(figsize=(12,10),dpi=100)

ax=fig.add_subplot(1,1,1,projection=ccrs.PlateCarree(central_longitude=180))

make_map(ax,'monthly_mean-surface winds')

ax.set_xlabel('Longitude',fontsize=14)  # 添加经度标签
ax.set_ylabel('Latitude',fontsize=14)   # 添加纬度标签


step=10# 设置风场的数据读取间隔

c=ax.contourf(lon,lat,w,transform=ccrs.PlateCarree(),extend='both')  #绘制填色图

ax.quiver(x[::step,::step],y[::step,::step],u_monthlymean[::step,::step],v_monthlymean[::step,::step],pivot='mid',transform=ccrs.PlateCarree(),
          width=0.002,scale=200,headlength=5,headwidth=4,
        )  #绘制风场箭头

#添加colorbar
cb=fig.colorbar(c,shrink=0.75,pad=0.04)

cb.ax.tick_params(labelsize=10)  #设置colorbar的字体大小
cb.ax.set_title('$m/s$',fontsize=15)  #设置colorbar的标题,字体大小


 526
526


 被折叠的 条评论
为什么被折叠?
被折叠的 条评论
为什么被折叠?
 到【灌水乐园】发言


