figure
rectangle('Position',[0,0,5,5],'Curvature',[1,1],'facecolor',[100],'edgecolor','none');
hold on
rectangle('Position',[1,1,3,3],'Curvature',[1,1],'facecolor',[111],'edgecolor','none');
axis equal
axis off
方法2:利用patch函数(支持透明度)
figure
t =0:.1:2* pi;
x2 =2.5* cos(t);
y2 =2.5* sin(t);
cmap =[1,0,0];
patch(x2, y2, cmap,'facealpha',0.4,'edgecolor','none');%// plot filled circle with transparency
hold on
x3 =1.5* cos(t);
y3 =1.5* sin(t);
cmap =[1,1,1];
patch(x3, y3, cmap,'facealpha',1,'edgecolor','none');%// plot filled circle with transparency
axis equal
axis off
二、画三维圆环
figure
r = linspace(0,2*pi,60);
s = linspace(0,pi,60);[u,v]= meshgrid(r,s);
x =2*(8+cos(v)).*cos(u);
y =2*(8+cos(v)).*sin(u);
z =2*2*sin(v);
mesh(x,y,z);
colormap
axis equal
axis off
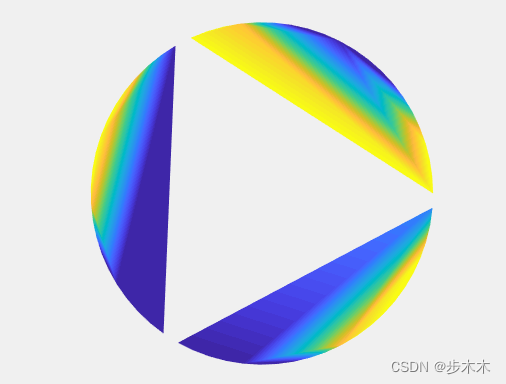
补充
figure
t =0:.1:2* pi;
x1 =2.5* cos(t);
y1 =2.5* sin(t);
x_1 =[x1(1:21);x1(22:42);x1(43:end)]';
y_1 =[y1(1:21);y1(22:42);y1(43:end)]';
cmap = hsv(21);
patch(x_1, y_1, cmap,'facealpha',1,'edgecolor','none');%// plot filled circle with transparency
axis equal
axis off


 1334
1334


 被折叠的 条评论
为什么被折叠?
被折叠的 条评论
为什么被折叠?
 到【灌水乐园】发言


