


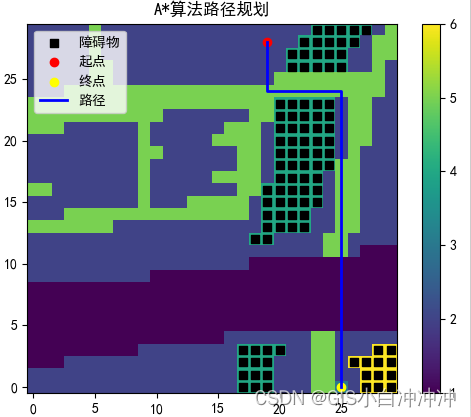
该算法为使用A算法寻找起点到终点的最优路径,同时设置了一系列障碍点,寻找的路径需避开障碍点。以淄博市某区域的栅格影像图为例,栅格像素值不同,代表的地物不同,根据地物设置每移动一步的代价也不同。
A算法是常用的静态环境路径规划算法之一,是Dijkstra算法与广度优先搜索算法结合的算法。通过借助启发式函数,A算法能够更快的找到最优路径。A算法与Dijkstra算法流程相似,但也存在以下两点不同:
(1)A算法使用启发函数来评估每个节点的“好坏”程度。节点的评估函数 f(n)如式1,综合考虑了从起始节点到当前节点的实际代价g(n) 和从当前节点到目标节点的估计代价h(n),A算法选择具有最低评估值的节点进行探索,而Dijkstra算法只考虑从起始节点到当前节点的实际代价 ,并选择具有最低实际代价的节点进行探索。
f(n)=g(n) + h(n) (1)
(2)A*算法通常需要存储每个节点的实际代价 、估计代价 和总评估值 ,而Dijkstra算法只需存储每个节点的实际代价 。
具体步骤如下:
①遍历当前节点的四个相邻栅格(上、下、左、右)。
②对于每个相邻栅格,检查它是否在栅格地图内,且不是障碍物点。
③如果相邻栅格在栅格地图内,且不是障碍物点,计算从起始位置到该邻居栅格的路径总成本:路径总成本=该邻居栅格到目标点的距离 + 每步的成本(在栅格地图中,每步的成本根据相邻栅格的像素值即地物类型确定)。
④选择当前位置和各相邻节点中对应路径总成本最小的点作为下一步路径的方向,使得总成本最小。这样,算法在不断地选择最优路径,逐步接近目标位置,最终找到起点到目标点的最短路径。
代码如下:
-- coding: utf-8 --
coding=utf-8
导入所需的库
import numpy as np
import matplotlib.pyplot as plt
from heapq import heappush, heappop
from osgeo import gdal
import time
读取栅格文件
def read_raster(file_path):
    dataset = gdal.Open(file_path)
    if dataset is None:
        raise Exception("Error opening the raster file")

    band = dataset.GetRasterBand(1)
    raster_array = band.ReadAsArray()
    return raster_array
从栅格中添加障碍物
def add_obstacles_from_raster(obstacle_value, obstacle_raster, obstacles):
    obstacle_points = np.argwhere(np.isin(obstacle_raster, obstacle_value))
    obstacles.extend([tuple(point) for point in obstacle_points])
启发式函数:估计从当前点到目标点的最短距离
def heuristic_cost_estimate(start, goal):
    return np.sqrt((start[0] - goal[0]) ** 2 + (start[1] - goal[1]) ** 2)
寻找最优路径的A*算法
def find_optimal_path(start, goal, obstacles):
    open_set = [(0, start)]  # 初始化优先队列
    came_from = {start: None}  # 初始化记录父节点的字典
    cost_so_far = {start: 0}  # 初始化到达每个位置的成本字典

    while open_set:
        current_cost, current_pos = heappop(open_set)  # 弹出当前成本最小的位置
        if current_pos == goal:  # 如果当前位置是目标位置
            path = []
            while current_pos is not None:
                path.append(current_pos)
                current_pos = came_from[current_pos]
            # 计算路径长度
            total_mincost = cost_so_far[goal]
            # 计算拐弯个数
            turns = 0
            for i in range(1, len(path) - 1):
                x1, y1 = path[i - 1]
                x2, y2 = path[i]
                x3, y3 = path[i + 1]
                cross_product = (x2 - x1) * (y3 - y2) - (y2 - y1) * (x3 - x2)
                if cross_product != 0:
                    turns += 1
            return path, total_mincost, turns  # 返回找到的路径和相关信息

        for neighbor in get_neighbors(current_pos, raster_array.shape):  # 遍历当前位置的邻居
            if neighbor not in obstacles:  # 如果邻居不是障碍物
                neighbor_pixel_value = raster_array[neighbor]
                if neighbor_pixel_value == 1:#根据栅格像素值的不同,移动一步的代价不同
                    new_cost = cost_so_far[current_pos] + 1
                elif neighbor_pixel_value == 2:
                    new_cost = cost_so_far[current_pos] + 5
                elif neighbor_pixel_value == 5:
                    new_cost = cost_so_far[current_pos] + 2
                else:
                    # 默认情况下,如果像素值不是1、2或5,则将步骤成本设置为1
                    new_cost = cost_so_far[current_pos] + 1
                if neighbor not in cost_so_far or new_cost < cost_so_far[neighbor]:
                    cost_so_far[neighbor] = new_cost
                    priority = new_cost + heuristic_cost_estimate(neighbor, goal)
                    heappush(open_set, (priority, neighbor))  # 将邻居及其优先级推入优先队列
                    came_from[neighbor] = current_pos  # 更新邻居的父位置为当前位置

    return None, 0, 0  # 如果开放集合为空且未达到目标,则返回None(未找到路径),路径长度和拐弯个数为0
获取当前位置的邻居
def get_neighbors(pos, shape):
    i, j = pos
    neighbors = [(i - 1, j), (i + 1, j), (i, j - 1), (i, j + 1)]
    valid_neighbors = [(x, y) for x, y in neighbors if 0 <= x < shape[0] and 0 <= y < shape[1]]
    return valid_neighbors
栅格文件的路径及设置起点、终点、障碍点,像素值为3的栅格为终点,像素值为4或6的栅格为障碍点
start_time = time.time()
file_path = r'F:\数据\paper1\data\初始数据\allpoint1\allpoint30.tif'
raster_array = read_raster(file_path)
start_point = (28, 19)
goal_value = 3  # 目标点的像素值
obstacle_value = [4, 6]  # 障碍点的像素值
goal_point = tuple(np.argwhere(raster_array == goal_value)[0])
obstacles = []
从栅格中找到障碍物的位置,并将其添加到障碍列表中
add_obstacles_from_raster(obstacle_value, raster_array, obstacles)
使用A*算法寻找最优路径
path, total_mincost, turns = find_optimal_path(start_point, goal_point, obstacles)
end_time = time.time()
计算总运行时间
total_runtime = end_time - start_time
#total_runtime_milliseconds = total_runtime * 1000  # 转换为毫秒
#total_runtime_microseconds = total_runtime * 1e6  # 转换为微秒
print(f"总运行时间:{total_runtime} 秒")
显示栅格地图
plt.imshow(raster_array, cmap='viridis', origin='lower')
plt.colorbar()
plt.rcParams['font.sans-serif'] = ['SimHei']  # 指定默认字体
plt.rcParams['axes.unicode_minus'] = False  # 解决保存图像是负号'-'显示为方块的问题
plt.title('A*算法路径规划')
绘制起点、终点障碍物
plt.scatter([o[1] for o in obstacles], [o[0] for o in obstacles], color='black', marker='s', label='障碍物')
plt.scatter(start_point[1], start_point[0], color='red', marker='o', label='起点')
plt.scatter(goal_point[1], goal_point[0], color='yellow', marker='o', label='终点')
展示最优路径,输出路径总成本、路径拐弯个数、路径长度
path_x, path_y = zip(*path)
plt.plot(path_y, path_x, color='blue', linewidth=2, label='路径')
plt.legend()
num_crossed_cells = len(path)
print(f"路径总成本:{total_mincost}")
print(f"拐弯个数:{turns}")
print(f"路径穿越的栅格数量:{num_crossed_cells}")#通过穿越的栅格数量计算路径长度

plt.show()


 5863
5863


 被折叠的 条评论
为什么被折叠?
被折叠的 条评论
为什么被折叠?
 到【灌水乐园】发言


