


 本文介绍了概率路图法(PRM)在解决高维空间路径规划问题中的应用,通过随机采样和碰撞检测构建路径网络图,最后结合深度优先搜索寻找从起点到终点的最优路径。代码示例展示了PRM算法的实现过程和在给定栅格数据中的应用。
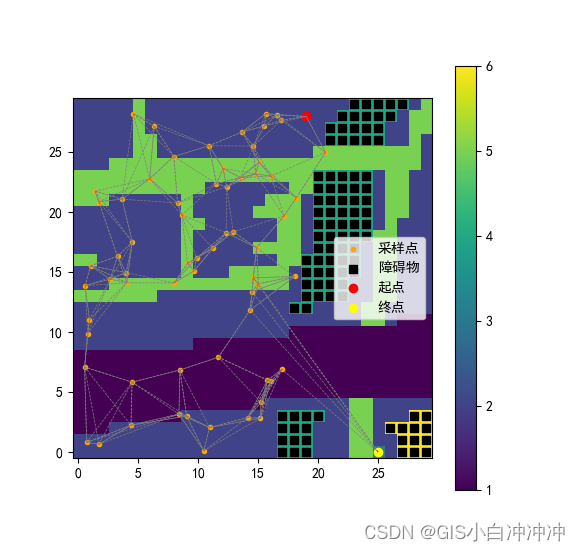
概率路图法(PRM)是基于采样算法的一种,可以较好的解决在高维空间中构造出有效路径图的问题。其基本思想是在移动机器人可以自由移动的区域即除去障碍物及其边缘的区域进行随机采样,将各个采样点进行连接,构成路径网络图,在路径网络图中使用搜索算法查找移动机器人的可行路径。
以下代码是PRM算法构建路径网络图的代码,其主要步骤如下:
①随机生成采样点;
②去除起点与采样点的连线经过障碍物的采样点;
③遍历所有采样点,选择距离每个采样点最近的五个采样点作为当前采样点的邻居节点;
④连接每个采样点及其邻居节点,构成路径网络图。
使用PRM算法构成路径网络图后,可以结合其他搜索算法在路径网络图中寻找从起点到终点的最优路径。
# -*- coding: utf-8 -*-
# coding=utf-8
# 主要实现了 PRM(Probabilistic Roadmap)路径规划算法。
# PRM是一种基于概率的路径规划算法,它通过在随机生成的节点上进行连接,构建一个图,然后使用图搜索算法(在这里是深度优先搜索)来找到起点到目标点的路径。
import random  # 用于生成随机数
import math  # 用于执行数学运算
import matplotlib.pyplot as plt  # 用于可视化结果
import time
import numpy as np
from osgeo import gdal
# 定义一个节点类,表示图中的节点
class Node:
    def __init__(self, x, y):
        self.x = x  # 节点的 x 坐标
        self.y = y  # 节点的 y 坐标
        self.neighbors = []  # 与该节点相邻的其他节点
#读取栅格像素值
def read_raster(file_path):
    dataset = gdal.Open(file_path)
    if dataset is None:
        raise Exception("Error opening the raster file")
    band = dataset.GetRasterBand(1)
    raster_array = band.ReadAsArray()
    #这行代码调用ReadAsArray方法,该方法将栅格波段中的像素值读取为NumPy数组。
    # 这个数组raster_array包含了图像中每个像素的值,形状与影像的大小相匹配。
    return raster_array
#找出障碍物点的坐标
def add_obstacles_from_raster(obstacle_value, obstacle_raster):
    obstacle_points = np.argwhere(np.isin(obstacle_raster, obstacle_value))
    return [Node(point[1], point[0]) for point in obstacle_points]
# 计算两个节点之间的欧几里得距离
def distance(node1, node2):
    return math.sqrt((node1.x - node2.x) ** 2 + (node1.y - node2.y) ** 2)
# 生成一个随机节点,坐标在 (0, 30) 范围内
def generate_random_node():
    return Node(random.uniform(0, 29), random.uniform(0, 29))
# 检查两个节点之间是否存在碰撞,即是否有障碍物阻挡
def is_collision_free(node1, node2, obstacles, num_steps=50):
    # 使用了线性插值的概念,用于在两个点之间生成一系列等距离的中间点。这些中间点的生成是通过沿着两个节点之间的连线,
    # 按照一定的步数(num_steps)插值生成的。
    intermediate_points = [
        Node(
            node1.x + i * (node2.x - node1.x) / (num_steps - 1),
            node1.y + i * (node2.y - node1.y) / (num_steps - 1)
        )
        for i in range(num_steps)
    ]
 # 对于每个中间点,检查是否与障碍物发生碰撞
    for point in intermediate_points:
        if distance(point, obstacles) < 0.5:
            return False
    return True
# 构建 PRM 图,连接起点、终点和随机节点,考虑碰撞检测
def build_prm(start, goal, num_nodes, num_neighbors, obstacles):
    nodes = [start, goal]#这是 PRM 图的起始状态,其中已知的起点和目标点是图中的两个节点
    # 生成随机节点
    for _ in range(num_nodes - 2):
        random_node = generate_random_node()
        if is_collision_free(start, random_node, obstacles):
            nodes.append(random_node)
    # 将节点连接到其相邻节点
    for i, node in enumerate(nodes):#通过 enumerate 函数遍历节点列表 nodes,返回节点的索引 i 和节点对象 node。
        node.neighbors = sorted(  #为当前节点 node 设置相邻节点。这里使用了列表推导式和 sorted 函数。
            [other for other in nodes if node != other and is_collision_free(node, other, obstacles)],
            #这部分使用列表推导式创建一个列表,包含与当前节点 node 不相等且与其没有碰撞的其他节点 other。
            key=lambda n: distance(node, n)# 使用 sorted 函数对相邻节点列表进行排序,排序的关键是节点之间的距离,距离短的排在前面。
        )[:num_neighbors]#从排序后的相邻节点列表中取前 num_neighbors 个节点。这是为了限制每个节点的相邻节点的数量,避免连接到所有节点,提高图的稀疏性。
    return nodes
start_time = time.time()
file_path = r'F:\数据\paper1\data\初始数据\allpoint1\allpoint30.tif'
raster_array = read_raster(file_path)
start_point = Node(19, 28)
goal_value = 3  # 目标点的像素值
goal_point1 = tuple(np.argwhere(raster_array == goal_value)[0])
goal_point = Node(goal_point1[1], goal_point1[0])
obstacle_value = [4,6]  # 障碍点的像素值
obstacles =  Node(1, 18)
num_nodes = 100 #设置要生成的随机节点的数量,这些随机节点将用于构建 PRM 图。
num_neighbors = 5 #每个节点与其相邻节点的最大数量,用于构建 PRM 图
nodes = build_prm(start_point, goal_point, num_nodes, num_neighbors, obstacles)
end_time = time.time()
#展示结果`在这里插入代码片`
# 计算总运行时间
total_runtime = end_time - start_time
#total_runtime_milliseconds = total_runtime * 1000  # 转换为毫秒
#total_runtime_microseconds = total_runtime * 1e6  # 转换为微秒
print(f"总运行时间:{total_runtime} 秒")
plt.rcParams['font.sans-serif'] = ['SimHei']  # 指定默认字体
plt.rcParams['axes.unicode_minus'] = False  # 解决保存图像是负号'-'显示为方块的问题
plt.figure(figsize=(8, 8))
image = plt.imshow(np.ones_like(raster_array), cmap='Blues', origin='lower', extent=(-1, raster_array.shape[1], -1, raster_array.shape[0]))
colorbar = plt.colorbar(image, orientation='vertical', shrink=0.8, pad=0.05)  # 调整shrink和pad以适应你的需求
colorbar.remove()  # 移除颜色条
plt.scatter([node.x for node in nodes], [node.y for node in nodes], color='orange', marker='o', s=50, label='采样点')  # 较大的标记用于节点
# 设置背景颜色
plt.gca().set_facecolor('lightblue')
# 绘制障碍物
plt.scatter( obstacles.x,  obstacles.y, color='black', marker='s', s=100, label='障碍物')
# 绘制起点和终点
plt.scatter(start_point.x, start_point.y, color='red', marker='o',s=100, label='起点')
plt.scatter(goal_point.x, goal_point.y, color='green', marker='o', s=100, label='终点')

plt.show()
路径网络图如下


 349
349

 被折叠的 条评论
为什么被折叠?
被折叠的 条评论
为什么被折叠?
 到【灌水乐园】发言


