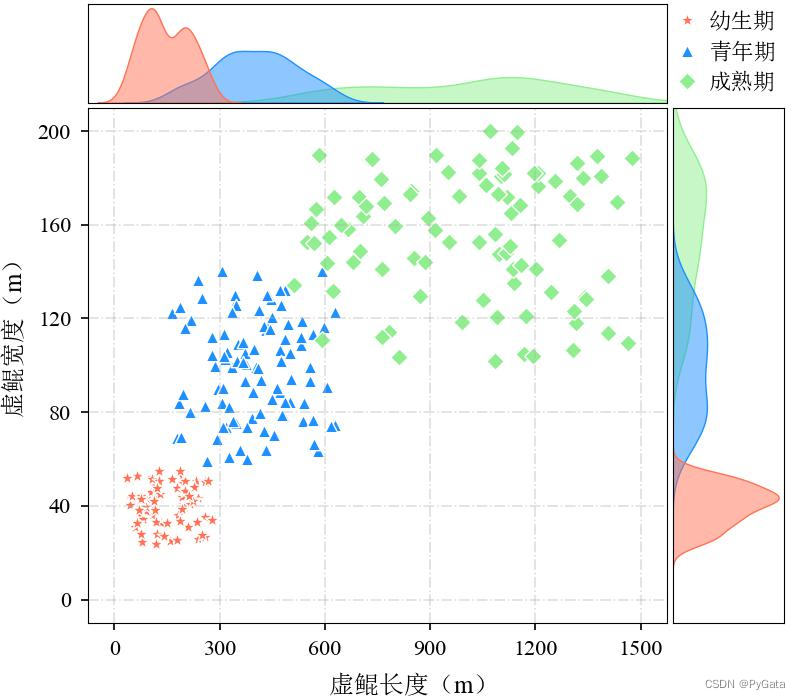
二元分布图指二维变量散点图,边缘分布图指单个变量的概率分布图 话说大乾修仙界五龙海地域,有一类妖兽,名曰“虚琨",鱼身呈黑色,有两条白色条带纵向分布,鱼尾则为灰色。因为肉质鲜美、繁殖能力强且体型庞大,深受当地修仙者喜爱且戏称其为"坤坤鱼"。然而,“虚琨"虽然名字占了个"虚”,但也传承了上古巨鲲一丝微弱血脉,幼生期便是练气十二层大圆满巅峰,青年期则一般徘徊在筑基境界,完全成熟之后可晋升至金丹初期。 “虚琨"虽性情柔弱,但体型庞大同阶修士难以抗衡,常成群出动且极为抱团,仙道渔民捕捉时常有伤亡。大乾9527年,有一名为"韩劳模"的金丹散修路经五龙海地域,尝"坤坤鱼"大餐后极为赞赏,因此雇佣仙道渔民捕捉“虚琨",然不忍见渔民伤亡惨重,历时两年半培育出了一种神奇的草药,将其制成高浓度药液泼洒于“虚琨"白色条带处,可导致该“虚琨"性情暴躁,离群落单。自此之后,“虚琨"捕获量大增,仙道渔民伤亡极大减少,"坤坤鱼"大餐名传海内外修仙界。 大乾9536年,五龙海地域修仙联盟发出告示:本宗丈量了近十年捕捉的数百条“虚琨"的长宽大小,现请求专业人士为其绘制可视化图片,以供仙道渔民参考,要求图片清晰美观、通俗易懂,报酬为两块中品灵石。本人路过此地,接收了这个任务、绘制了以下图片。 五龙海地域修仙联盟给出的“虚琨"尺寸数据格式如下,丈量的幼生期、青年期和成熟期“虚琨"分别有107、146和128条。 import math
import numpy as np
import pandas as pd
import matplotlib as mpl
import matplotlib.pyplot as plt
import seaborn as sns
config = {
"font.family":'serif',
"mathtext.fontset":'stix',
"font.serif": ['Times New Roman'], # Times New Roman字体
"axes.unicode_minus": False, # 用来正常显示负号
}
plt.rcParams.update(config)
# 1、读取数据
path = '数据1.xlsx'
sheet = pd.read_excel(io=path, header=1)
sheet

# 2、重组表格数据
columns = sheet.columns[1:3]

df_little = sheet.iloc[:,1:3].sample(n=100,random_state=23).round(1)
df_little.columns = columns
df_little['等级'] = '幼生期'
df_little

df_middle = sheet.iloc[:,4:6].sample(n=100,random_state=23).round(1)
df_middle.columns = columns
df_middle['等级'] = '青年期'
df_middle

df_big = sheet.iloc[:,7:9].sample(n=100,random_state=23).round(1)
df_big.columns = columns
df_big['等级'] = '成熟期'
df_big

df_all = pd.concat([df_little, df_middle, df_big],axis=0).reset_index(drop=True)  # 合并表格

# 3、设置seaborn颜色格式
mycolor = ["#FF7256", "#1E90FF", "#90EE90"]
current_palette = sns.color_palette(mycolor)
sns.palplot(current_palette)
plt.show()

# 4、开始绘图
plt.figure(figsize=(4,3.5),dpi=600)
plt.subplots_adjust(left=0.11, bottom=0.11, right=0.98, top=0.995)
grid = plt.GridSpec(6,6,wspace=0.05, hspace=0.05)
columns = ["幼生期", "青年期", "成熟期"]

# 4.1 绘制长度的边缘分布图
ax1 = plt.subplot(grid[0,0:5])
ax1.spines[:].set_linewidth(0.4)   # 设置坐标轴线宽
ax1.tick_params(width=0.6,length=2.5,labelsize=8)  # 设置坐标轴刻度的宽度与长度、数值刻度的字体
sns.kdeplot(data=df_all, x="长度", hue="等级",
              fill=True, common_norm=False, legend = False,palette=current_palette,
              alpha=.5, linewidth=0.5, ax=ax1)  # 边缘分布图
ax1.set_xlim(-75,1575)
ax1.set_xticks([])
ax1.set_xlabel("")
ax1.set_yticks([])
ax1.set_ylabel("")

# 4.2 绘制宽度的边缘分布图
ax2 = plt.subplot(grid[1:6,5])
ax2.spines[:].set_linewidth(0.4)
ax2.tick_params(width=0.6,length=2.5,labelsize=8)
sns.kdeplot(data=df_all, y="宽度", hue="等级",
              fill=True, common_norm=False, legend = False,palette=current_palette,
              alpha=.5, linewidth=0.5, ax=ax2)
ax2.set_ylim(-10,210)
ax2.set_xticks([])
ax2.set_xlabel("")
ax2.set_yticks([])
ax2.set_ylabel("")

# 4.3 绘制二元分布图(散点图)
ax3 = plt.subplot(grid[1:6,0:5])
ax3.spines[:].set_linewidth(0.4)
ax3.tick_params(width=0.6,length=2.5,labelsize=8)
ax3.grid(linewidth=0.6, ls='-.',alpha=0.4)
ax3.scatter(x=df_little['长度'],y=df_little['宽度'], s=30, alpha=1,marker='*',color=mycolor[0],
            edgecolors='w',linewidths=0.5,label=columns[0])
ax3.scatter(x=df_middle['长度'],y=df_middle['宽度'], s=20, alpha=1,marker='^',color=mycolor[1],
            edgecolors='w',linewidths=0.5,label=columns[1])
ax3.scatter(x=df_big['长度'],y=df_big['宽度'], s=20, alpha=1,marker='D',color=mycolor[2],
            edgecolors='w',linewidths=0.5,label=columns[2])
legend_font = {"family" : "SimSun","size":8}
ax3.legend(prop=legend_font, labelspacing=0.35,handleheight=1.2, handletextpad =0, loc = (0.98,1.01), frameon=False)
ax3.set_xlabel(r"虚鲲长度($\mathrm{m}$)",fontsize=9,family='SimSun',x=0.55)
ax3.set_ylabel(r"虚鲲宽度($\mathrm{m}$)",fontsize=9,family='SimSun',y=0.55)
ax3.set_xlim(-75,1575)
ax3.set_ylim(-10,210)
ax3.set_xticks(list(np.linspace(0,1500,6)))
ax3.set_yticks(list(np.linspace(0,200,6)))


# 5、保存图片
path_figure = r'E:\joplinFigure\Figure'
fig_title = path_figure + '\\' +"万鲲尺寸图.jpg"
plt.savefig(fig_title)
plt.show()
五龙有鱼,其名为鲲,鲲之大,一锅炖不下,你学会了吗?


 1982
1982

 被折叠的 条评论
为什么被折叠?
被折叠的 条评论
为什么被折叠?
 到【灌水乐园】发言


