


废话不多说,直接上代码
# @Time : 2022/12/17 23:35
# @Author : kzl
# @File : 决策树预测离职率.py
# @desc: data_left_tree:初始样本数据 suhan.jpg:roc图 test:测试数据
import pandas as pd
from sklearn import tree
from matplotlib import pyplot as plt
from sklearn.metrics import roc_curve, roc_auc_score
from sklearn.tree import DecisionTreeClassifier
from sklearn.metrics import accuracy_score, recall_score, f1_score
# 初始数据解析
def Initial_data_parsing(path_initial):
path_processed_in = 'Processed_data.xlsx'
InitialData = pd.read_excel(path_initial)
InitialData.drop('sales', axis=1, inplace=True)
# 处理salary
InitialData.loc[InitialData['salary'] == 'low', 'salary'] = 1
InitialData.loc[InitialData['salary'] == 'medium', 'salary'] = 2
InitialData.loc[InitialData['salary'] == 'high', 'salary'] = 3
InitialData.to_excel(path_processed_in)
return path_processed_in
def decision_tree(path_in):
processed_data = pd.read_excel(path_in)
train_x = processed_data.drop(['left', 'Unnamed: 0'], axis=1)
train_y = processed_data.get('left')
test = pd.read_excel('test.xlsx')
test_x = test.drop('left', axis=1)
test_y = test.get('left')
# print(test_x)
dtc = DecisionTreeClassifier(random_state=8)
model = dtc.fit(train_x, train_y)
pre = model.predict(test_x)
score = dtc.score(test_x, test_y)
print('预测准确度为:', score)
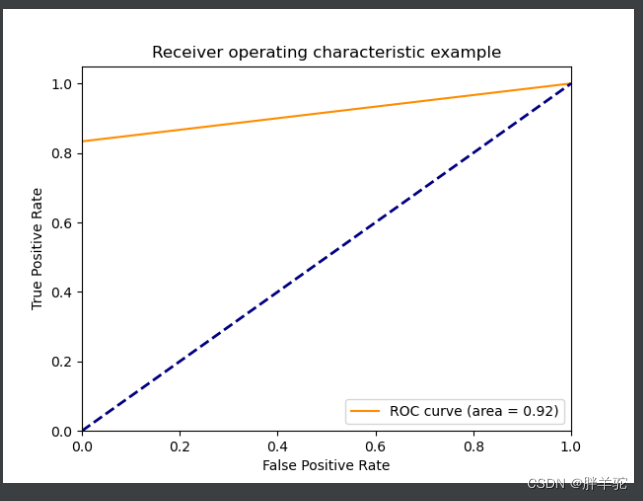
# roc 画图
fpr, tpr, thresholds = roc_curve(test_y, dtc.predict_proba(test_x)[:, 1])
auc = roc_auc_score(test_y, dtc.predict_proba(test_x)[:, 1])
# auc = roc_auc_score(y_test,clf.decision_function(X_test))
plt.plot(fpr, tpr, color='darkorange', label='ROC curve (area = %0.2f)' % auc)
plt.plot([0, 1], [0, 1], color='navy', lw=2, linestyle='--')
plt.xlim([0.0, 1.0])
plt.ylim([0.0, 1.05])
plt.xlabel('False Positive Rate')
plt.ylabel('True Positive Rate')
plt.title('Receiver operating characteristic example')
plt.legend(loc="lower right")
plt.savefig('suhan.jpg', dpi=800)
plt.show()
print('accuracy为 :', accuracy_score(test_y, pre))
print('recall为 :', recall_score(test_y, pre))
print('f1_score为:', f1_score(test_y, pre))
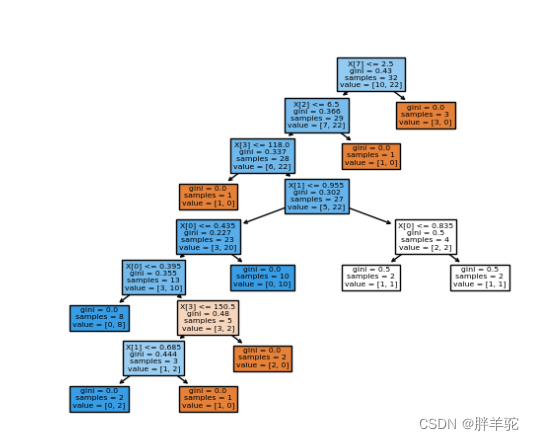
# 这是决策树的可视化
picture = tree.plot_tree(dtc, filled=True)
plt.show()
if __name__ == '__main__':
path = 'data_left_tree.xlsx'
path_processed = Initial_data_parsing(path_initial=path)
decision_tree(path_processed)
因为样本数据量太少,同时测试的样本只设置了7个,所以产生的曲线只作为demo
由于训练模型用的数据量太小,所以我胡乱改数据想让数据杂乱无章一点,结果改出来的决策树很乱,只作为运行效果展示,没有实际参考意义。


 1772
1772


 被折叠的 条评论
为什么被折叠?
被折叠的 条评论
为什么被折叠?
 到【灌水乐园】发言


