


-
对于制作地图这一类的工具,其实有好多,比如tableau、PowerBI等等,但是它们都或多或少的有些弱点。
-
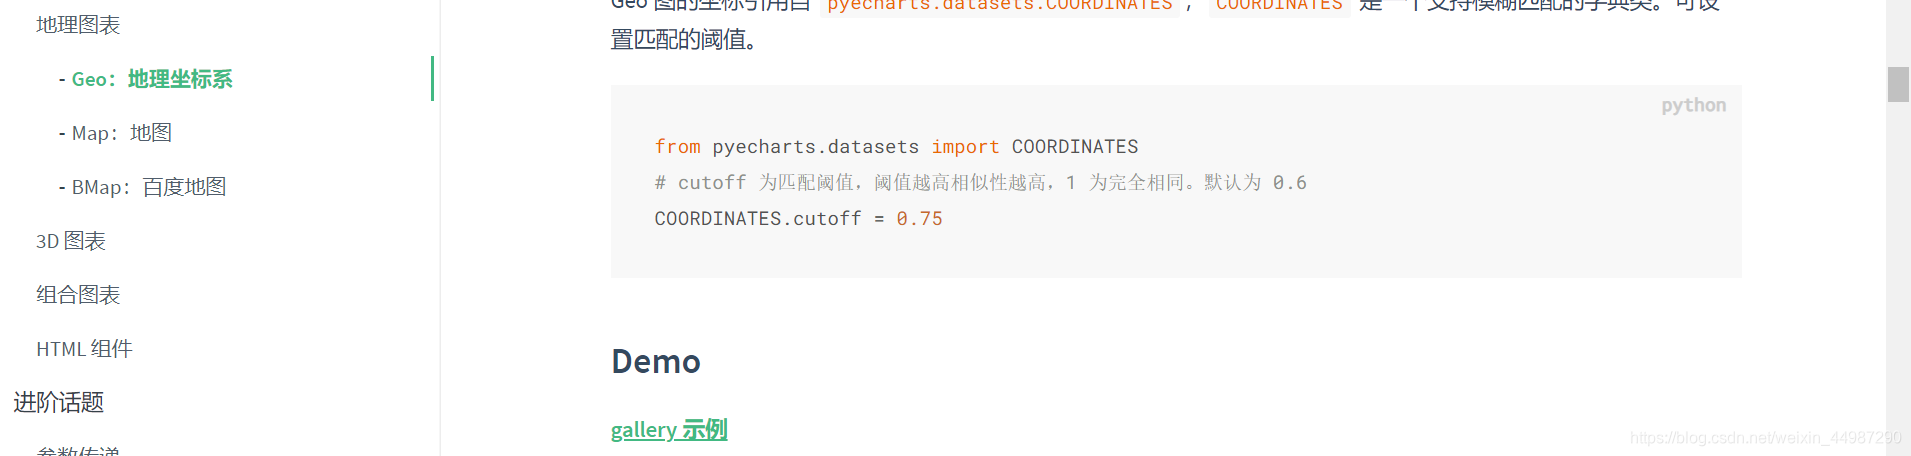
故我们这次使用pyecharts制作图形,pyecharts官网链接,官网写的比较详细,并且有图形预览(点击gallery就可以跳转到预览界面),非常的nice。
-
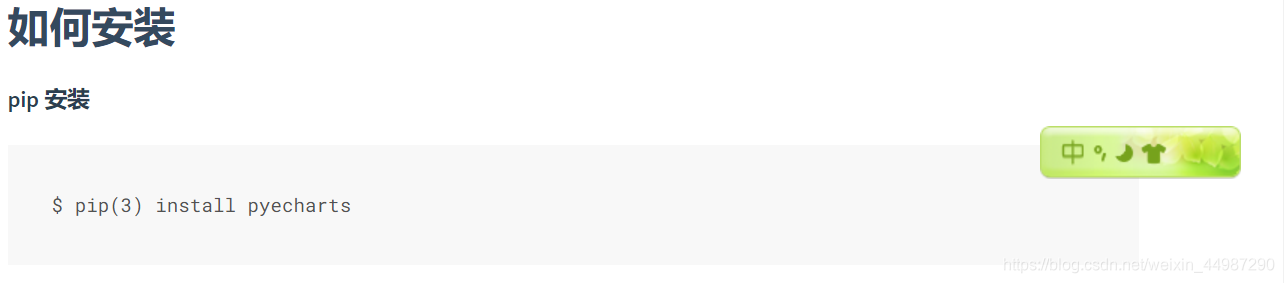
前期准备:需要安装好pyecharts库,python编译环境推荐使用jupyter notebook
,因为它可以在底部实时的观察生成的图形,当然使用别的pycharm、vscode编译器也可以。
1、根据自己的excel制作地图
import pyecharts.options as opts
from pyecharts.charts import Map
from pyecharts.commons.utils import JsCode
import pandas as pd
import re
from pyecharts.globals import ThemeType
from pyecharts.render import make_snapshot
from snapshot_selenium import snapshot
import datetime
import winreg


class MAP():
    def __init__(self,file_name):
        self.file_name=file_name
        self.time=datetime.datetime.now().strftime('%Y-%m-%d')
        pass
    def get_desktop(self):
        key = winreg.OpenKey(winreg.HKEY_CURRENT_USER,r'Software\Microsoft\Windows\CurrentVersion\Explorer\Shell Folders',)
        self.path=winreg.QueryValueEx(key, "Desktop")[0]
        #这是读取桌面路径的代码,你需要安装winreg库

    def draw(self):
        db=pd.read_excel(r'{}\{}.xlsx'.format(self.path,self.file_name),header=None)
        db.iloc[1::][1] =db.iloc[1::][1].astype("int")
        c = (
            Map(init_opts=opts.InitOpts(width="1200px", height="820px", bg_color='white',theme=ThemeType.LIGHT))#选择主题,和调整图片大小
            .add(self.file_name,[list(z) for z in zip(list(db.iloc[1::][0]),list(db.iloc[1
最低0.47元/天 解锁文章


 4万+
4万+

 被折叠的 条评论
为什么被折叠?
被折叠的 条评论
为什么被折叠?
 到【灌水乐园】发言


