


ax方法画极坐标与雷达图,雷达图是在极坐标图基础上进行删减和增加
fig = plt.figure()
ax = fig.add_subplot(111, polar=True)
ax.plot(angle, distance, color,alpha,lw,linstyle)
1 画极坐标图(折线图)
数据准备:
值序列:distance;
角度:angle,相当于x_location;
标签:labels,相当于x轴上的标签
三者均需将第一个值加到末尾,设置闭合数据
fig = plt.figure()
ax = fig.add_subplot(111, polar=True)
ax.plot(angle, distance, color,alpha,lw,linstyle, label=):
极坐标绘制(角度,与圆心的距离)构成一点
ax.set_thetagrids(angels * 180/npy.pi, labels)
plt.legend()
df = pd.DataFrame(np.random.randint(1,20,(4,3)), index=[u'衣',u'食',u'住',u'行'], columns=[u'山东',u'陕西',u'山西'])
df = df.append(df.loc[u'衣'])   # 设置数据闭合
	山东 陕西 山西
衣	9	14	15
食	15	15	12
住	10	6	3
行	4	7	18
衣	9	14	15

theta = np.linspace(0, 2*np.pi, 4, endpoint=False)  # 不包含2pi,否则首尾重合
theta = np.append(theta,theta[0])  # 角度闭合
fig = plt.figure()
ax = fig.add_subplot(111, polar=True)
for col in df.columns:
    ax.plot(theta, df[col], label=col)
ax.set_thetagrids(theta*180/np.pi, df.index)  # 添加极坐标的刻度标签
ax.legend(bbox_to_anchor=(1,1))

2 画雷达图
1 数据准备:
值序列:distance;
角度:angle,相当于x_location;
标签:labels,相当于x轴上的标签
三者均需将第一个值加到末尾,设置闭合数据
floor = np.floor(df.values.min()):数据最值
ceil = np.ceil(df.values.max())
h = np.arange(floor, ceil + 1, 1):根据数据范围进行分割

2 画图
fig = plt.figure()
ax = fig.add_subplot(111, polar=True)
ax.set_thetagrids(angles * 180/np.pi, labels)
添加多个五边形:
for i in h:
    ax.plot(angles, np.ones(len(angles)) * i, color='grey', lw=0.5)
添加数据分割竖线:
for i in range(len(labels)):
    ax.plot([angles[i], angles[i]], [floor, ceil], '--', color='grey', lw=0.5)
添加所需数据:
ax.plot(angles, distance, label=)
plt.legend()

3 美化:
ax.set_theta_zero_location('N'):设置极坐标的起点(即0°)在正北方向,
ax.spines['polar'].set_visible(False):不显示极坐标最外圈的圆
ax.grid(False):不显示默认的分割线
ax.set_yticks([]):不显示数据标签
floor = np.floor(df.values.min())  # 3
ceil = np.ceil(df.values.max())  # 18
h = np.linspace(floor, ceil, 8)  #分割数据范围,雷达图中的网

figure = plt.figure()
ax = figure.add_subplot(111,polar=True)
for i in h: # 添加多边形
    ax.plot(theta, np.ones(len(theta))*i, color='grey', lw=0.5)
for i in range(len(theta)-1):   #添加竖分割线
    ax.plot([theta[i], theta[i]], [floor, ceil], color='grey',lw=0.5)
for col in df.columns: # 添加数据
    ax.plot(theta, df[col], label=col)
ax.set_thetagrids(theta * 180/np.pi, df.index)# 重设坐标,添加分类标签
ax.grid(b=False)                  # 隐藏原始网格
ax.spines['polar'].set_visible(False)   #不显示极坐标最外圈的圆
# ax.set_yticks([])     # 不显示数据标签
plt.legend()

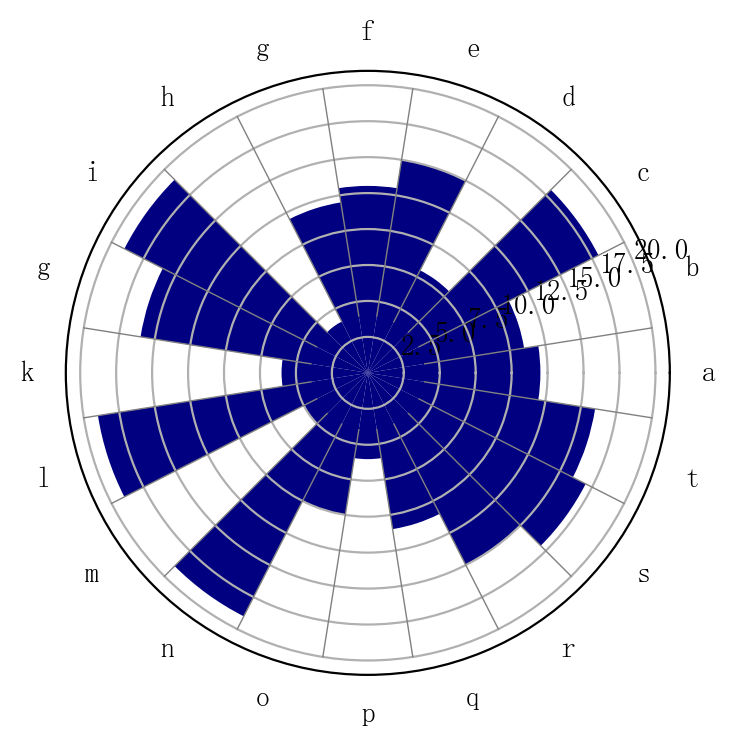
3 画柱状图
柱状图不用考虑图形闭合问题,但为美观,需要将原有角度坐标线去掉,重新添加
df = pd.DataFrame(np.random.randint(1, 20, 20), columns=['A'], index=list('abcdefghigklmnopqrst'))
theta= np.linspace(0, 2*np.pi, len(df), endpoint=False)

figure = plt.figure()
ax=figure.add_subplot(111,polar=True)
ax.set_thetagrids(theta*180/np.pi, df.index)
ax.bar(theta, df['A'], color='navy', width=(theta[1]-theta[0]))

ax.xaxis.grid(False)  # 因为柱形的位置过原分割线中心,所以去掉原分割线,重新添加
# 重新设置分割线
n_theta = theta+(theta[1]-theta[0])/2  # 位置向右移一半
floor,ceil = np.floor(min(df['A'])), np.ceil(max(df['A']))+1
for i in range(len(df)):
    ax.plot([n_theta[i], n_theta[i]], [floor, ceil], color='grey', lw=0.5)

plt.savefig(r'C:\Users\aa\Desktop\a.png',dpi=200, bbox_inches='tight')
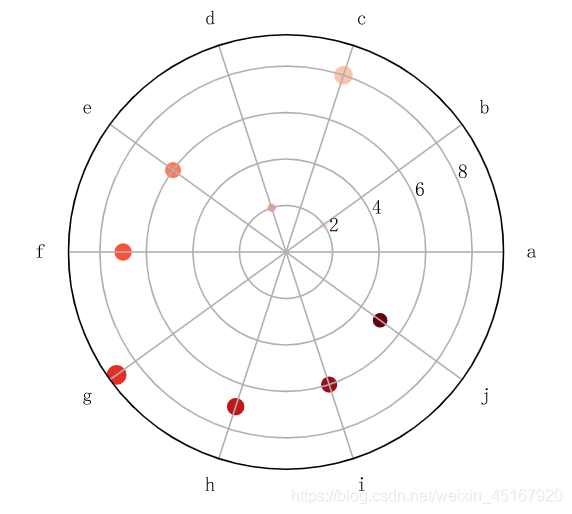
4 画散点图
不用闭合
x = pd.Series(np.random.randint(1,10, 10),index=list('abcdefghij'))
theta = np.linspace(0, 2 * np.pi, len(x), endpoint=False)
fig = plt.figure()
ax = fig.add_subplot(111,polar=True)
color = np.arange(len(x))
# 设置点的大小,颜色映射**
ax.scatter(theta, x+1, s=x*10, c=color, cmap='Reds')
ax.set_thetagrids(theta*180/np.pi, x.index)


 9777
9777


 被折叠的 条评论
为什么被折叠?
被折叠的 条评论
为什么被折叠?
 到【灌水乐园】发言


