


 本文介绍使用Python库WordCloud生成词云的各种方法,包括单词词云、阿拉伯文词云、遮罩词云等,并展示了如何调整颜色、字体及布局。
在之前词云可视化的代码中,我们已经大概介绍了词云生成的方法和步骤,这里我们就用了官网的一些例子来展示一下词云的美丽
如果想了解更多有趣的项目和小玩意,都可以来我这里哦通道
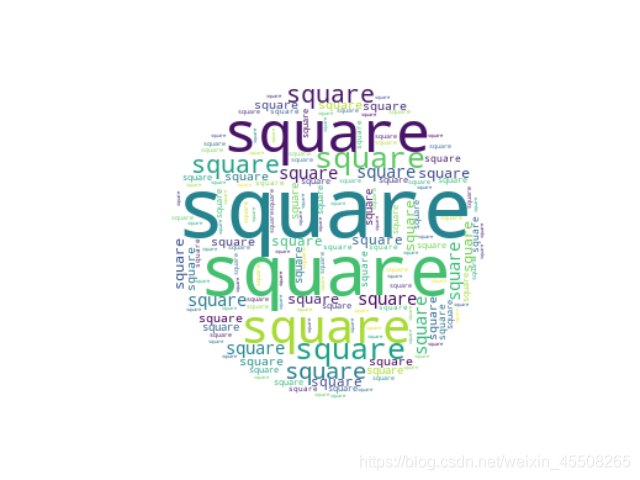
Single Word
Make a word cloud with a single word that’s repeated.
import numpy as np
import matplotlib.pyplot as plt
from wordcloud import WordCloud

text = "square"

x, y = np.ogrid[:300, :300]

# 定义一个圆心为(150,150),半径为130的圆,使得我们的mask形状是一个圆
mask = (x - 150) ** 2 + (y - 150) ** 2 > 130 ** 2
mask = 255 * mask.astype(int)

# 设置repeat参数,Make a word cloud with a single word that's repeated.
wc = WordCloud(background_color="white", repeat=True, mask=mask)
# 生成词云
wc.generate(text)

plt.axis("off")
# 采用双线性插值的方法显示颜色
plt.imshow(wc, interpolation="bilinear")
plt.show()
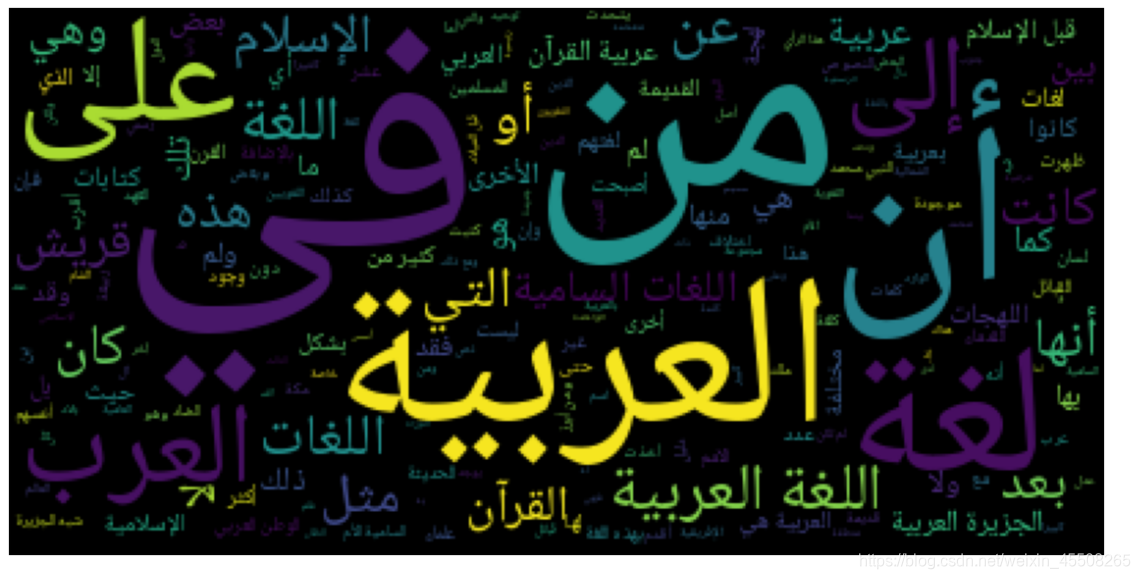
Create wordcloud with Arabic
我们现在生成阿拉伯文本
这里我们需要两个第三方库
- bidi.algorithm
- arabic_reshaper
所以我们首先要install这两个包
pip install python-bidi arabic_reshaper
import os
import codecs
from wordcloud import WordCloud
import arabic_reshaper
from bidi.algorithm import get_display

# get data directory (using getcwd() is needed to support running example in generated IPython notebook) 得到当前地址
d = os.path.dirname(__file__) if "__file__" in locals() else os.getcwd()

# Read the whole text.
f = codecs.open(os.path.join(d, 'arabicwords.txt'), 'r', 'utf-8')

# Make text readable for a non-Arabic library like wordcloud
text = arabic_reshaper.reshape(f.read())
text = get_display(text)

# Generate a word cloud image
wordcloud = WordCloud(font_path='fonts/NotoNaskhArabic/NotoNaskhArabic-Regular.ttf').generate(text)

# Export to an image
wordcloud.to_file("arabic_example.png")
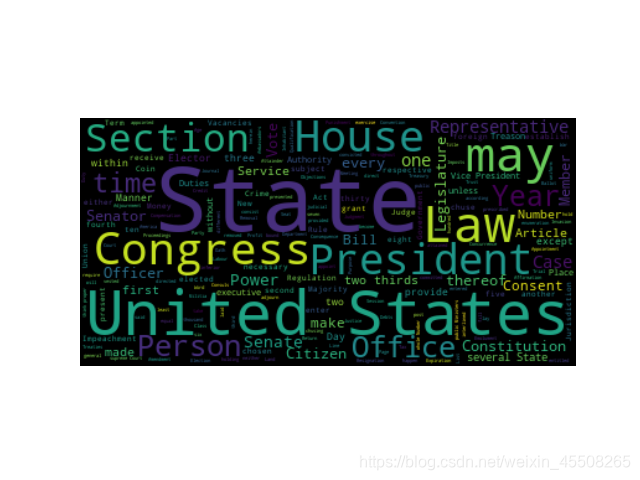
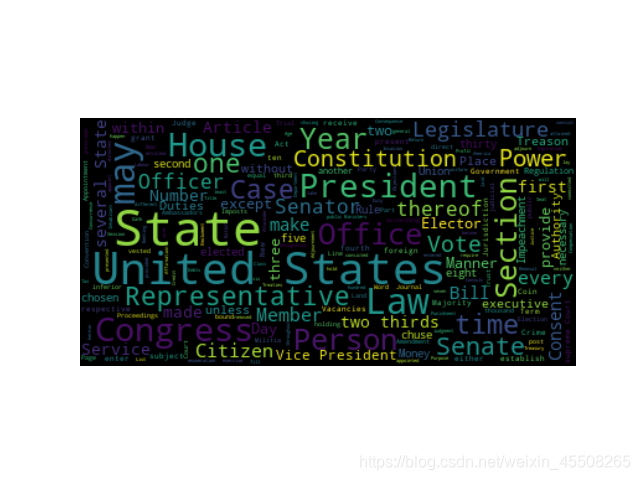
Minimal Example
Generating a square wordcloud from the US constitution using default arguments.
import os

from os import path
from wordcloud import WordCloud

# get data directory (using getcwd() is needed to support running example in generated IPython notebook)
d = path.dirname(__file__) if "__file__" in locals() else os.getcwd()

# Read the whole text.
text = open(path.join(d, 'constitution.txt')).read()

# Generate a word cloud image
wordcloud = WordCloud().generate(text)

# Display the generated image:
# the matplotlib way:
import matplotlib.pyplot as plt
plt.imshow(wordcloud, interpolation='bilinear')
plt.axis("off")

# lower max_font_size
wordcloud = WordCloud(max_font_size=40).generate(text)
plt.figure()
plt.imshow(wordcloud, interpolation="bilinear")
plt.axis("off")
plt.show()

# The pil way (if you don't have matplotlib)
# image = wordcloud.to_image()
# image.show()
Masked wordcloud
Using a mask you can generate wordclouds in arbitrary shapes.
from os import path
from PIL import Image
import numpy as np
import matplotlib.pyplot as plt
import os

from wordcloud import WordCloud, STOPWORDS

# get data directory (using getcwd() is needed to support running example in generated IPython notebook)
d = path.dirname(__file__) if "__file__" in locals() else os.getcwd()

# Read the whole text.
text = open(path.join(d, 'alice.txt')).read()

# read the mask image
# taken from
# http://www.stencilry.org/stencils/movies/alice%20in%20wonderland/255fk.jpg
alice_mask = np.array(Image.open(path.join(d, "alice_mask.png")))

stopwords = set(STOPWORDS)
stopwords.add("said")

wc = WordCloud(background_color="white", max_words=2000, mask=alice_mask,
               stopwords=stopwords, contour_width=3, contour_color='steelblue')

# generate word cloud
wc.generate(text)

# store to file
wc.to_file(path.join(d, "alice.png"))

# show
plt.imshow(wc, interpolation='bilinear')
plt.axis("off")
plt.figure()
plt.imshow(alice_mask, cmap
最低0.47元/天 解锁文章


 1万+
1万+


 到【灌水乐园】发言


