setwd('C:/Users/LHW/Desktop/polarplot_test/')#读取CSV文件
data <- read.csv("1290A_model_data.csv", header =TRUE)
data<-na.omit(data)
colnames(data)[11]<-'ws'
colnames(data)[13]<-'wd'
library(openair)
library(polarplotr)# Plot a "standard" polar plot
polarPlot(data, pollutant ="X1290A", statistic ="mean")#library(ggplot2)#library(RColorBrewer)
require(ggplot2)
require(RColorBrewer)
plot.windrose <-function(data,spd,dir,
spdres =10,#风速单位区间
dirres =30,#风向角度区间
spdmin =0,
spdmax =90,
spdseq =NULL,
palette ="YlGnBu",
countmax =NA,
debug =0){# Look to see what data was passed in to the functionif(is.numeric(spd)& is.numeric(dir)){# assume that we've been given vectors of the speed and direction vectors
data <- data.frame(spd = spd,dir = dir)
spd ="spd"
dir ="dir"}elseif(exists("data")){# Assume that we've been given a data frame, and the name of the speed # and direction columns. This is the format we want for later use. }# Tidy up input data ----
n.in<- NROW(data)
dnu <-(is.na(data[[spd]])| is.na(data[[dir]]))
data[[spd]][dnu]<-NA
data[[dir]][dnu]<-NA# figure out the wind speed bins ----if(missing(spdseq)){
spdseq <- seq(spdmin,spdmax,spdres)}else{if(debug >0){
cat("Using custom speed bins \n")}}# get some information about the number of bins, etc.
n.spd.seq <- length(spdseq)
n.colors.in.range <- n.spd.seq -1# create the color map
spd.colors <- colorRampPalette(brewer.pal(min(max(3,
n.colors.in.range),
min(9,
n.colors.in.range)),
palette))(n.colors.in.range)if(max(data[[spd]],na.rm =TRUE)> spdmax){
spd.breaks <- c(spdseq,max(data[[spd]],na.rm =TRUE))
spd.labels <- c(paste(c(spdseq[1:n.spd.seq-1]),'-', c(spdseq[2:n.spd.seq])),paste(spdmax,"-",max(data[[spd]],na.rm =TRUE)))
spd.colors <- c(spd.colors,"grey50")}else{
spd.breaks <- c(seq(spdseq))
spd.labels <- paste(c(spdseq[1:n.spd.seq-1]),'-',c(spdseq[2:n.spd.seq]))}
data$spd.binned <- cut(x = data[[spd]],
breaks = spd.breaks,
labels = spd.labels,
ordered_result =TRUE)# figure out the wind direction bins
dir.breaks <- c(-dirres/2,seq(dirres/2,360-dirres/2, by = dirres),360+dirres/2)
dir.labels <- c(paste(360-dirres/2,"-",dirres/2),paste(seq(dirres/2,360-3*dirres/2, by = dirres),"-",seq(3*dirres/2,360-dirres/2, by = dirres)),paste(360-dirres/2,"-",dirres/2))# assign each wind direction to a bin
dir.binned <- cut(data[[dir]],breaks = dir.breaks,ordered_result =TRUE)
levels(dir.binned)<- dir.labels
data$dir.binned <- dir.binned
#修改上述函数,改用英文缩写方位标志#dir.breaks <- c(-1, 11.25 + (22.5*0:16))#dir.binned <- cut(data[[dir]],breaks = dir.breaks,labels = c("N", "NNE", "NE", "ENE", "E", "ESE","SE", "SSE", "S", "SSW", "SW", "WSW", "W", "WNW", "NW", "NNW", "N2"))#levels(dir.binned)[17] = "N"# Run debug if required ----if(debug>0){
cat(dir.breaks,"\n")
cat(dir.labels,"\n")
cat(levels(dir.binned),"\n")
cat(speedcuts.colors,"\n")}# create the plot ----
p.windrose <- ggplot(data = data,aes(x = dir.binned,fill = spd.binned))+
geom_bar()+ scale_x_discrete(drop =FALSE,labels = waiver())+
coord_polar(start =-((dirres/2)/360)*2*pi)+
scale_fill_manual(name ="Wind Speed (m/s)",values = spd.colors,drop =FALSE)+
theme(axis.title.x = element_blank())# adjust axes if requiredif(!is.na(countmax)){
p.windrose <- p.windrose +
ylim(c(0,countmax))}# print the plot
print(p.windrose)# return the handle to the wind rose
return(p.windrose)}
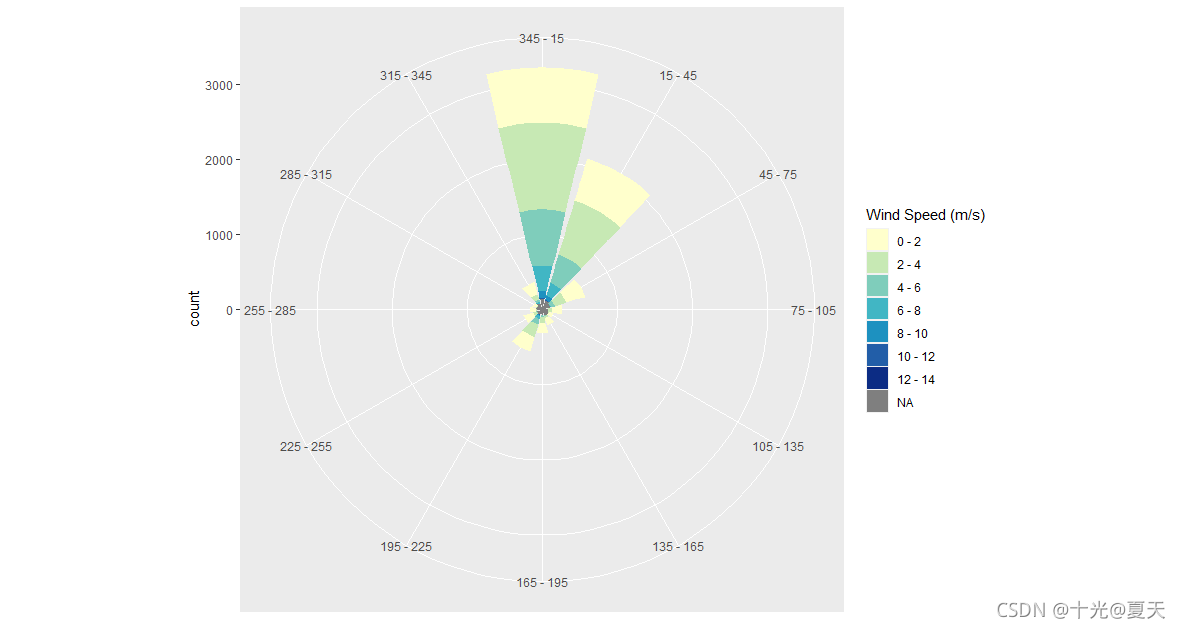
p <- plot.windrose(spd = data$ws,dir = data$wd,spdseq = c(0,2,4,6,8,10,12,14))
test<-data[data$wd<180,]
test$wd<-test$wd+180
test1<-data[data$wd>=180,]
test1$wd<-test1$wd-180
wd_convert<-bind_rows(test,test1)
p <- plot.windrose(spd = wd_convert$ws,dir = wd_convert$wd,spdseq = c(0,2,4,6,8,10,12,14))


 490
490

 被折叠的 条评论
为什么被折叠?
被折叠的 条评论
为什么被折叠?
 到【灌水乐园】发言


