


1. 绘制多图
相对于index而言 subplot=True

2.dtype, index 取出类型,返回列名
all_features.dtypes

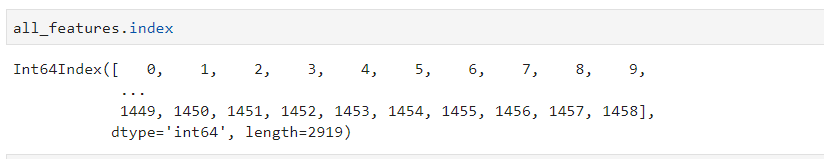
all_features.index
返回对应的行的标号
返回列名
df1.columns.values.tolist()
3. apply() 按列进行操作
对数据进行归一化可采取的方式:
#先将为数字类型的列取出来
numeric_features = all_features.dtypes[all_features.dtypes != 'object'].index
#之后对其应用apply方法 apply中对每列进行了标准化
all_features[numeric_features] = all_features[numeric_features].apply(
    lambda x: (x - x.mean()) / (x.std()))
# 标准化后,每个数值特征的均值变为0,所以可以直接用0来替换缺失值
all_features[numeric_features] = all_features[numeric_features].fillna(0)
4. get_dummies ——利用pandas实现one hot encode
df = pd.DataFrame({'A': ['a', 'b', 'a'], 'B': ['b', 'a', 'c'],
                   'C': [1, 2, 3]})
pd.get_dummies(df, prefix=['col1', 'col2'])

   C  col1_a  col1_b  col2_a  col2_b  col2_c
0  1       1       0       0       1       0
1  2       0       1       1       0       0
2  3       1       0       0       0       1
重要参数:dummy_na=True
设置为True可以为空值也分配一个编码
5. pandas fillna()填充 method方法
判断是否有空
print(train_df.isnull().any())
method{‘backfill’, ‘bfill’, ‘pad’, ‘ffill’, None}, default None
backfill == bfill 用后一项填充
pad == ffill 用前一项填充
6. 分级组织数据 groupby/MultiIndex+level
Examples
--------
>>> df = pd.DataFrame({'Animal': ['Falcon', 'Falcon',
...                               'Parrot', 'Parrot'],
...                    'Max Speed': [380., 370., 24., 26.]})
>>> df
   Animal  Max Speed
0  Falcon      380.0
1  Falcon      370.0
2  Parrot       24.0
3  Parrot       26.0
>>> df.groupby(['Animal']).mean()
        Max Speed
Animal
Falcon      375.0
Parrot       25.0

**Hierarchical Indexes**

We can groupby different levels of a hierarchical index
using the `level` parameter:

>>> arrays = [['Falcon', 'Falcon', 'Parrot', 'Parrot'],
...           ['Captive', 'Wild', 'Captive', 'Wild']]
>>> index = pd.MultiIndex.from_arrays(arrays, names=('Animal', 'Type'))
>>> df = pd.DataFrame({'Max Speed': [390., 350., 30., 20.]},
...                   index=index)
>>> df
                Max Speed
Animal Type
Falcon Captive      390.0
       Wild         350.0
Parrot Captive       30.0
       Wild          20.0
>>> df.groupby(level=0).mean()
        Max Speed
Animal
Falcon      370.0
Parrot       25.0
>>> df.groupby(level="Type").mean()
         Max Speed
Type
Captive      210.0
Wild         185.0
"""
7. value_counts()
df['got_time'].isnull().value_counts()
isnull() 会返回一个pandas Serises 之后 value_counts()统计数目
8. 主表与视图
通过切片等从主表中的得到的都是视图,直接对视图操作会修改主表,因而我们需要通过copy()函数或者reset_index函数创建副本,在副本上操作就没事


 960
960


 被折叠的 条评论
为什么被折叠?
被折叠的 条评论
为什么被折叠?
 到【灌水乐园】发言


