


「写在前面」
在科研数据分析中我们会重复地绘制一些图形,如果代码管理不当经常就会忘记之前绘图的代码。于是我计划开发一个 R 包(Biorplot),用来管理自己 R 语言绘图的代码。本系列文章用于记录 Biorplot 包开发日志。
相关链接
相关代码和文档都存放在了 Biorplot GitHub 仓库:
https://github.com/zhenghu159/Biorplot
欢迎大家 Follow 我的 GitHub 账号:
https://github.com/zhenghu159
我会不定期更新生物信息学相关工具和学习资料。如果您有任何问题和建议,或者想贡献自己的代码,请在我的 GitHub 上留言。
介绍
柱状图,常用于使用矩形的长度作为变量来比较两个或多个值(在不同时间或不同条件下)。它通常用于分析较小的数据集。
在 Biorplot 中,我封装了 Bior_BarPlot() 函数来实现柱状图的绘制。
基础柱状图
绘制一个基础的柱状图如下:

绘图代码:
df <- data.frame(
  x = c("A", "B", "C"),
  y = c(3, 2, 1))
Bior_BarPlot(df, "x", "y", fill = "steelblue", color = "steelblue")
堆叠柱状图
绘制堆叠柱状图并添加文本标签:
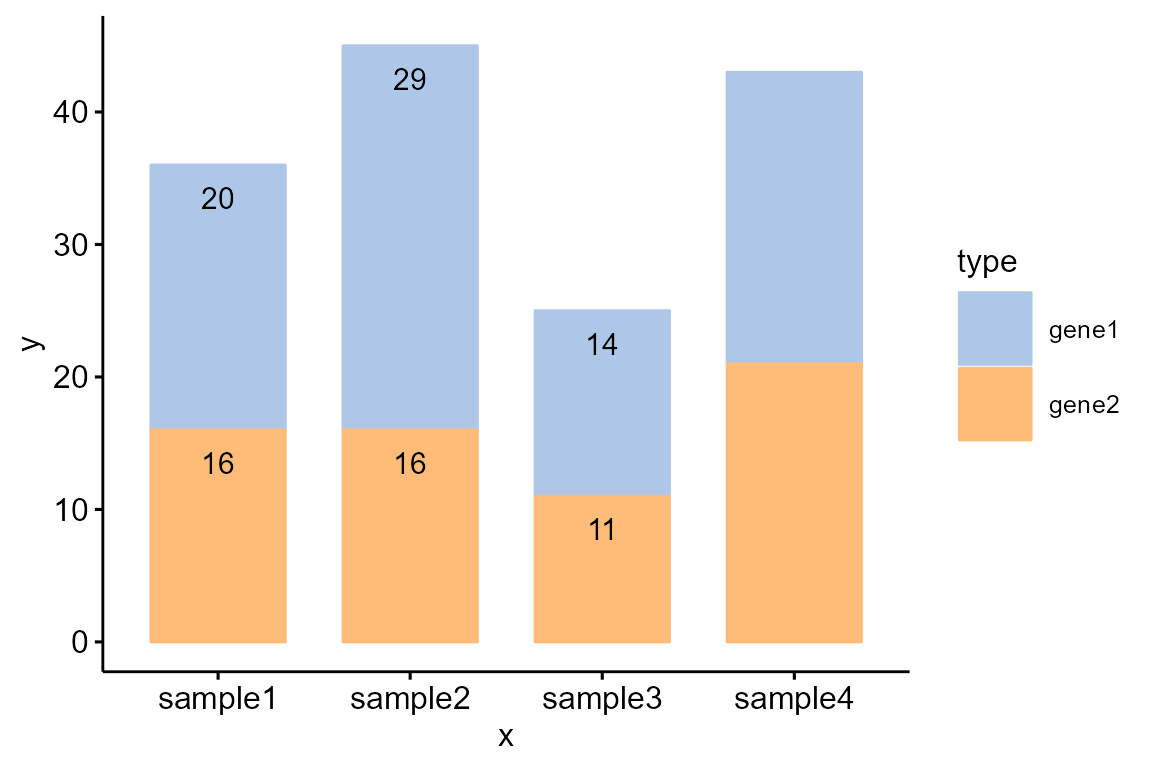
df <- data.frame(
  x = rep(c('sample1','sample2','sample3','sample4'), each=2),
  y = c(20,16,29,16,14,11,22,21),
  type = rep(c('gene1','gene2'), 4),
  label = c(20,16,29,16,14,11,"","")
)
col <- c("#AEC7E8FF","#FFBB78FF")
Bior_BarPlot(df, "x", "y", fill = "type", color = "type", label = df$label,
                  palette = col, lab.pos = "in") +
  theme(legend.position = "right", legend.key.size=unit(1, "cm"))
改变 position 绘制交错柱状图:
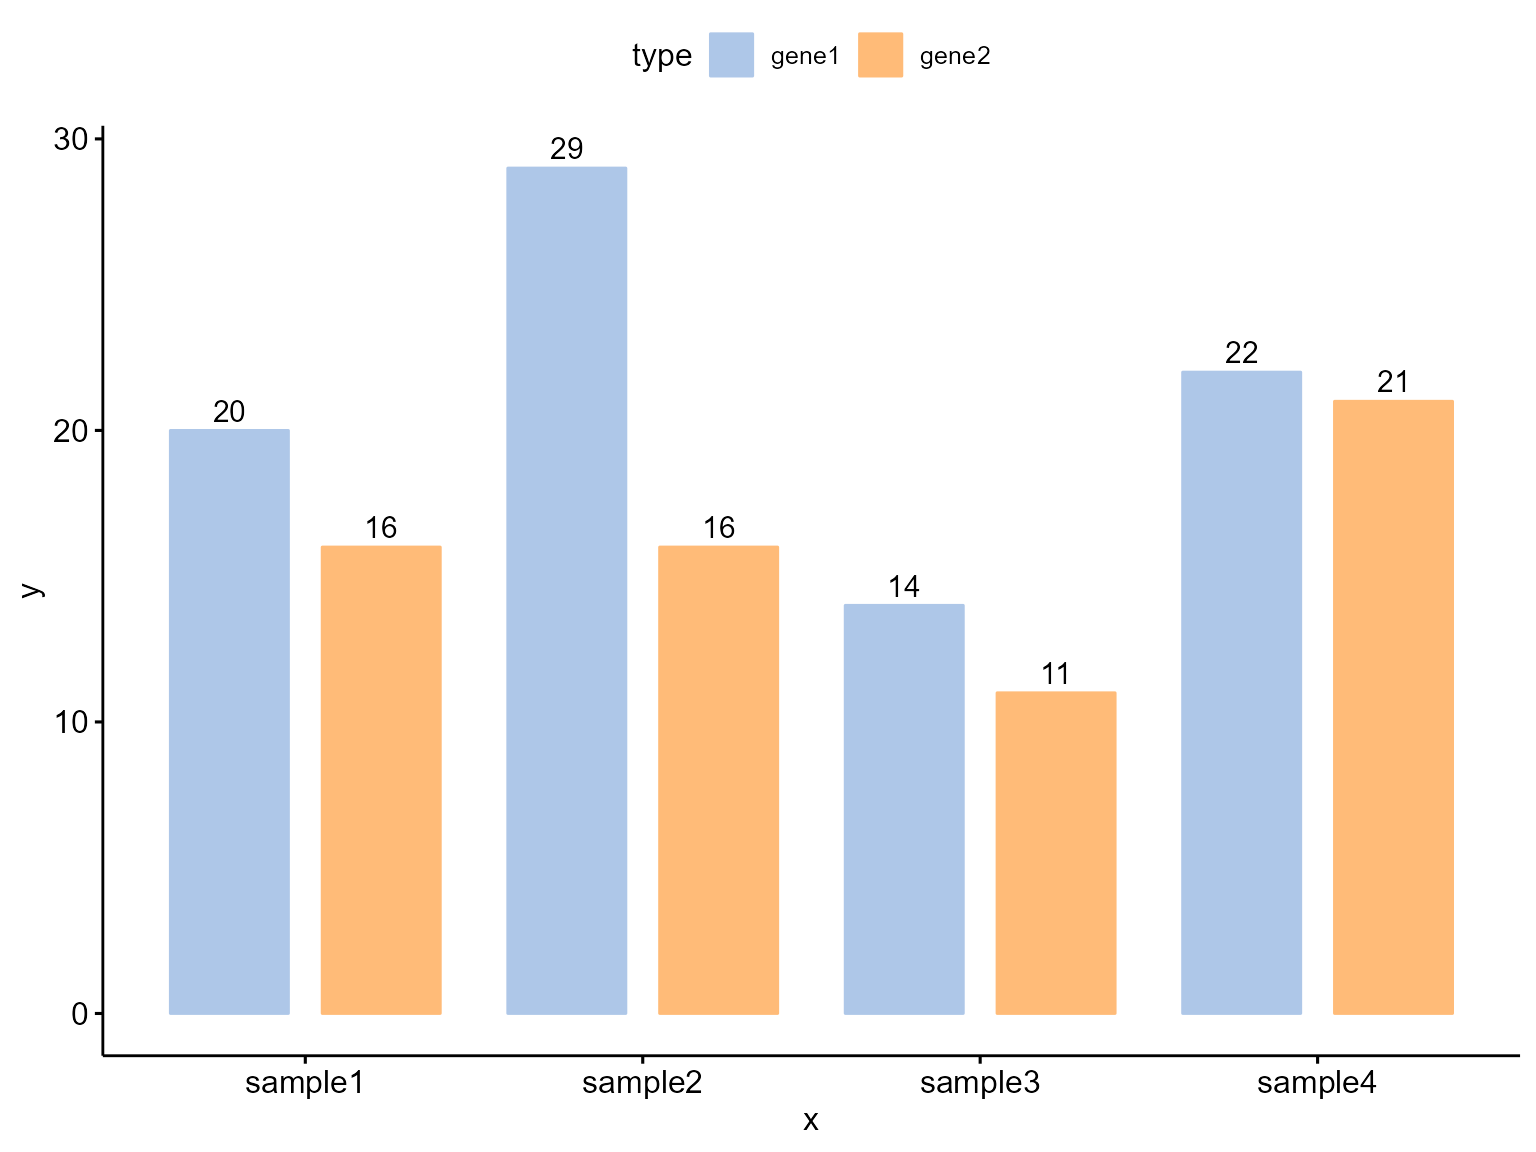
Bior_BarPlot(df, "x", "y", fill = "type", color = "type", palette = col,
                  label = TRUE, position = position_dodge(0.9))
源码解析
Biorplot::Bior_LinePlot() 函数主要继承了 *ggpubr::ggbarplot()*函数。
源码:
#%%%%%%%%%%%%%%%%%%%%%%%%%%%%%%%%%%%%%%%%%%%%%%%%%%%%%%%%%%%%%%%%%%%%%%%%%%%%%%%

#' Bar plot
#' @description Create a stacked barplot.
#'
#' @importFrom ggpubr ggbarplot position_stack() theme_pubr()
#' @import ggplot2
#'
#' @inheritParams ggpubr::ggbarplot
#'
#' @return A ggplot object
#' @export
#'
#' @examples
#' # Examples 1
#' df <- data.frame(
#' x = c("A", "B", "C"),
#' y = c(3, 2, 1))
#' Bior_BarPlot(df, "x", "y", fill = "steelblue", color = "steelblue")
#'
#' # Examples 2
#' df <- data.frame(
#'   x = rep(c('sample1','sample2','sample3','sample4'), each=2),
#'   y = c(20,16,29,16,14,11,22,21),
#'   type = rep(c('gene1','gene2'), 4),
#'   label = c(20,16,29,16,14,11,"","")
#'   )
#' col <- c("#AEC7E8FF","#FFBB78FF")
#' Bior_BarPlot(df, "x", "y", fill = "type", color = "type", label = df$label,
#'              palette = col, lab.pos = "in") +
#'   theme(legend.position = "right", legend.key.size=unit(1, "cm"))
#'
#' # Examples 3
#' Bior_BarPlot(df, "x", "y", fill = "type", color = "type", palette = col,
#'              label = TRUE, position = position_dodge(0.9))
#'
Bior_BarPlot <- function(data, x, y, combine = FALSE, merge = FALSE,
                              color = "black", fill = "white", palette = NULL,
                              size = NULL, width = NULL,
                              title = NULL, xlab = NULL, ylab = NULL,
                              facet.by = NULL, panel.labs = NULL, short.panel.labs = TRUE,
                              select = NULL, remove = NULL, order = NULL,
                              add = "none", add.params = list(), error.plot = "errorbar",
                              label = FALSE, lab.col = "black", lab.size = 4,
                              lab.pos = c("out", "in"), lab.vjust = NULL, lab.hjust = NULL,
                              lab.nb.digits = NULL,
                              sort.val = c("none", "desc", "asc"), sort.by.groups = TRUE,
                              top = Inf,
                              position = position_stack(),
                              ggtheme = theme_pubr(),
                              ...)
{
  # Default options
  .opts <- list(
    data = data, x = x, y = y, combine = combine, merge = merge,
    color = color, fill = fill, palette = palette,
    size = size, width = width,
    title = title, xlab = xlab, ylab = ylab,
    facet.by = facet.by, panel.labs = panel.labs, short.panel.labs = short.panel.labs,
    select = select , remove = remove, order = order,
    add = add, add.params = add.params, error.plot = error.plot,
    label = label, lab.col = lab.col, lab.size = lab.size,
    lab.pos = lab.pos, lab.vjust = lab.vjust, lab.hjust = lab.hjust,
    lab.nb.digits = lab.nb.digits,
    sort.val = sort.val, sort.by.groups = sort.by.groups, top = top,
    position = position, ggtheme = ggtheme, ...)

  p <- do.call(ggpubr::ggbarplot, .opts)

  return(p)
}

#%%%%%%%%%%%%%%%%%%%%%%%%%%%%%%%%%%%%%%%%%%%%%%%%%%%%%%%%%%%%%%%%%%%%%%%%%%%%%%%
注:本文为个人学习笔记,仅供大家参考学习,不得用于任何商业目的。如有侵权,请联系作者删除。

本文由 mdnice 多平台发布


 被折叠的 条评论
为什么被折叠?
被折叠的 条评论
为什么被折叠?
 到【灌水乐园】发言


