


利用FormatStrFormatter 进行设置
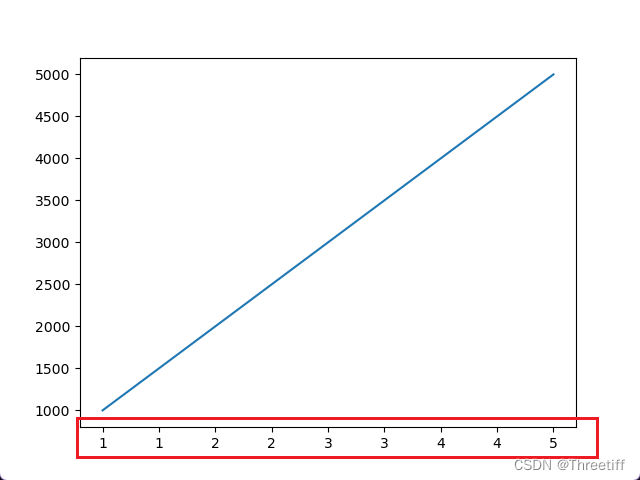
1 设置为整数
import matplotlib.pyplot as plt
from matplotlib.ticker import FormatStrFormatter

# 创建一个图表
fig, ax = plt.subplots()

# 生成一些示例数据
x = [1, 2, 3, 4, 5]
y = [1000, 2000, 3000, 4000, 5000]

# 在 x 轴上设置刻度标签格式化器为整数格式
ax.xaxis.set_major_formatter(FormatStrFormatter('%d'))

# 绘制数据
ax.plot(x, y)

# 显示图表
plt.show()
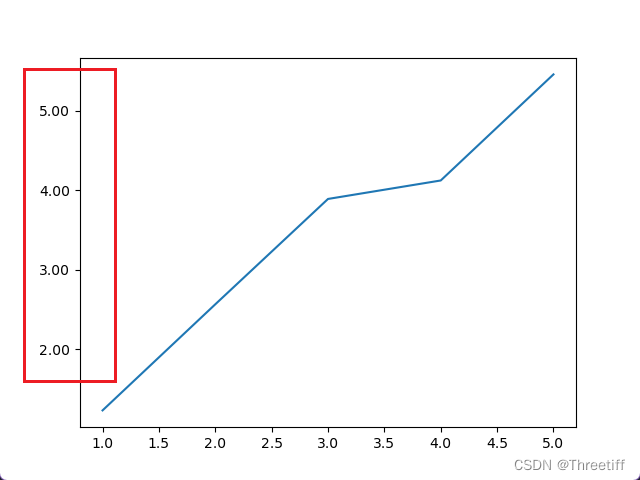
2 设置为小数【控制小数点的数目】
import matplotlib.pyplot as plt
from matplotlib.ticker import FormatStrFormatter

# 创建一个图表
fig, ax = plt.subplots()

# 生成一些示例数据
x = [1, 2, 3, 4, 5]
y = [1.234, 2.567, 3.891, 4.123, 5.456]

# 在 y 轴上设置刻度标签格式化器为两位小数
ax.yaxis.set_major_formatter(FormatStrFormatter('%.2f'))

# 绘制数据
ax.plot(x, y)

# 显示图表
plt.show()


 5472
5472


 被折叠的 条评论
为什么被折叠?
被折叠的 条评论
为什么被折叠?
 到【灌水乐园】发言


