


地理信息网站
Eatrth Explorer操作界面
在研究中,我们常需要遥感数据。在下面的网站中,可以得到遥感数据。
EarthExplorer (usgs.gov)![]() https://earthexplorer.usgs.gov/登陆网站:
https://earthexplorer.usgs.gov/登陆网站:
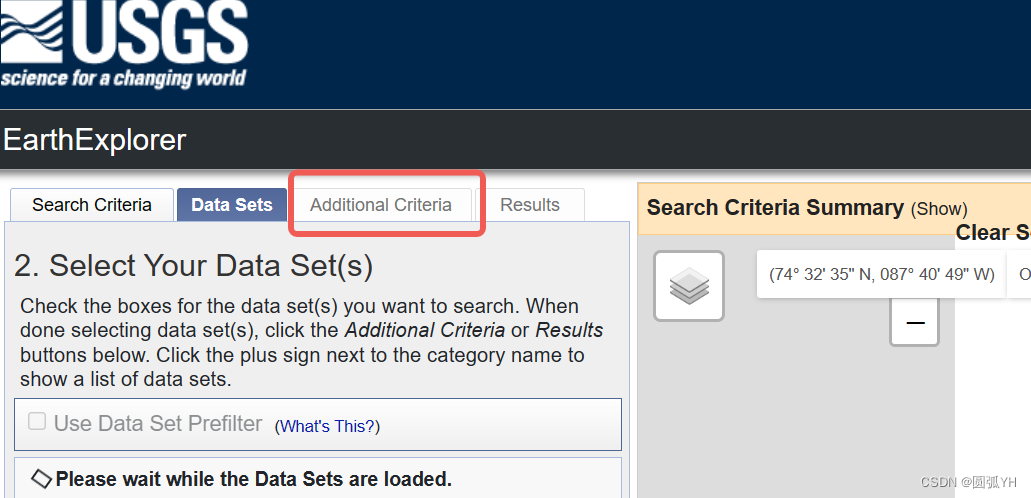
通常,在Additional Criteria中,可以下载遥感数据。
不过,这个似乎选择不了,也登录不上。
于是,需要选择用VPN 的方式科学上网。
Google Earth Engine操作界面
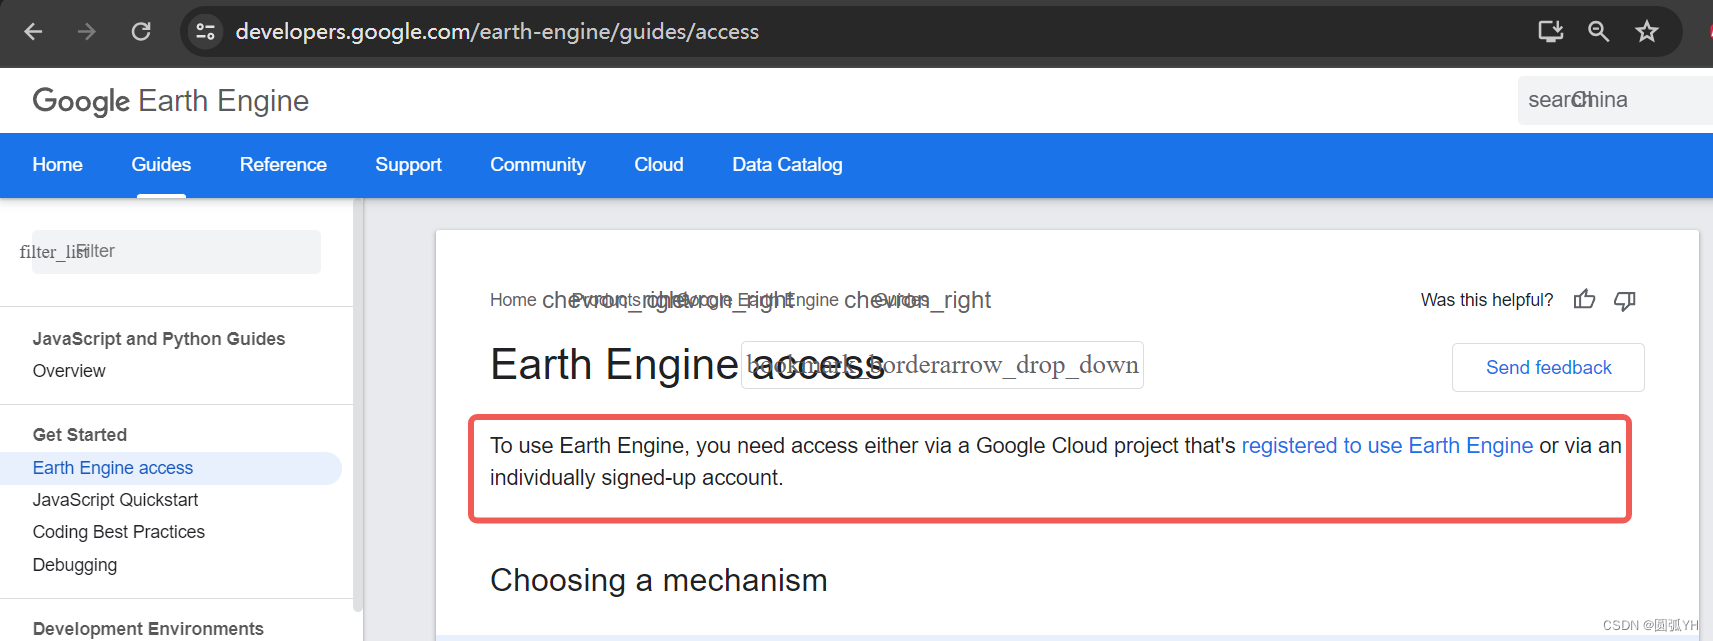
下面进入Google Earth Engine界面。
该网站(https://developers.google.com/earth-engine/guides/getstarted)是操作说明。
然后,需要注意,用谷歌账号登录。
Catalog界面的数据
GEE开发者界面
注册账号
会让你填写一个Sign Up
https://signup.earthengine.google.com/#!/![]() https://signup.earthengine.google.com/#!/
https://signup.earthengine.google.com/#!/

https://earthengine.google.com/noncommercial/![]() https://earthengine.google.com/noncommercial/
https://earthengine.google.com/noncommercial/
然后,注册完之后,提交信息。
注意,需要关闭浏览器插件ABP,因为有时候,插件会把弹出来的验证当作广告屏蔽掉,导致你看不到信息。
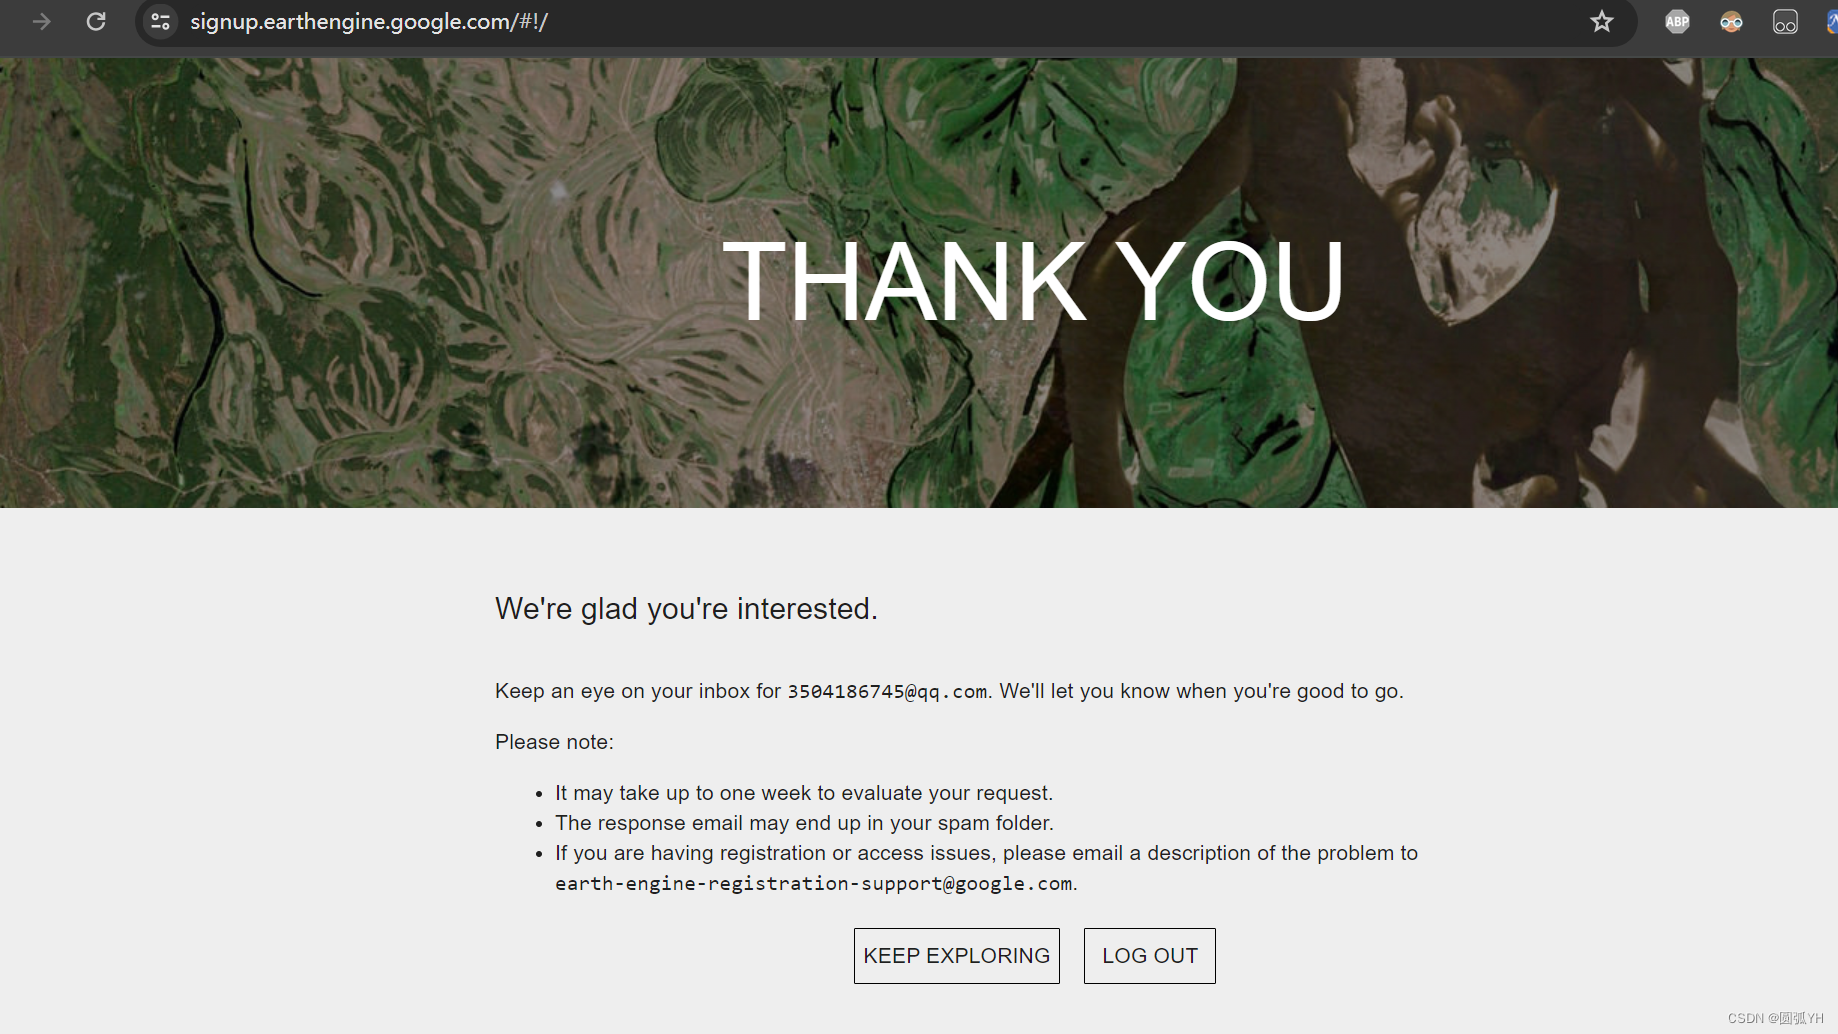
然后,会收到这样的信息:
We're glad you're interested.Keep an eye on your inbox for ……(注册邮箱). We'll let you know when you're good to go.
Please note:
- It may take up to one week to evaluate your request.
- The response email may end up in your spam folder.
- If you are having registration or access issues, please email a description of the problem to
earth-engine-registration-support@google.com.
他们会用一周时间来审核。并给你发邮件,以确认你的申请。
gallery界面
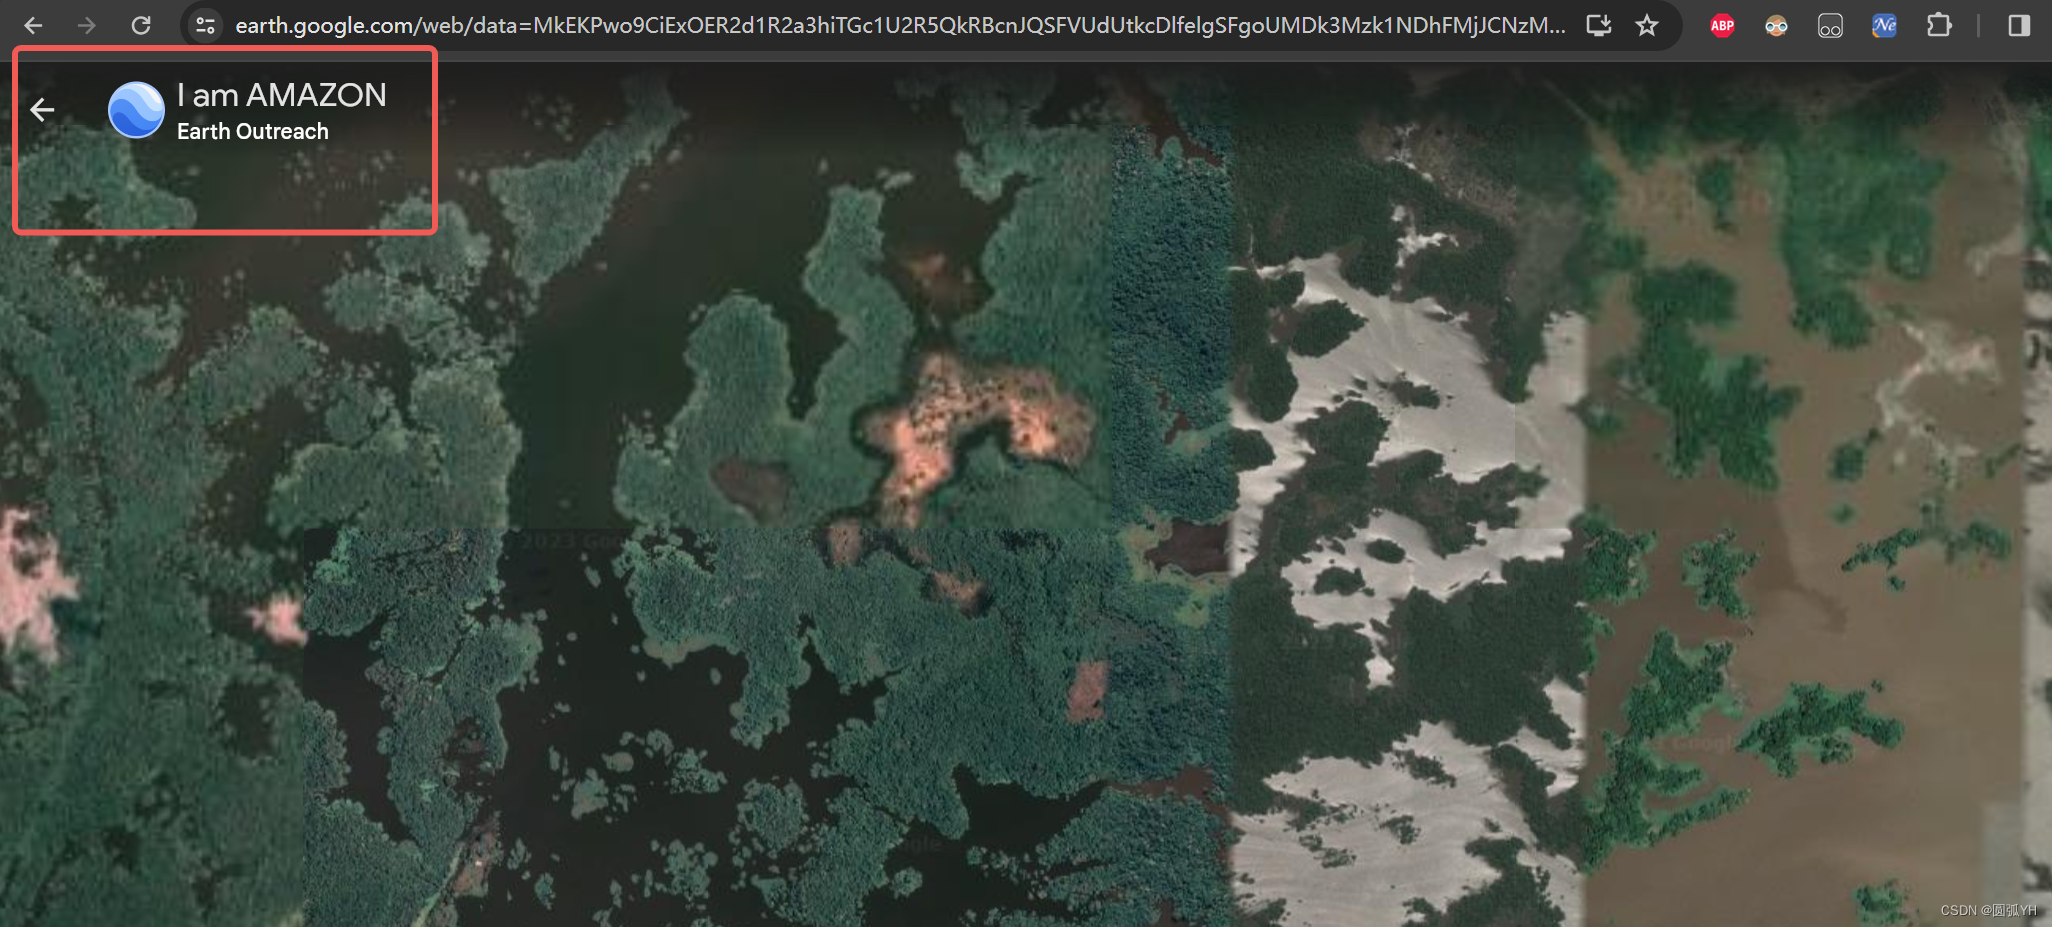
可以紧接着浏览谷歌地球的一些gallery。
https://www.google.com/earth/about/gallery/![]() https://www.google.com/earth/about/gallery/
https://www.google.com/earth/about/gallery/
可以在谷歌地球中打开来看。如鼠标点击亚马逊雨林地带下的“View in Earth”。进入如下界面:
然后,界面右下角,可以选择街景视图或者3D视图。
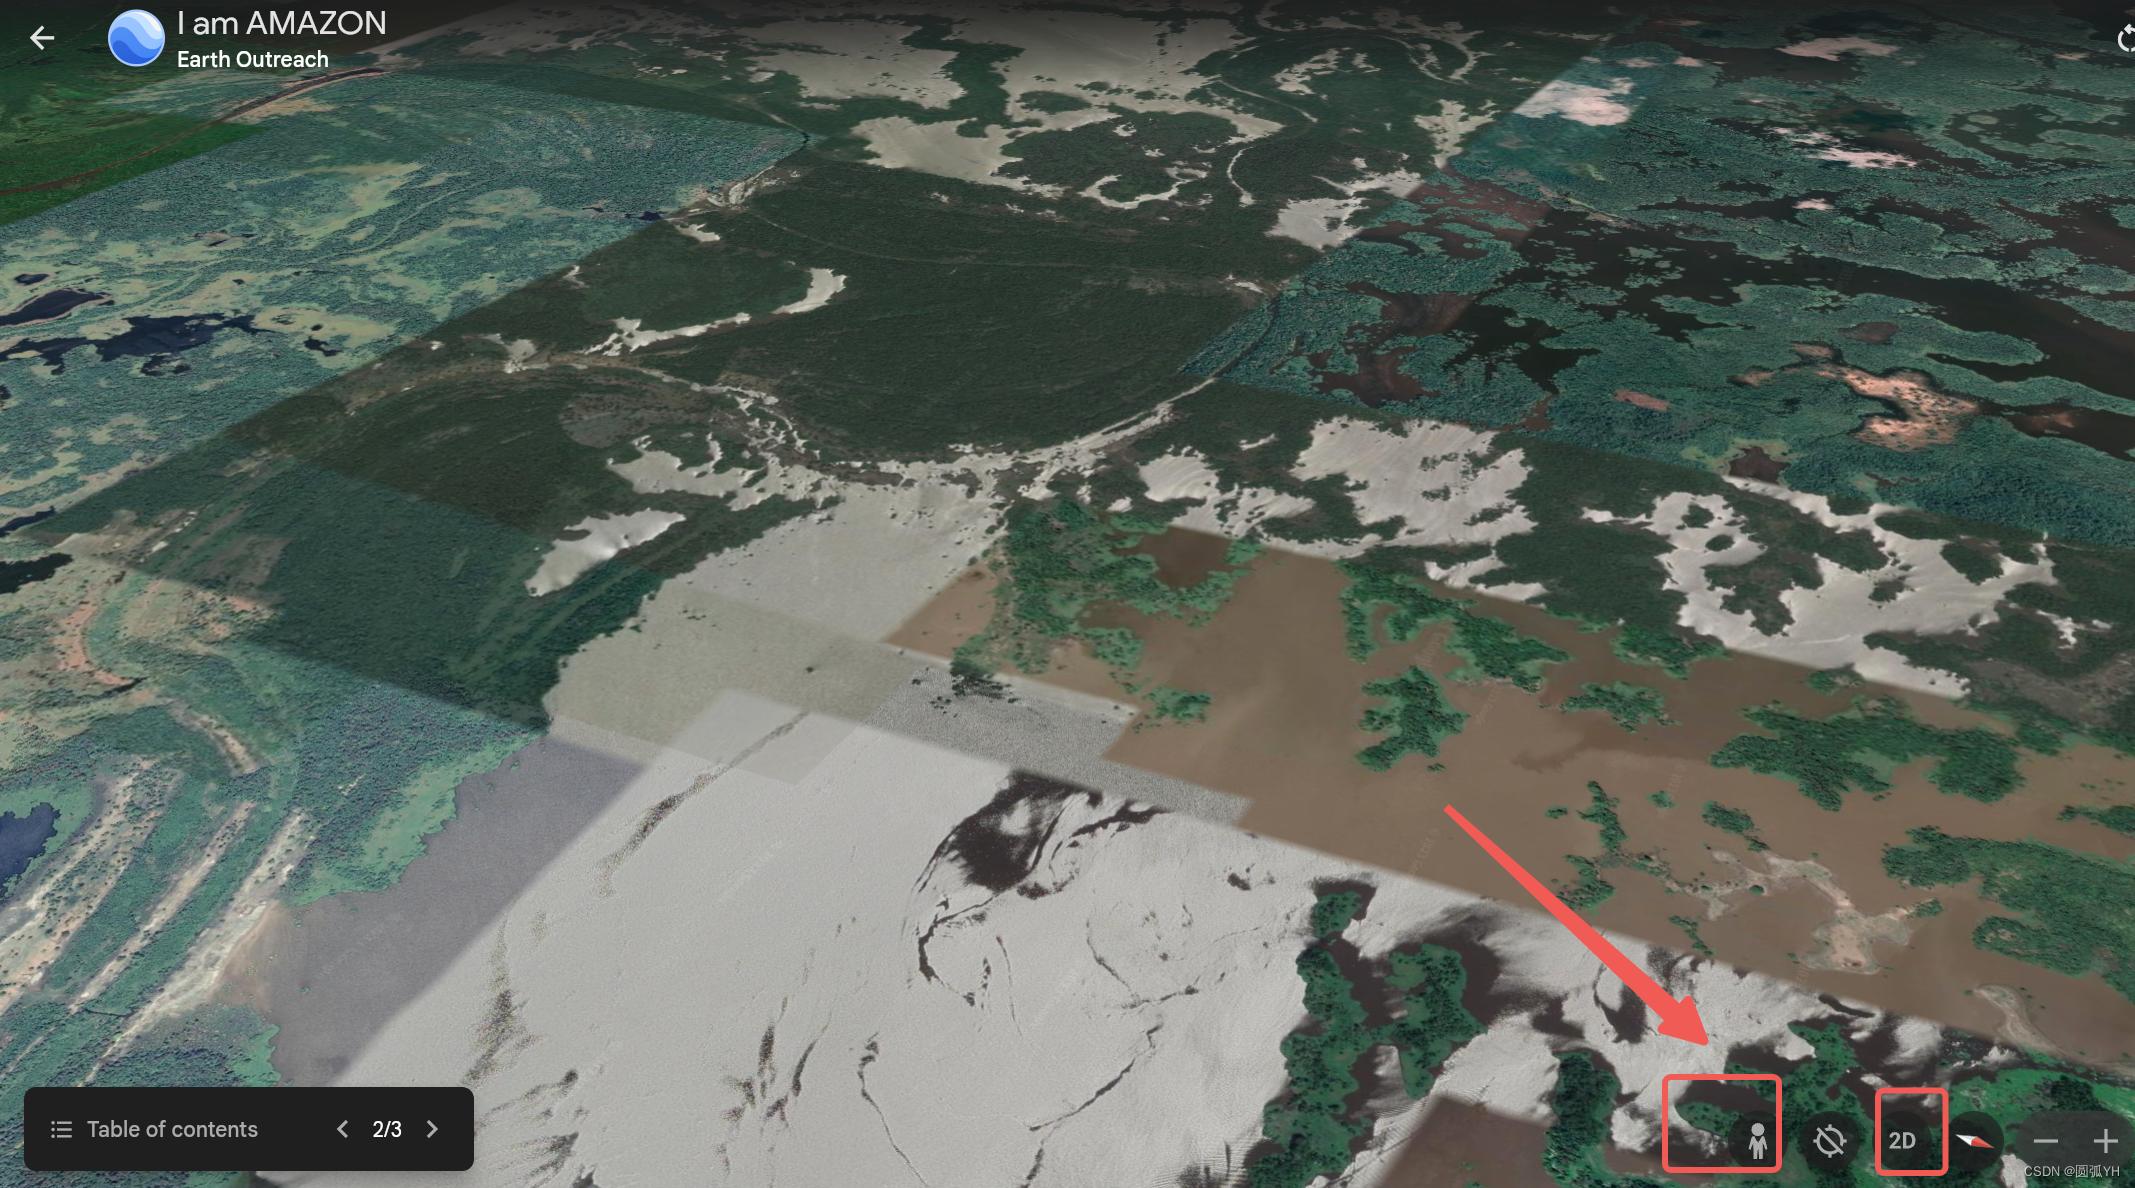
可以通过指南针,进行方向视角的调整。
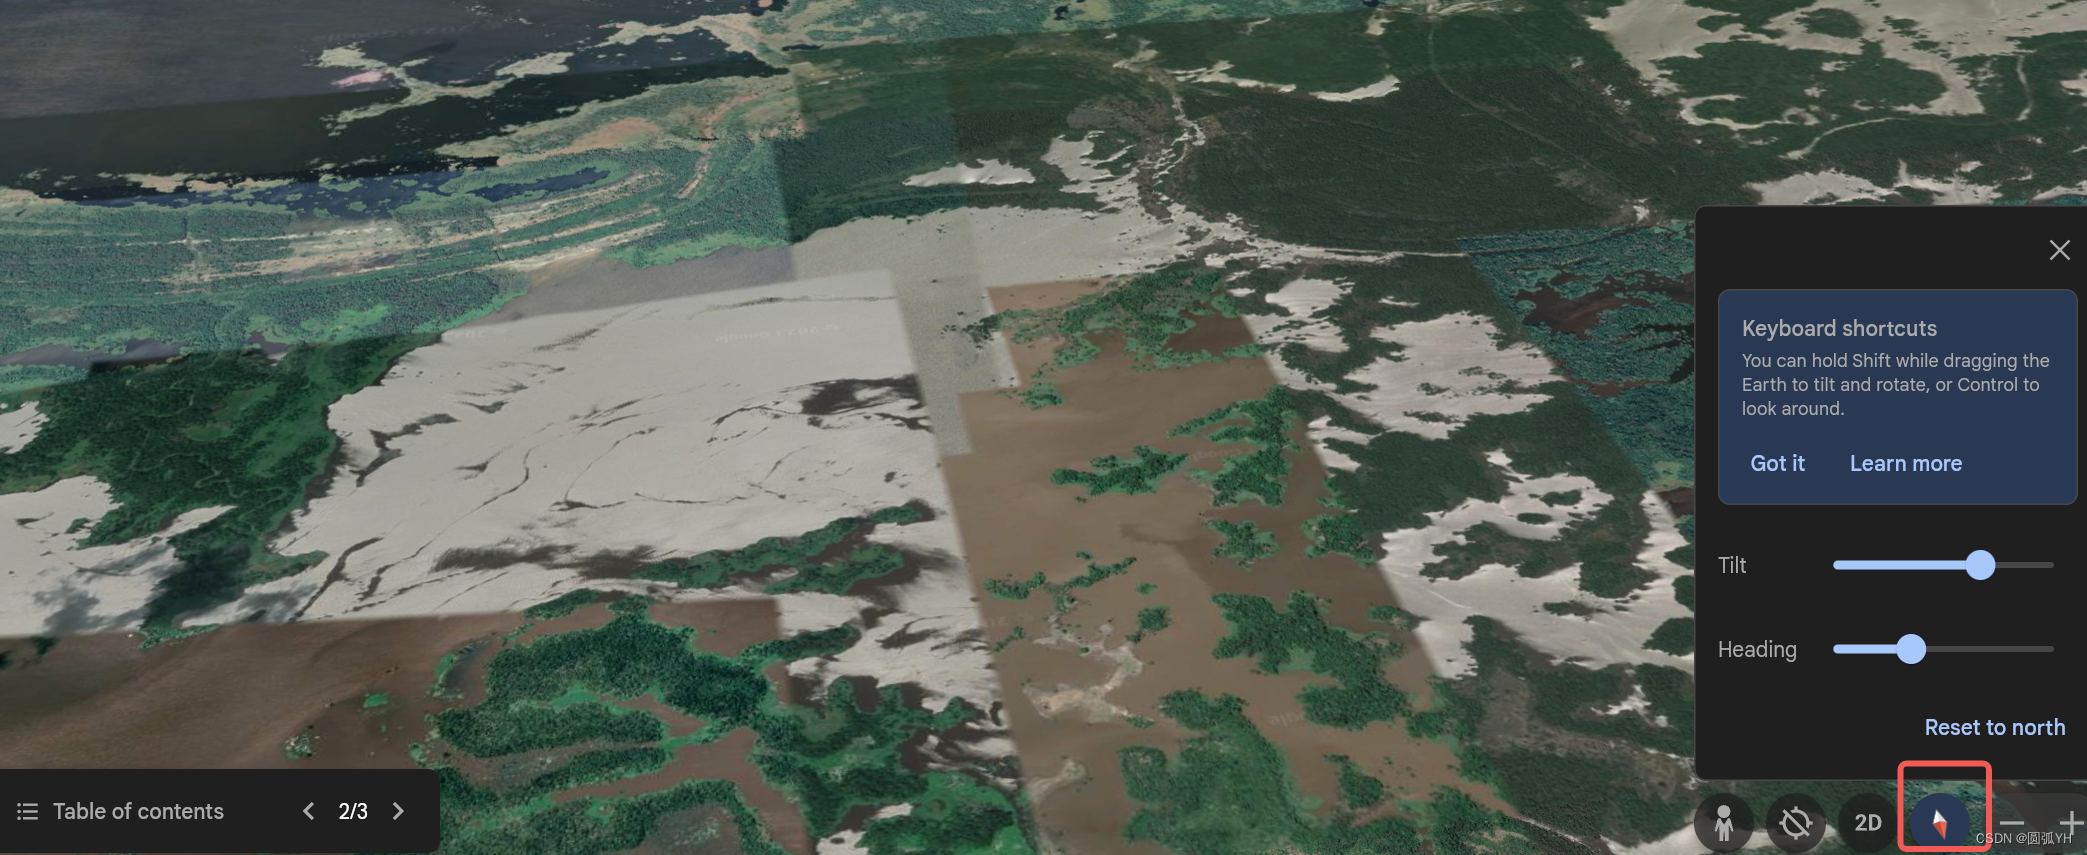
Gallery该处还有一个Timelapse,可以导向Google Earth.
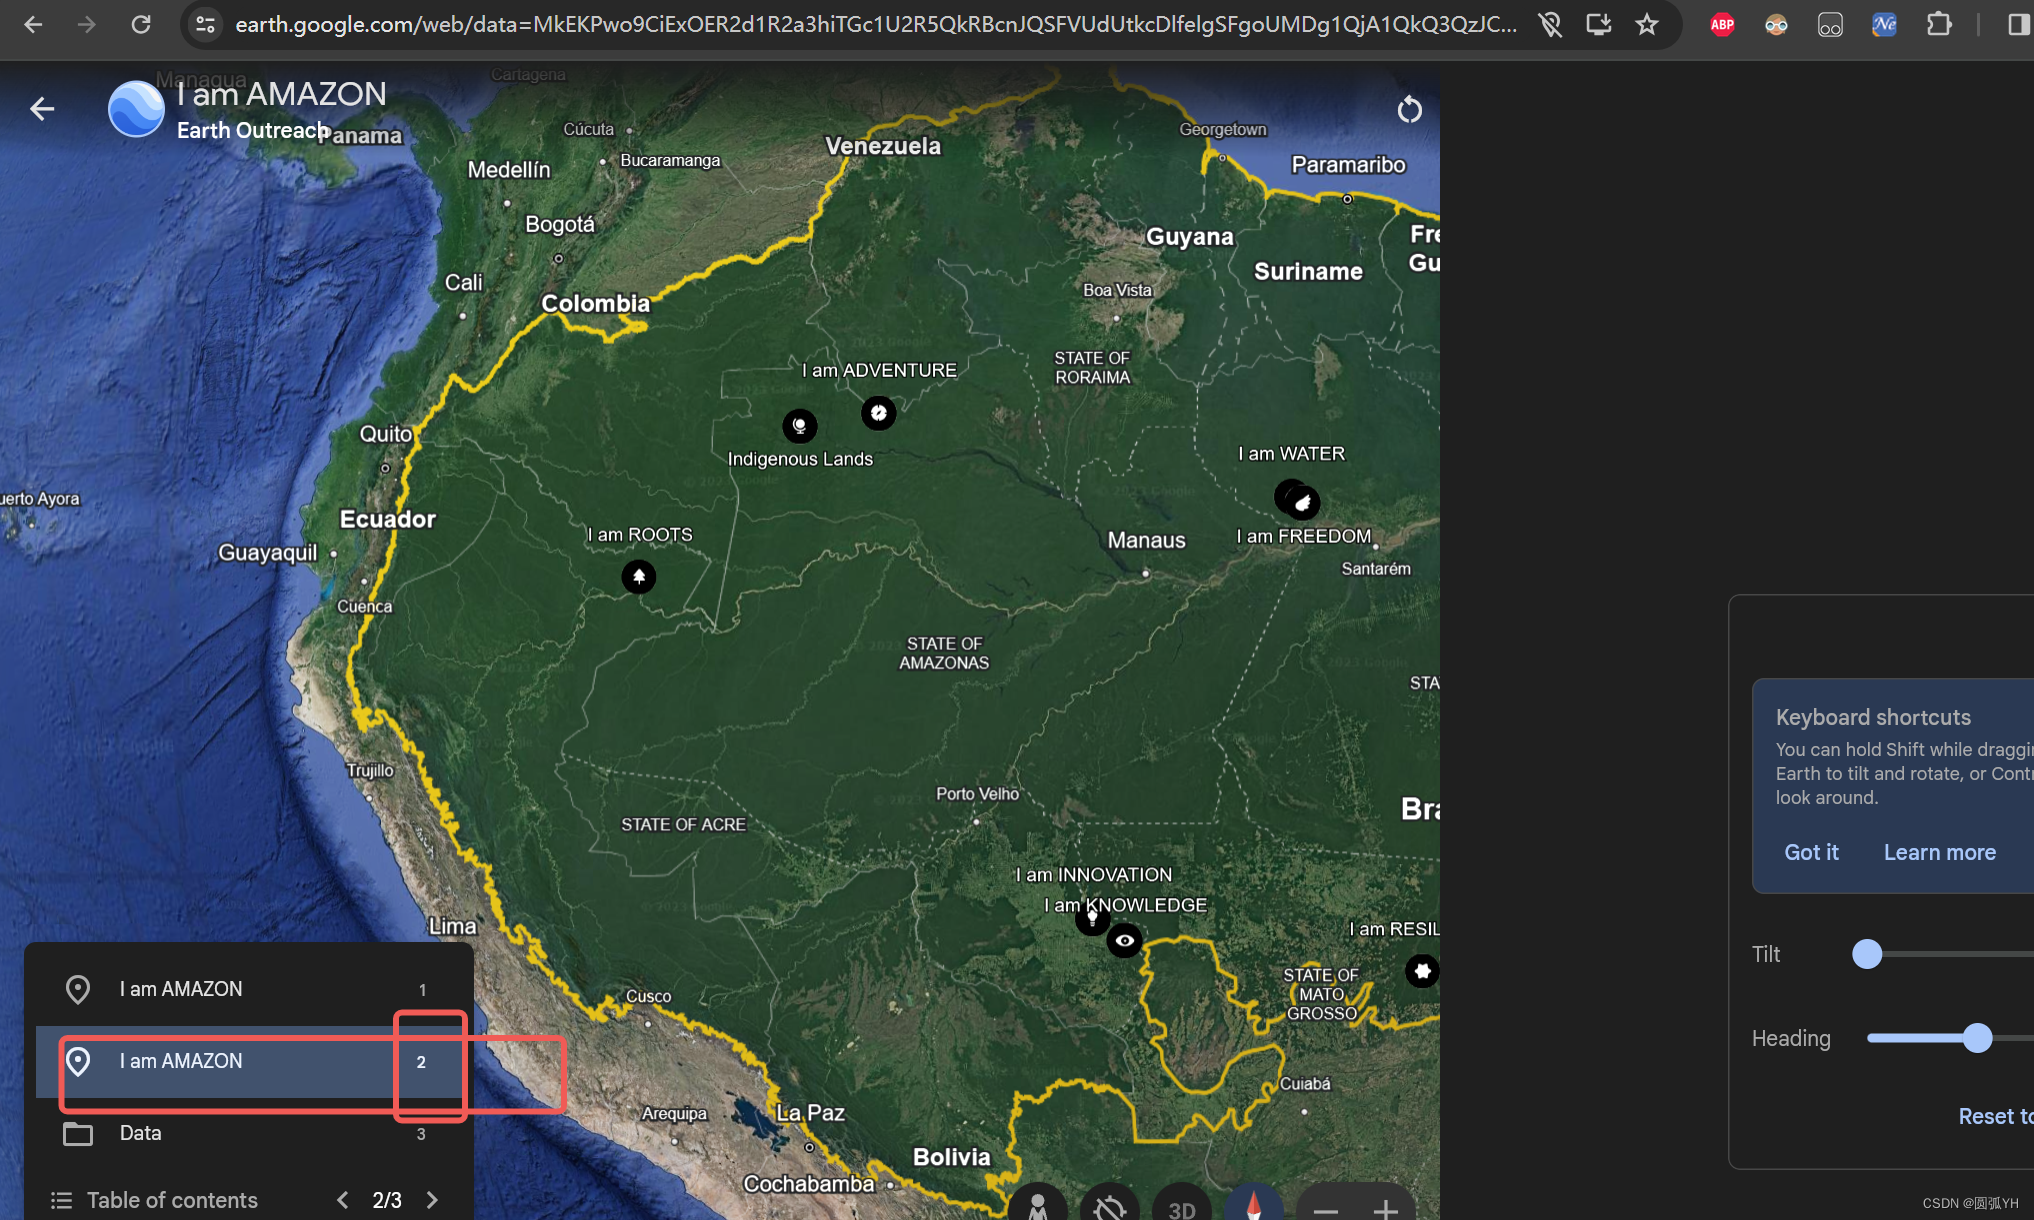
左下角,可以调整页面。
timelapse界面
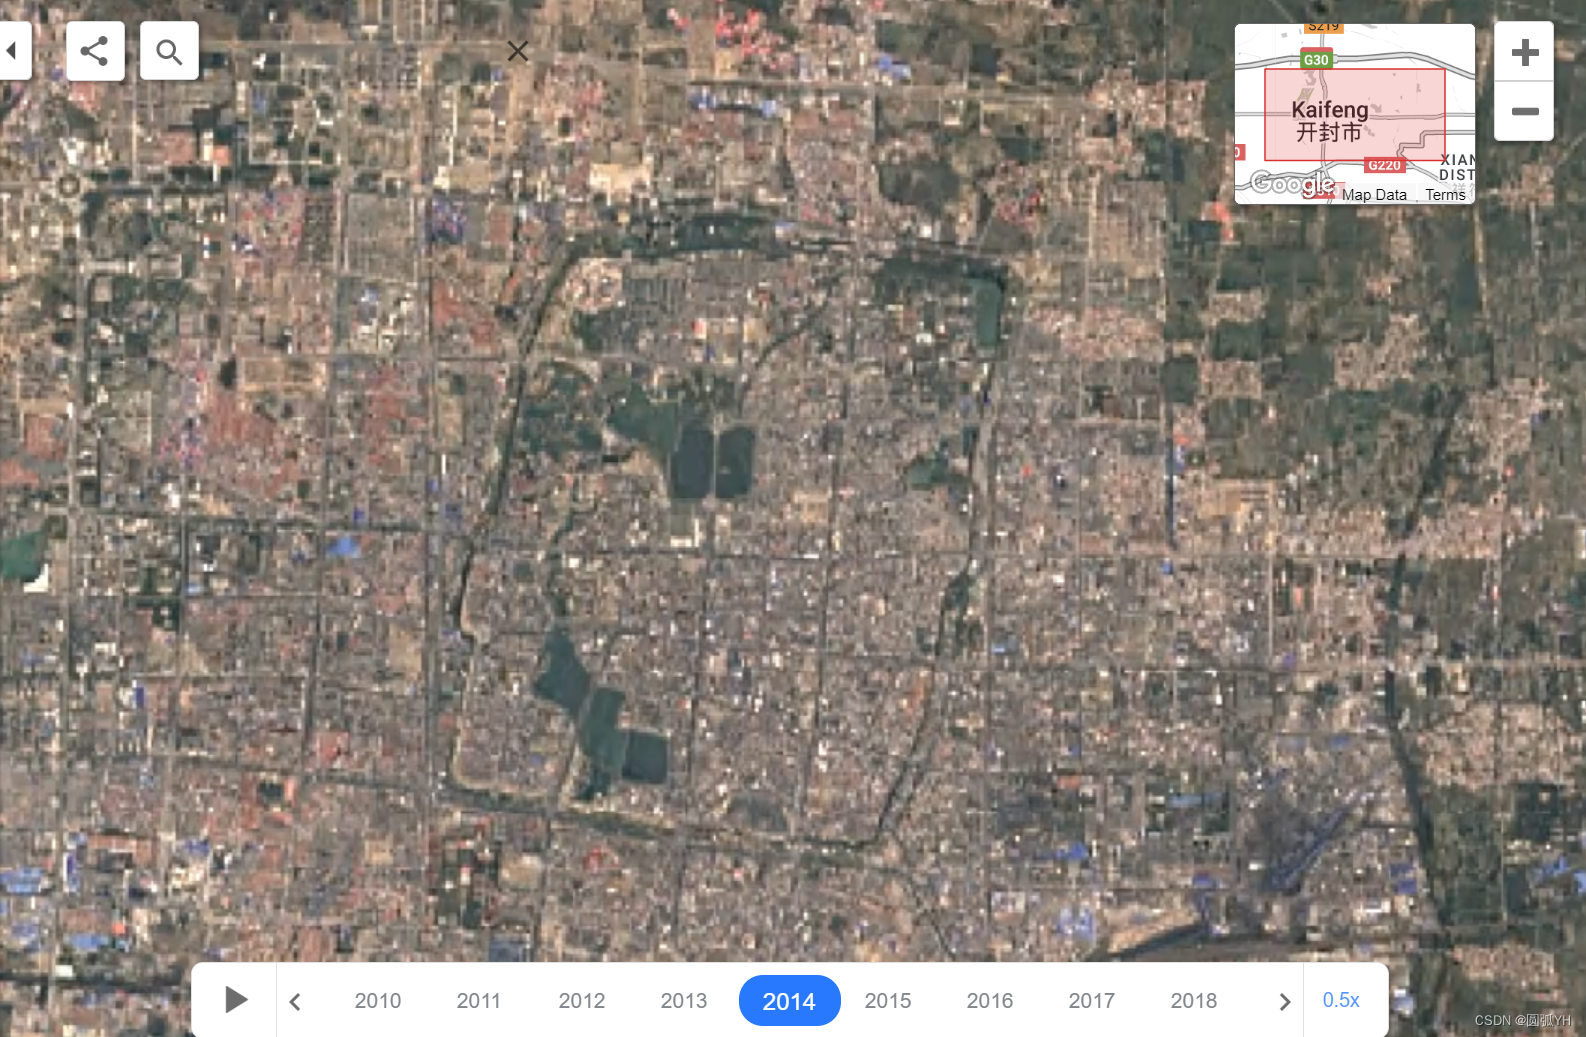
还可以进行时间序列的展示。如下图所示:
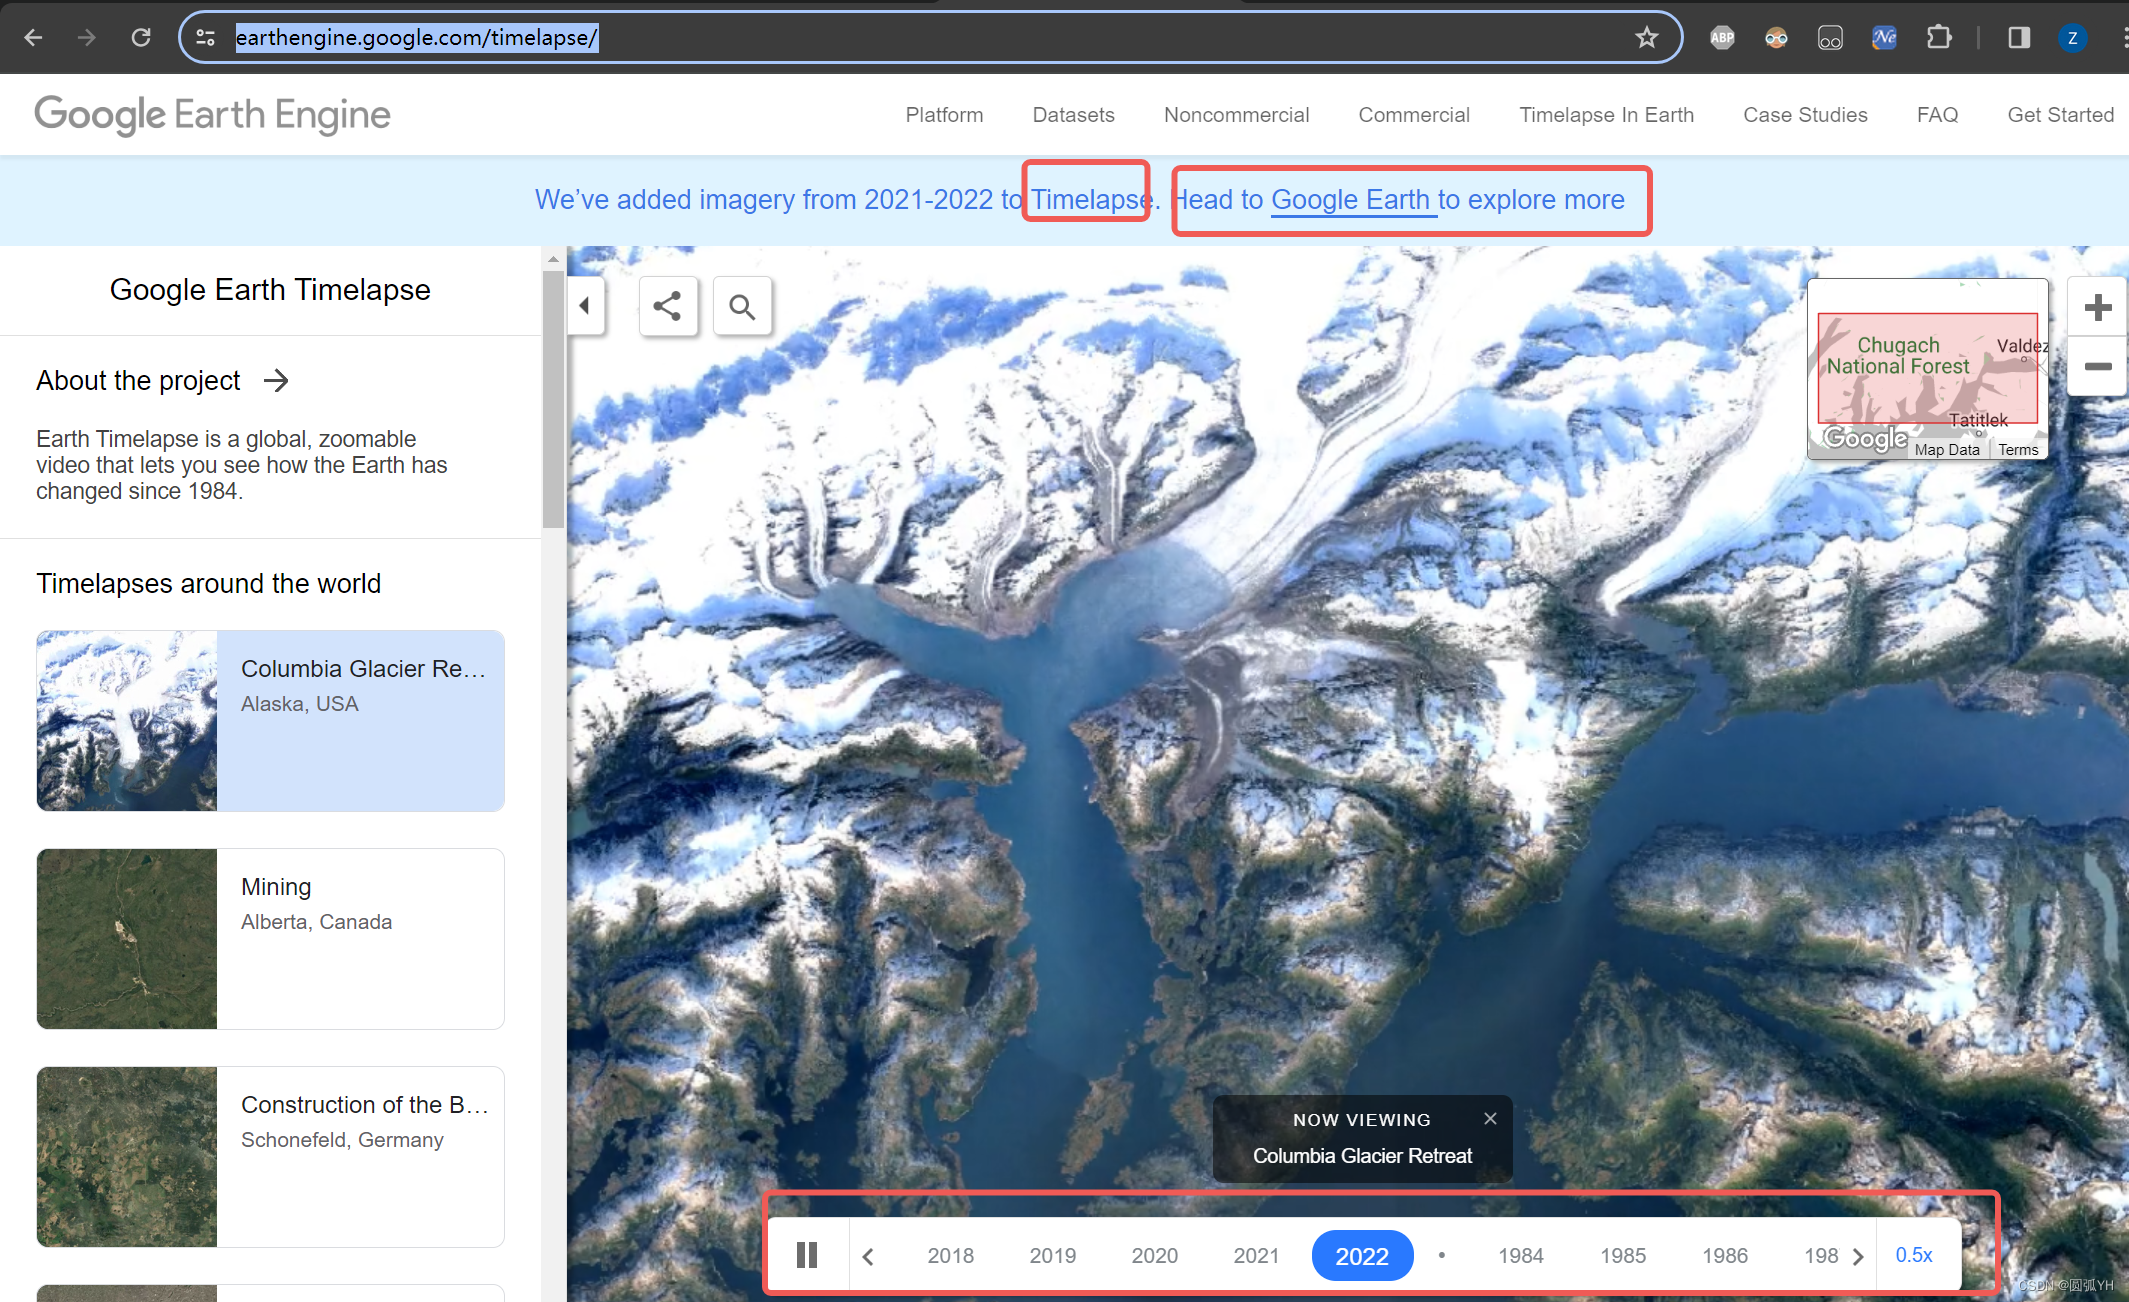
可以看到随着时间的变化,该地区相关的变化。
https://earthengine.google.com/timelapse/![]() https://earthengine.google.com/timelapse/可以选定某一个时间段和范围。
https://earthengine.google.com/timelapse/可以选定某一个时间段和范围。

如图所示,最早的是1984年的卫星数据。
移动鼠标,进入到谷歌地球中的中国开封一带区域。
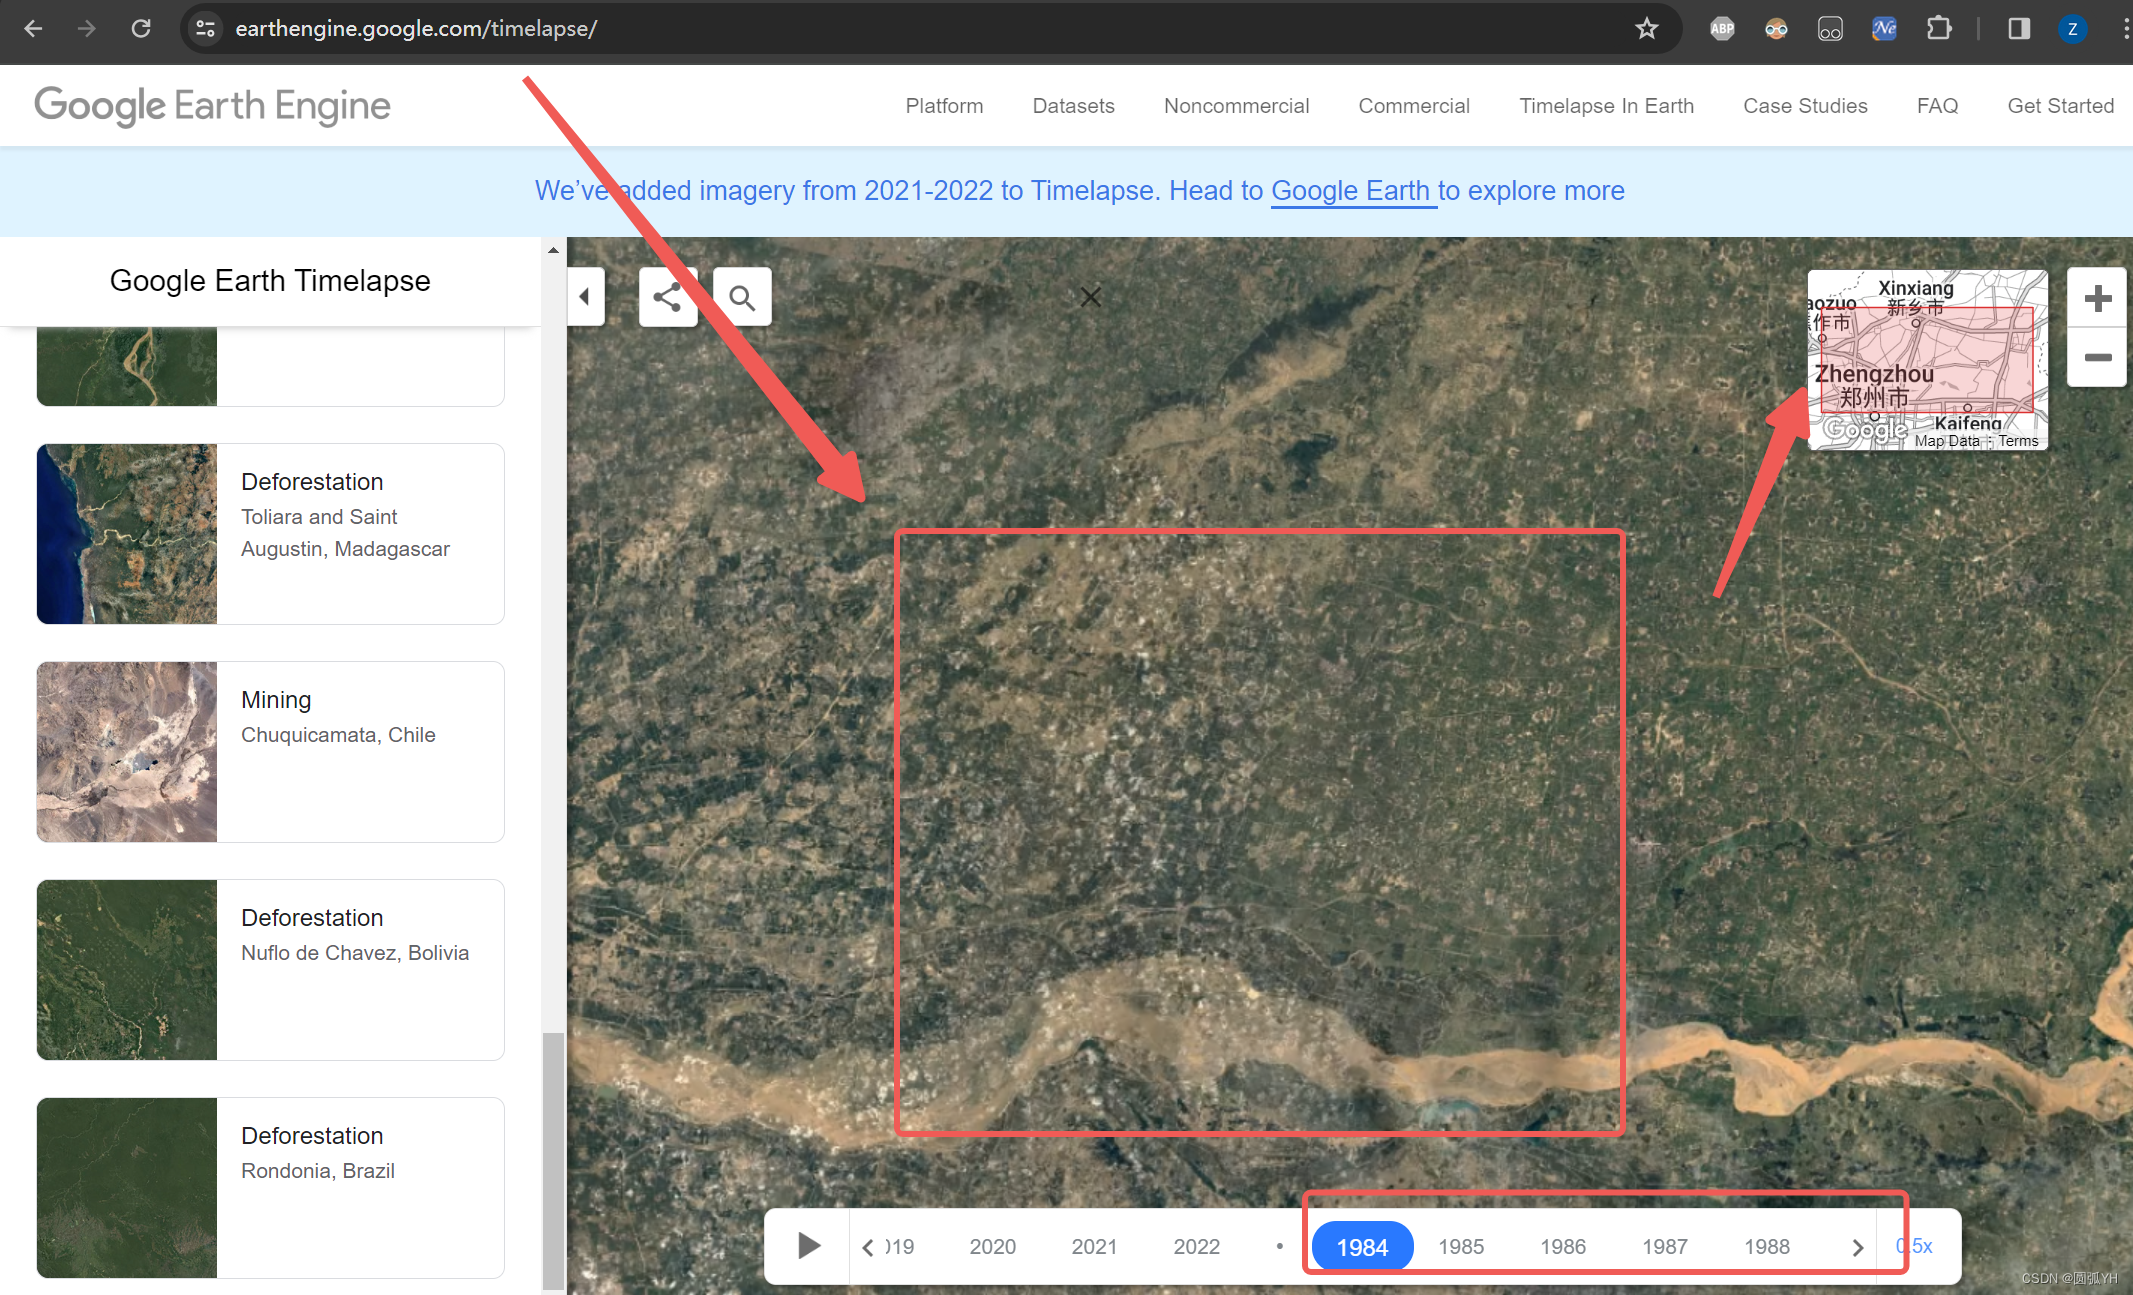
即可显示从1984年到2023年该地理区域的变化。
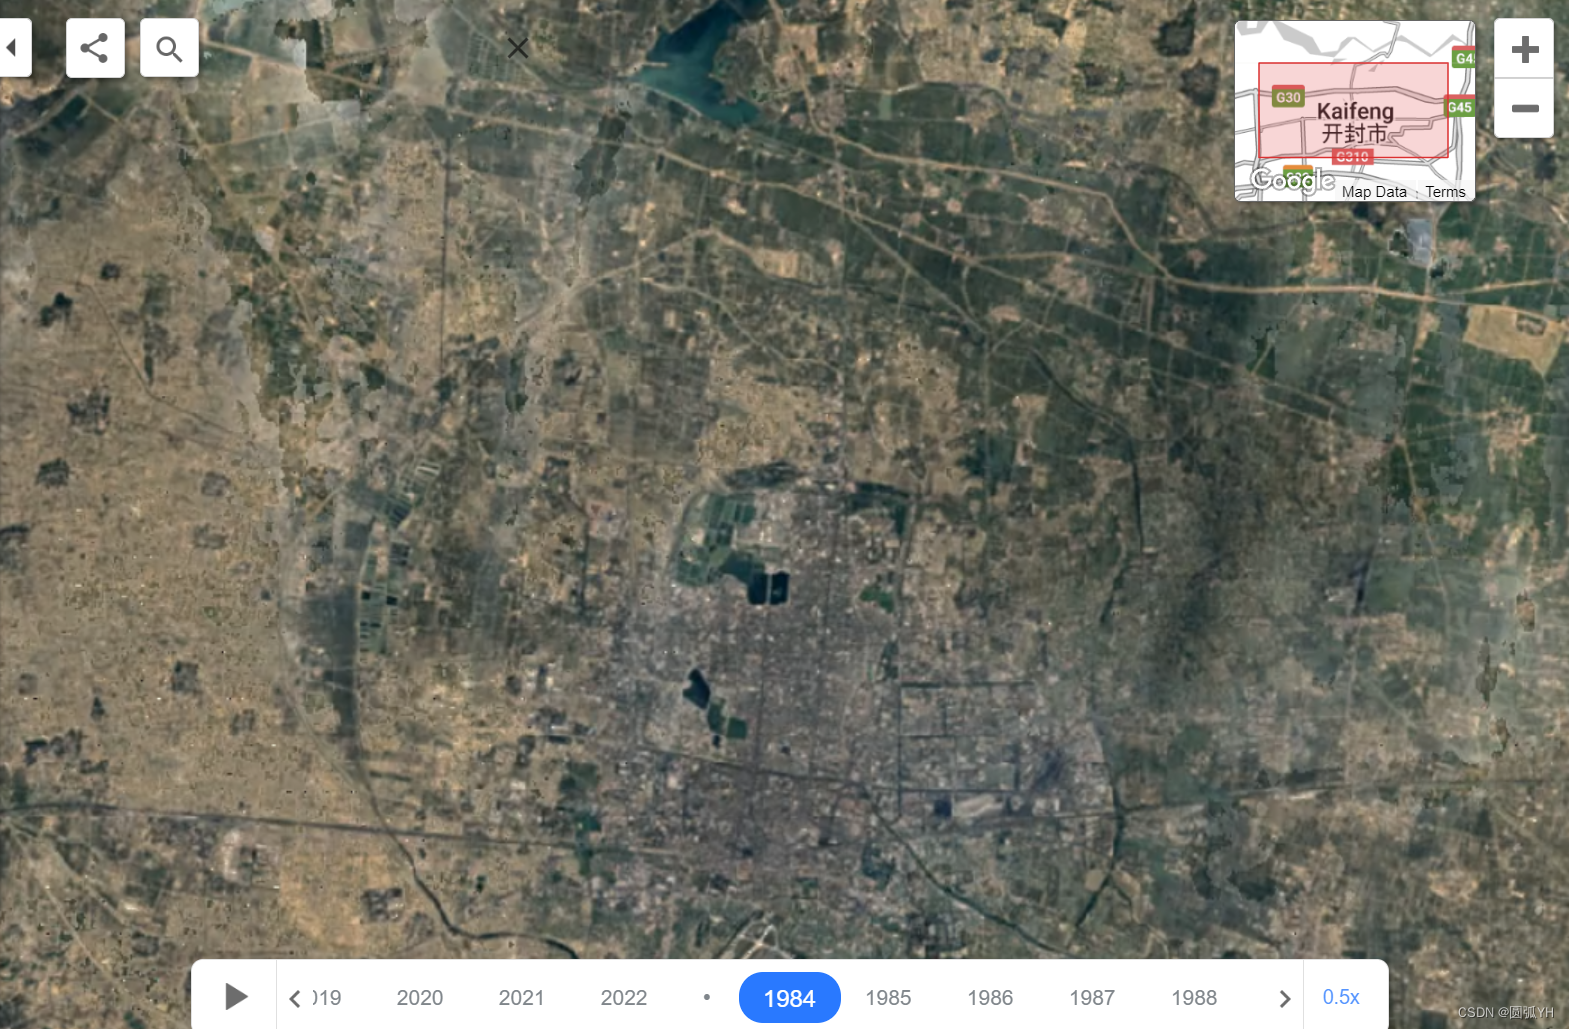
以开封城市为例:
1984年开封
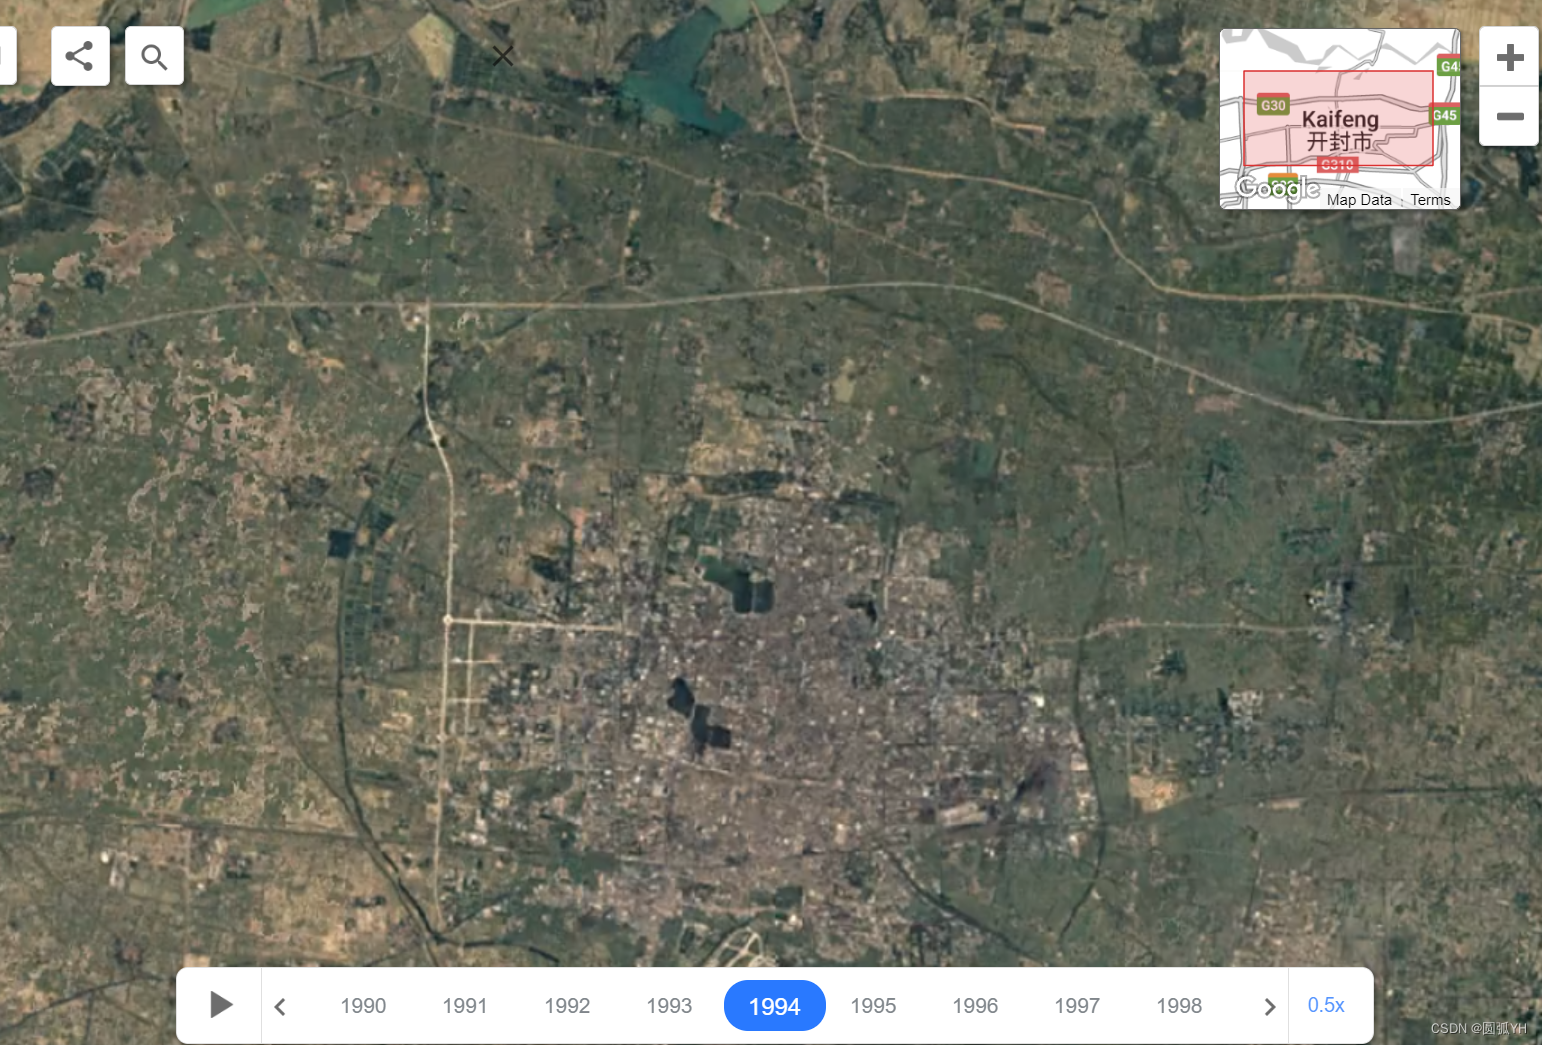
1994年开封
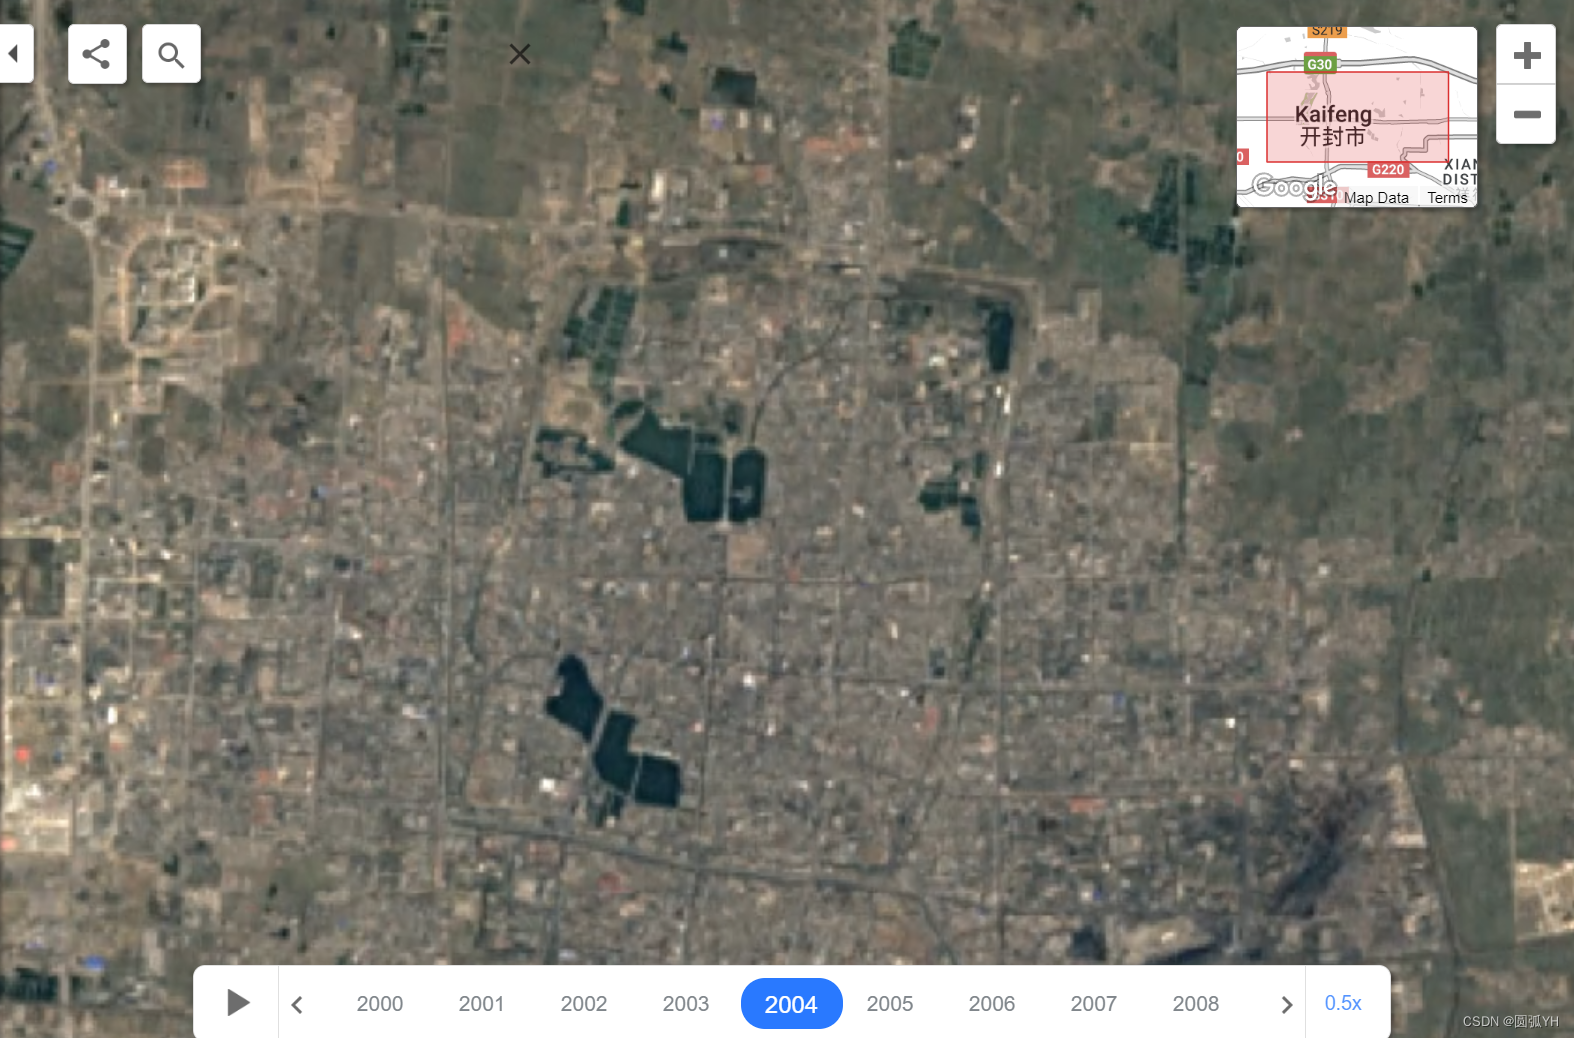
2004年开封
2014年开封
2022年开封
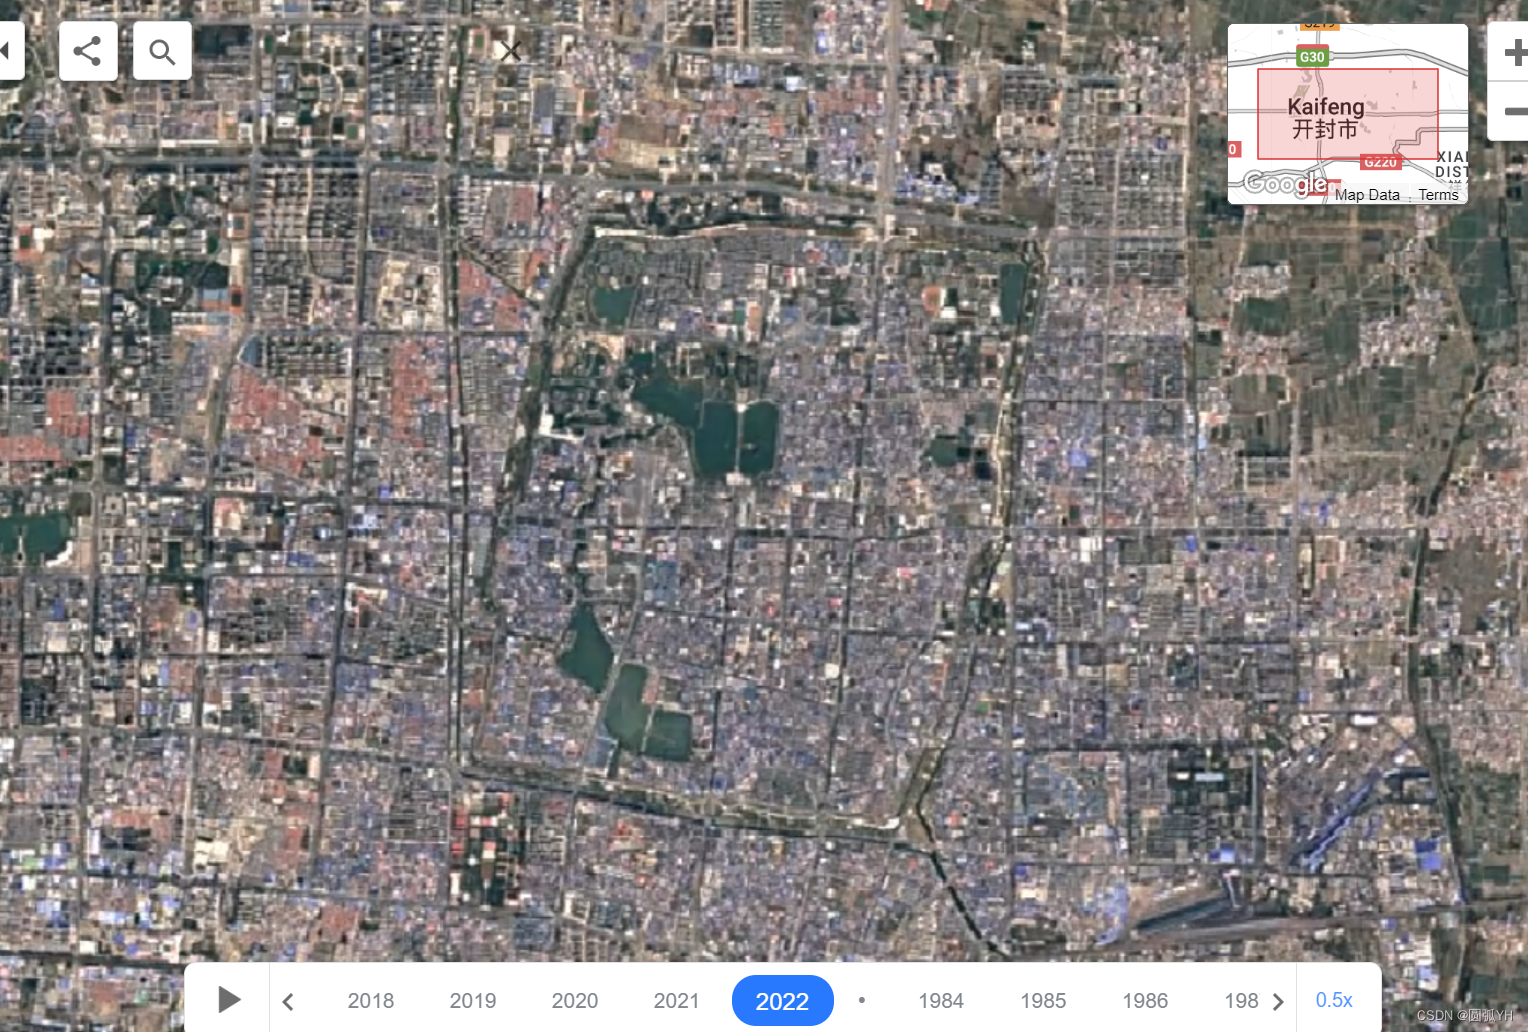
从而看到时间序列的变化。
GEE的Catalog界面
进入GEE的Catalog界面,可以看到有相关的地理数据。
又如,该页面提供了热带雨林的长时段变化。
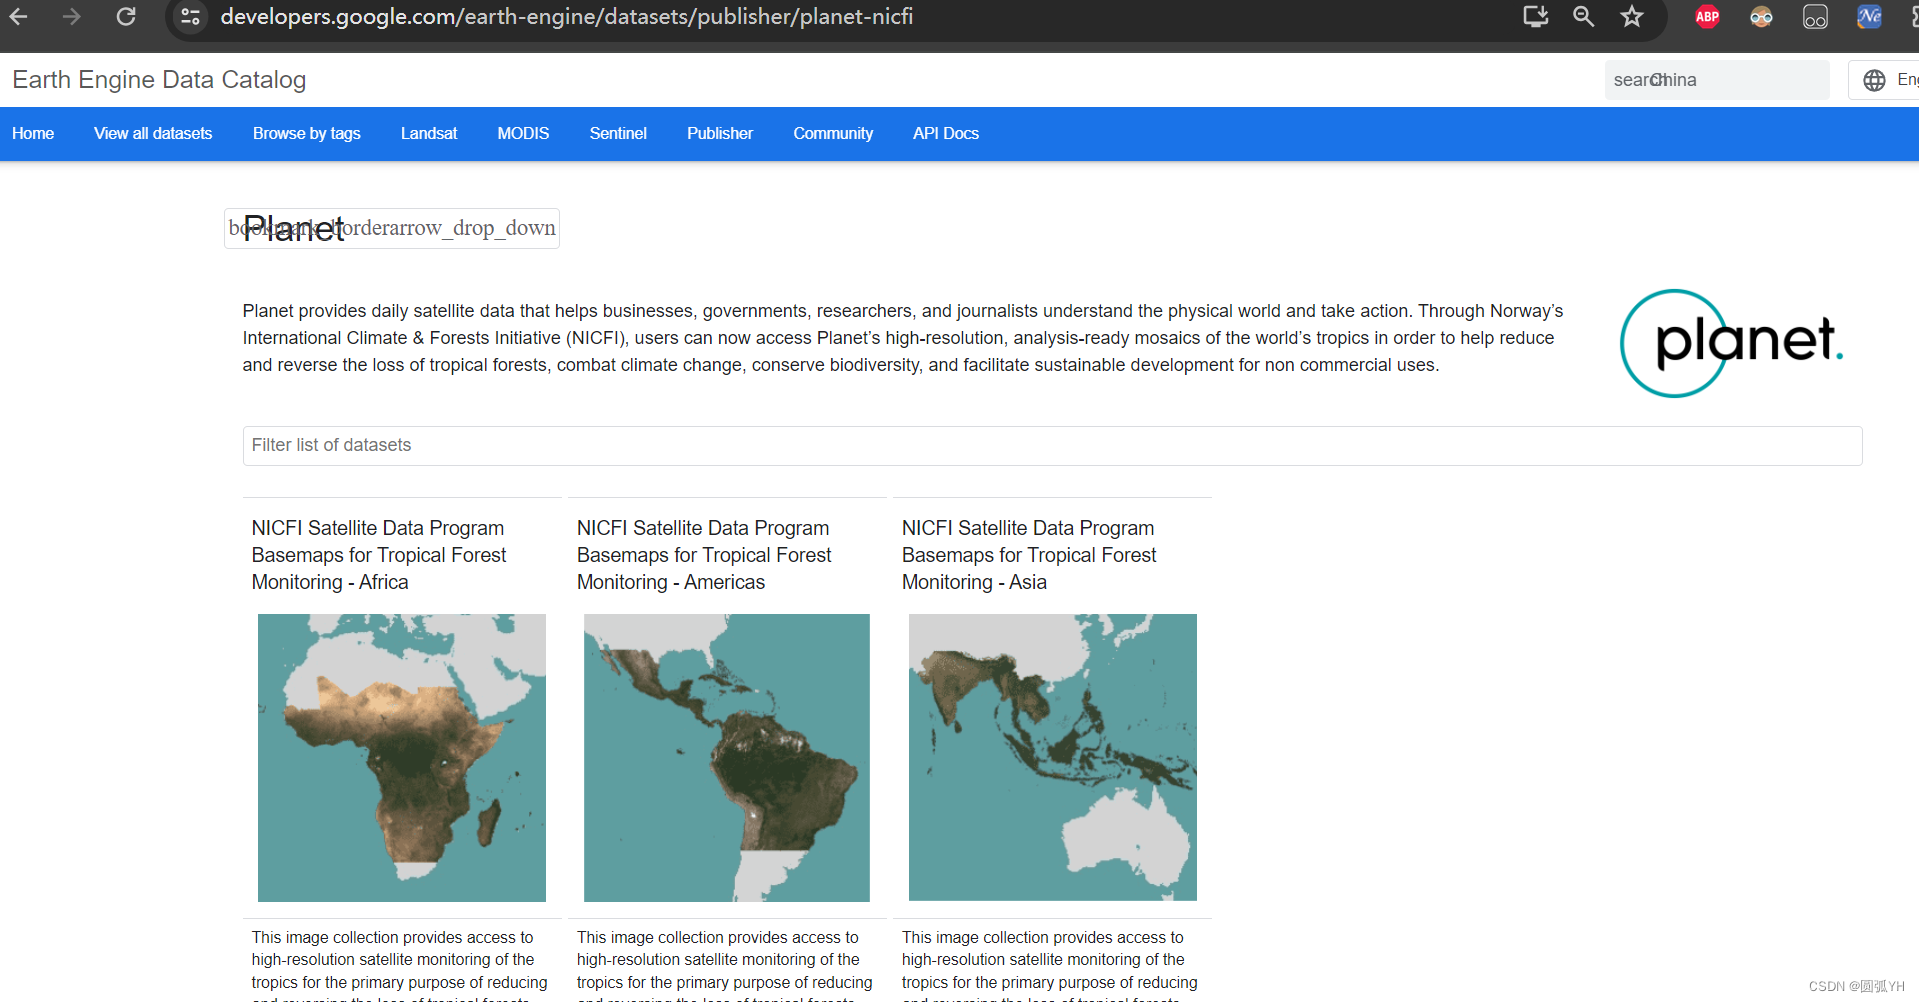
也有相关的爱好者组成的社区,围绕相关主题进行地理研究。
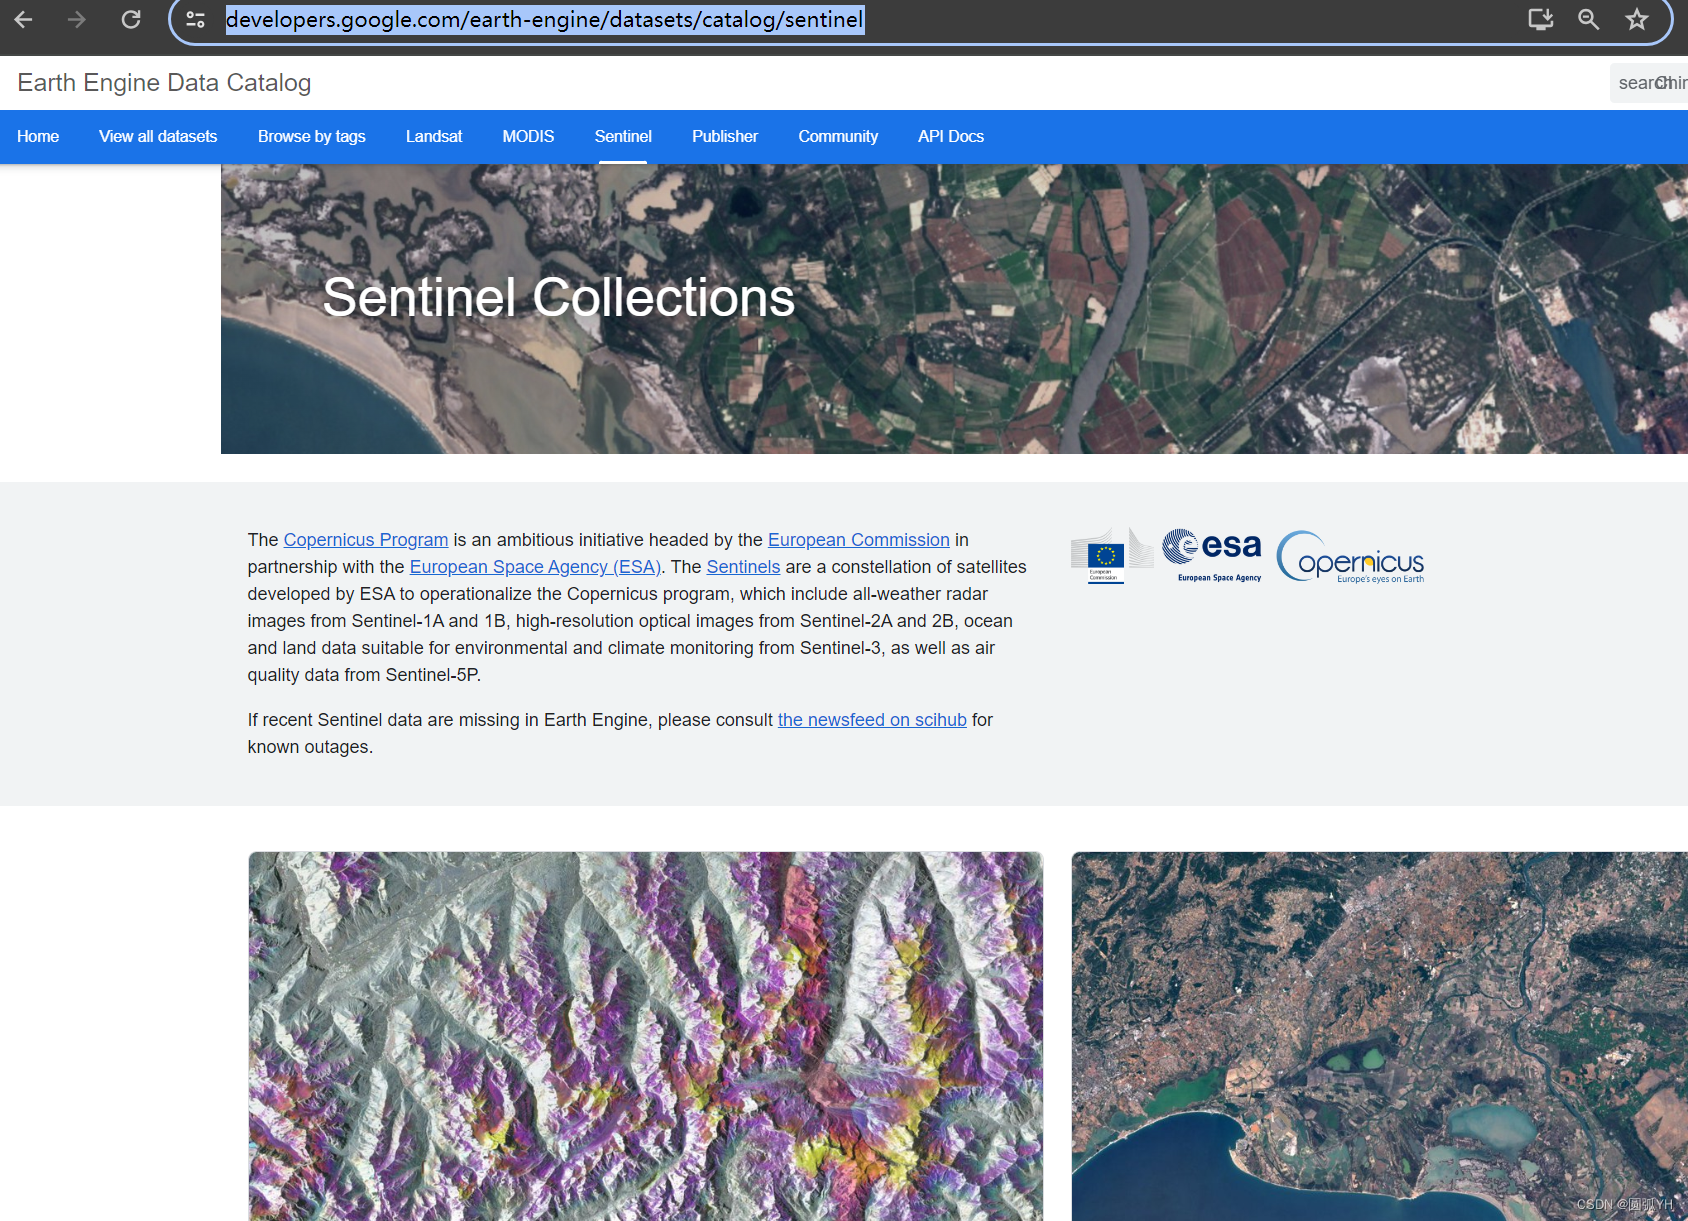
卫星遥感数据
现在,登录网站,需要获取欧盟提供的遥感数据,即Sentinel-2 MS。进入界面。
网站中说:Explore with Earth Engine
Important: Earth Engine is a platform for petabyte-scale scientific analysis and visualization of geospatial datasets, both for public benefit and for business and government users. Earth Engine is free to use for research, education, and nonprofit use. To get started, please sign up for Earth Engine access.
Code Editor
Code Editor界面介绍
在Code Editor界面,可以进行更多的操作。进入如下界面。
https://code.earthengine.google.com/![]() https://code.earthengine.google.com/
https://code.earthengine.google.com/
Earth Engine is Google’s geospatial science platform in the cloud. Earth Engine is now available for paid commercial use, and remains free for academic and noncommercial use.
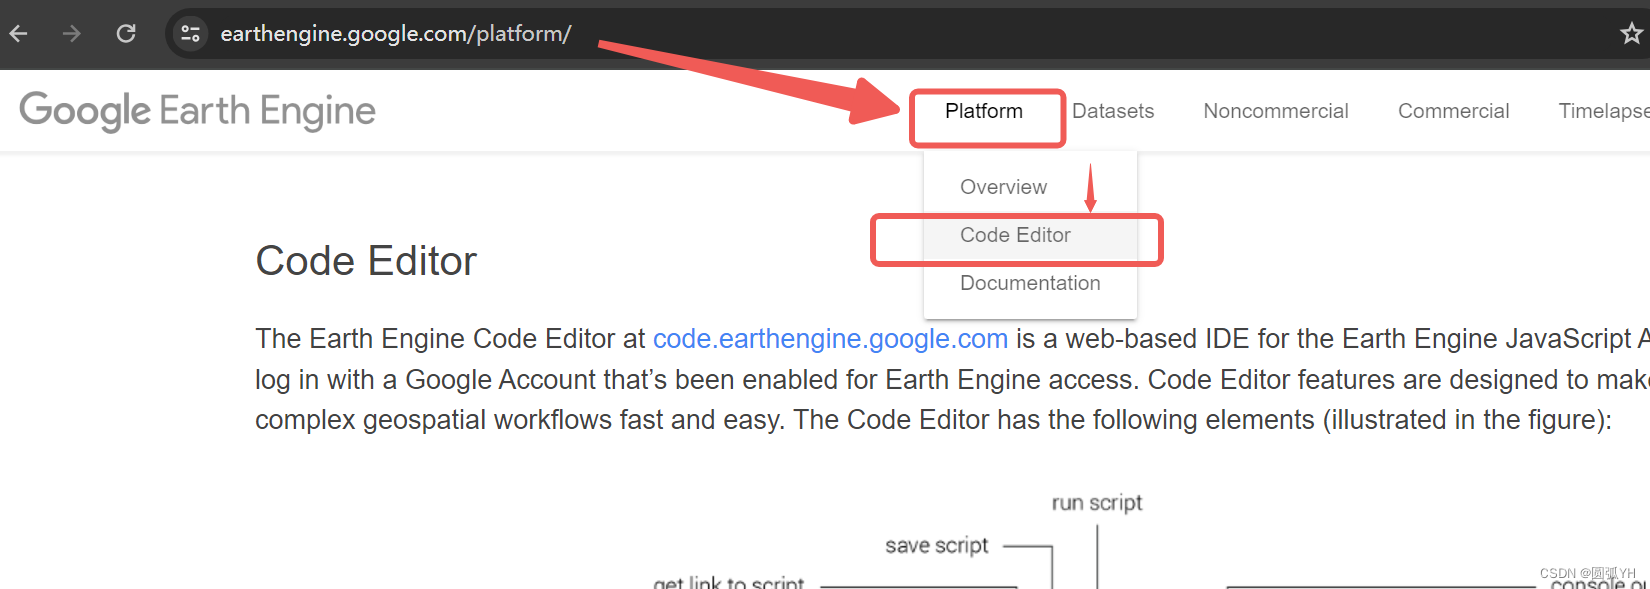
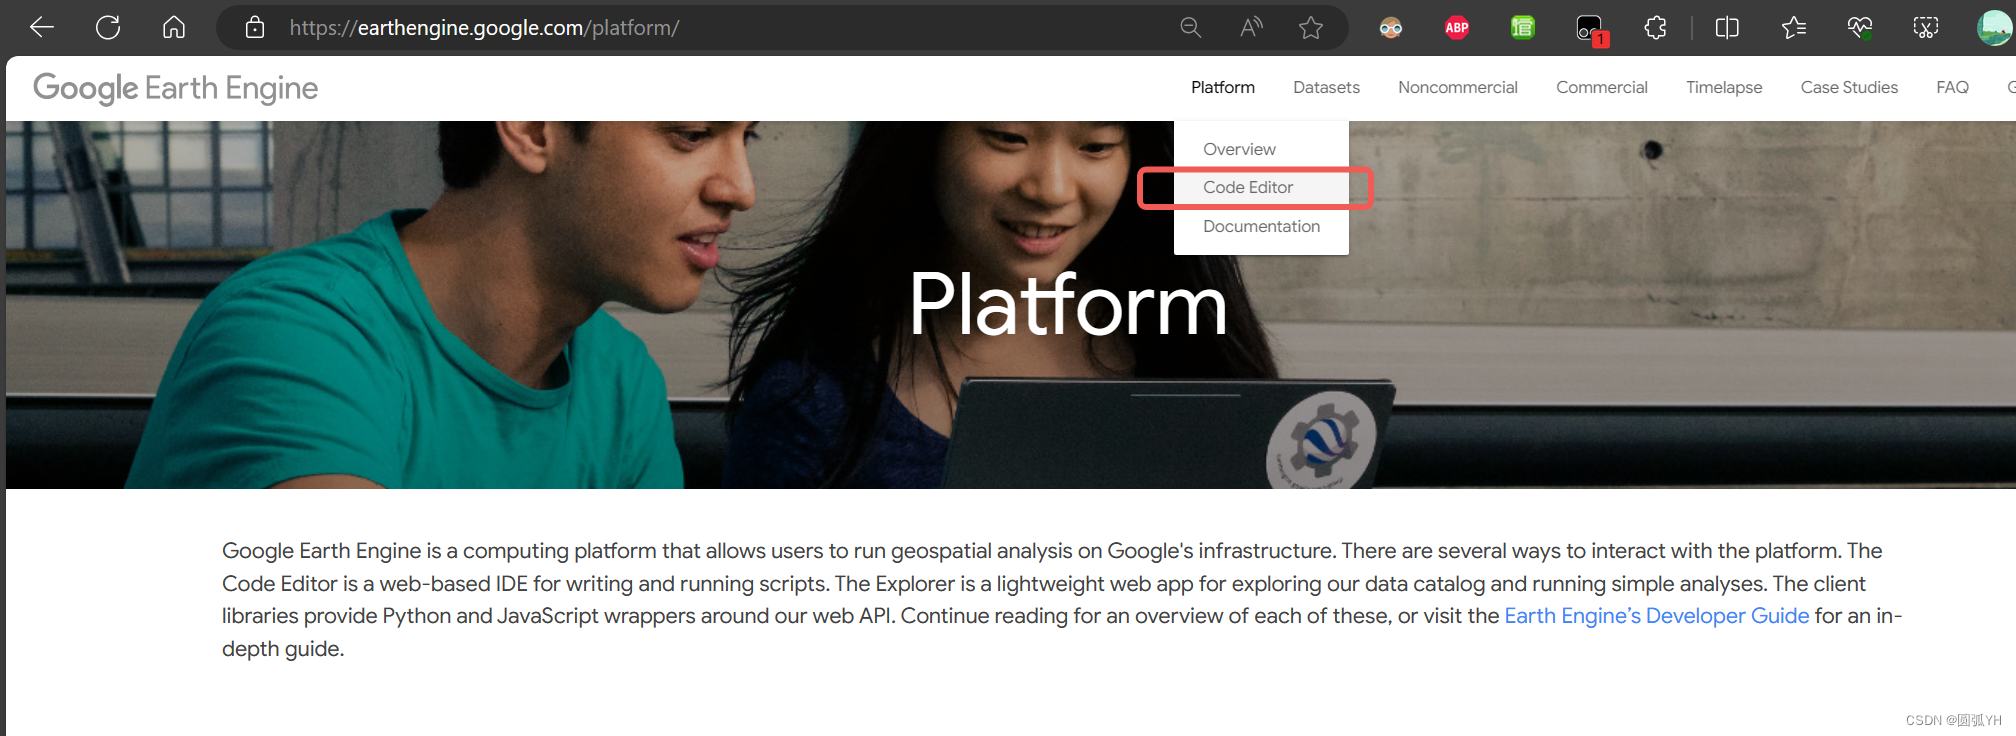
在platform界面中,会对Code Editor 进行介绍
https://earthengine.google.com/platform/![]() https://earthengine.google.com/platform/
https://earthengine.google.com/platform/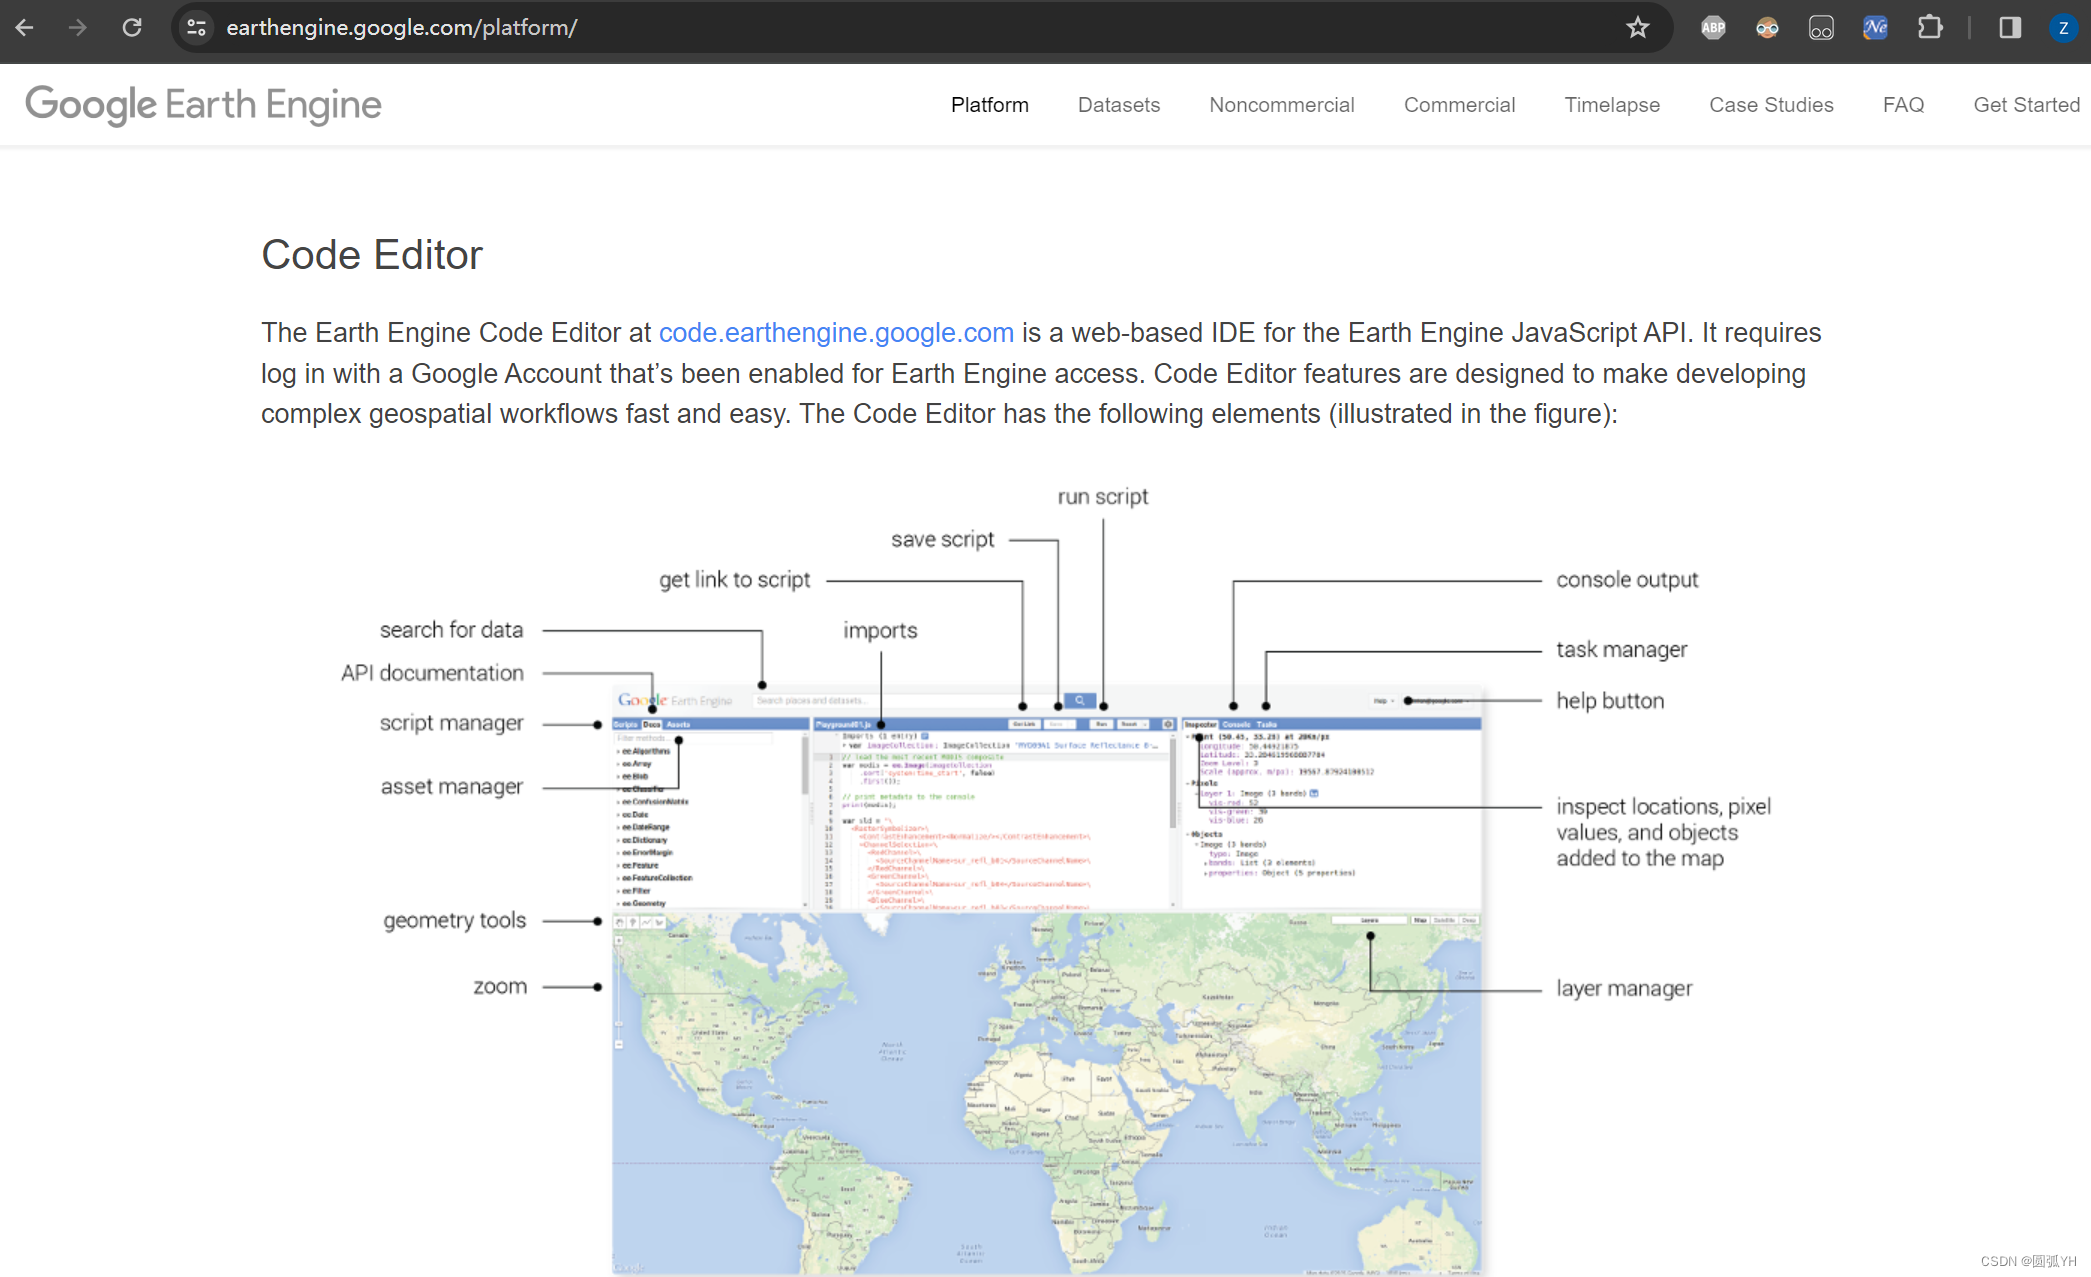
在该界面中,可以直接点击进入。
进入后,会出现这个界面。
因为前面已经通过邮箱发邮件注册过,所以这里可以直接登录进入。
选择已经建立的云项目。或者选择系统默认新建的云项目。然后就进入该界面。
初次进入界面后,网站会给你引导说明,告诉你左中右三个区域各个按键的操作和功能。
Code Editor界面操作
在Platform界面中,选择Code Editor,可以进入该界面。
在Code Editor中,可以下载相应遥感图享。但是在下载之前,需要学习GEE的程序语言。GEE是在云端运行程序的,所以不需要再在本地电脑上写。
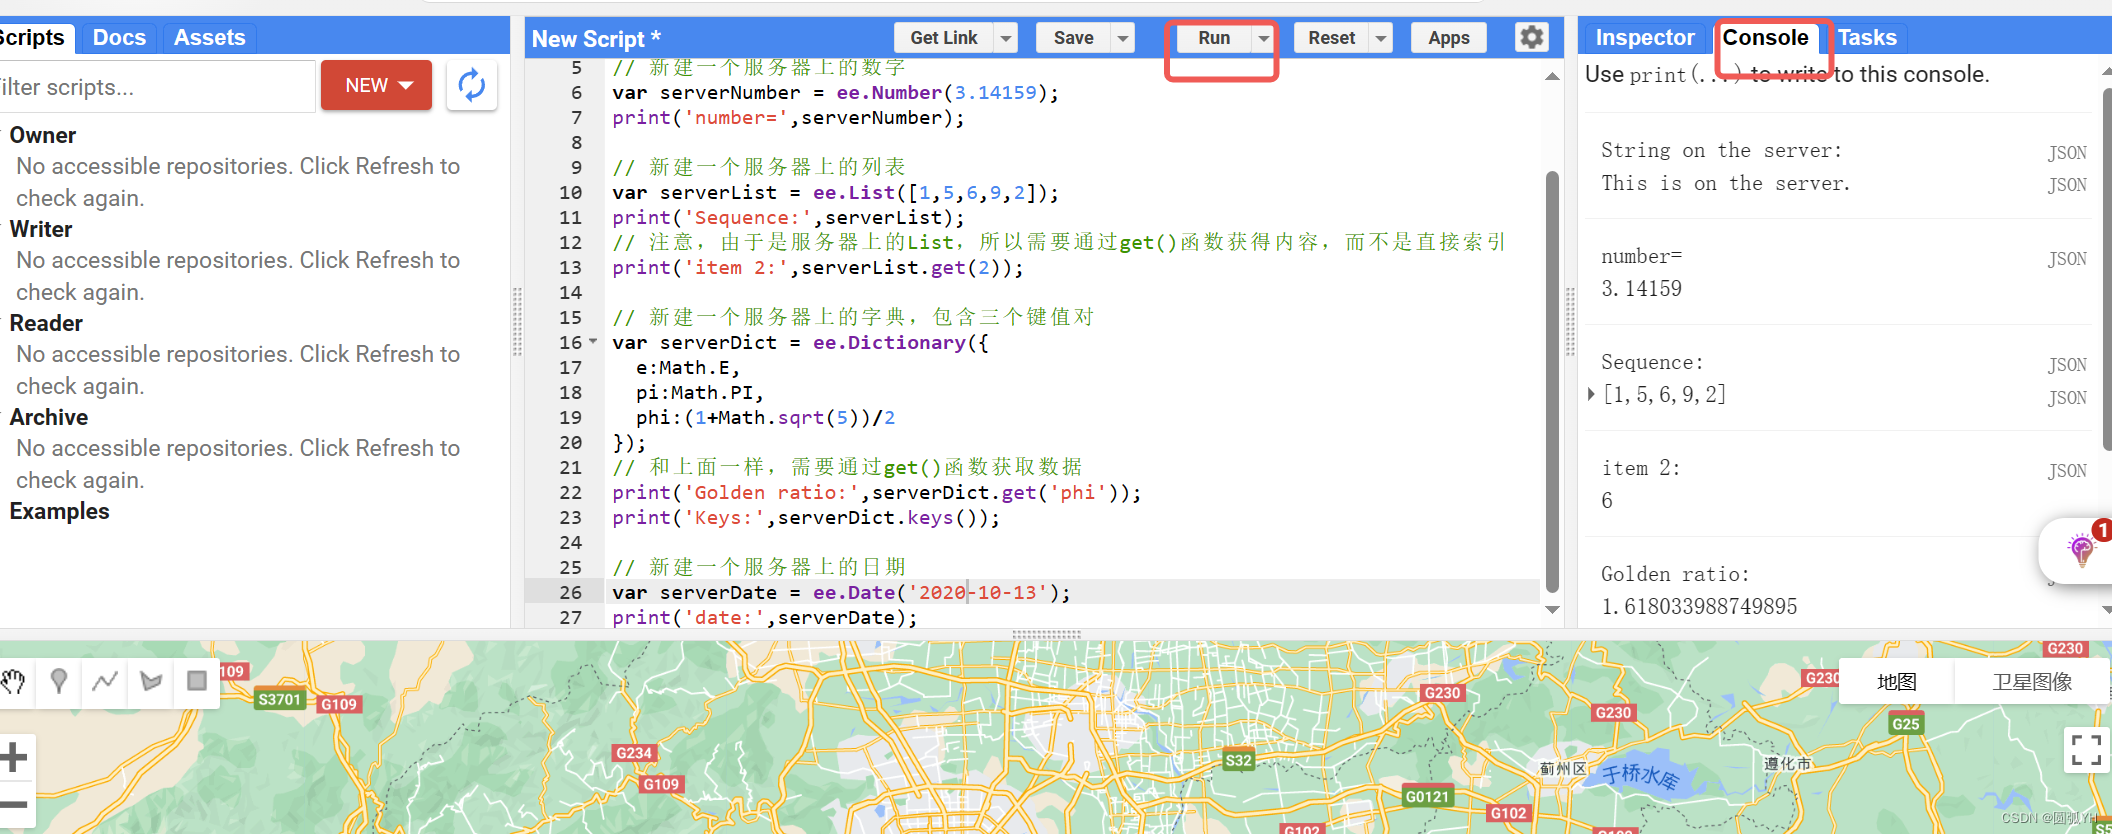
如下代码,是CSDN博客主所写的代码。
// 新建一个服务器上的字符串
var serverString = ee.String('This is on the server.');
print('String on the server:', serverString);

// 新建一个服务器上的数字
var serverNumber = ee.Number(3.14159);
print('number=',serverNumber);

// 新建一个服务器上的列表
var serverList = ee.List([1,5,6,9,2]);
print('Sequence:',serverList);
// 注意,由于是服务器上的List,所以需要通过get()函数获得内容,而不是直接索引
print('item 2:',serverList.get(2));

// 新建一个服务器上的字典,包含三个键值对
var serverDict = ee.Dictionary({
  e:Math.E,
  pi:Math.PI,
  phi:(1+Math.sqrt(5))/2
});
// 和上面一样,需要通过get()函数获取数据
print('Golden ratio:',serverDict.get('phi'));
print('Keys:',serverDict.keys());

// 新建一个服务器上的日期
var serverDate = ee.Date('2020-10-13');
print('date:',serverDate);
在Google Earth Engine云平台中运行,效果如下所示:
可以在GEE中运行这一串代码:
// Instantiate an image with the Image constructor.
var image = ee.Image('CGIAR/SRTM90_V4');

// Zoom to a location.
Map.setCenter(120, 30, 6); // Center on the City.

// Display the image on the map.
//Map.addLayer(image);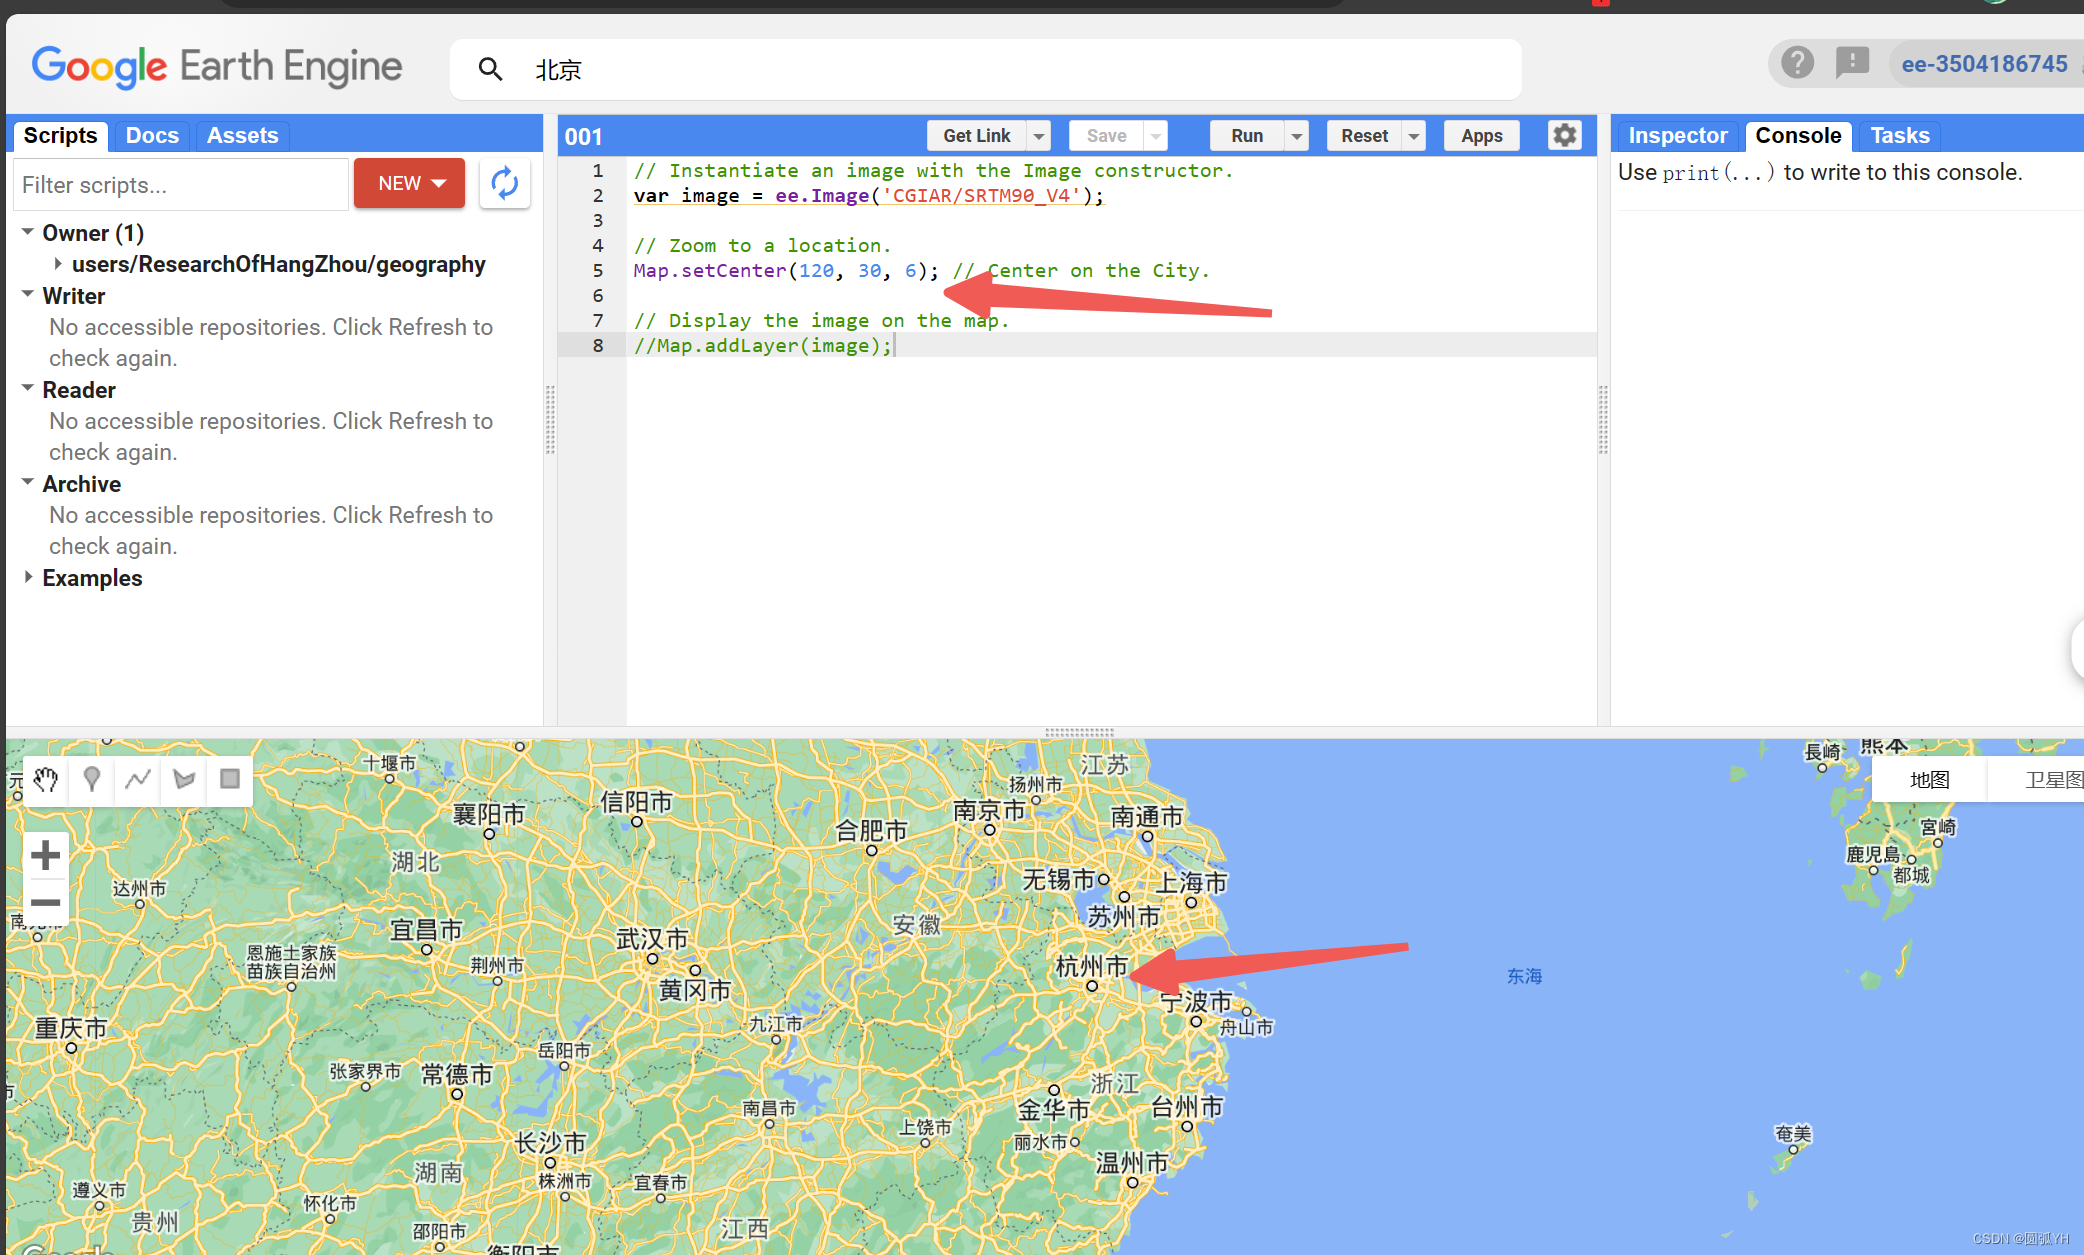
运行效果即如图所示。
又如下CSDN博客主代码:
//  获取Landsat8 TOA影像
var l8 = ee.ImageCollection('LANDSAT/LC08/C01/T1_TOA');

// 定义一个目标点
var point = ee.Geometry.Point(117.0721,33.2363);

// 调用filterBounds筛选位置
var spatialFiltered = l8.filterBounds(point);
print('spatialFiltered',spatialFiltered);

// 再调用filterDate筛选时间
var temporalFiltered = spatialFiltered.filterDate('2015-01-01','2015-12-31');
print('temporalFiltered',temporalFiltered);

// 到这一步之后,还可能有很多影像的,我们可以进一步按照云层覆盖进行排序
var sorted = temporalFiltered.sort('CLOUD_COVER');
// 选取含云量最少的那一景
var scene = sorted.first();

// 将影像放到当前地图的中心,缩放9级
Map.centerObject(scene,9);

// Landsat8的RGB波段分别是B4、B3、B2
// 最大值设为0.3,最小值默认为0
var visParams = {bands:['B4','B3','B2'],max:0.3};

// 展示影像,名称为true-color composite
Map.addLayer(scene,visParams,'true-color composite');
如代码中所示,运行程序后,效果如下图所示:
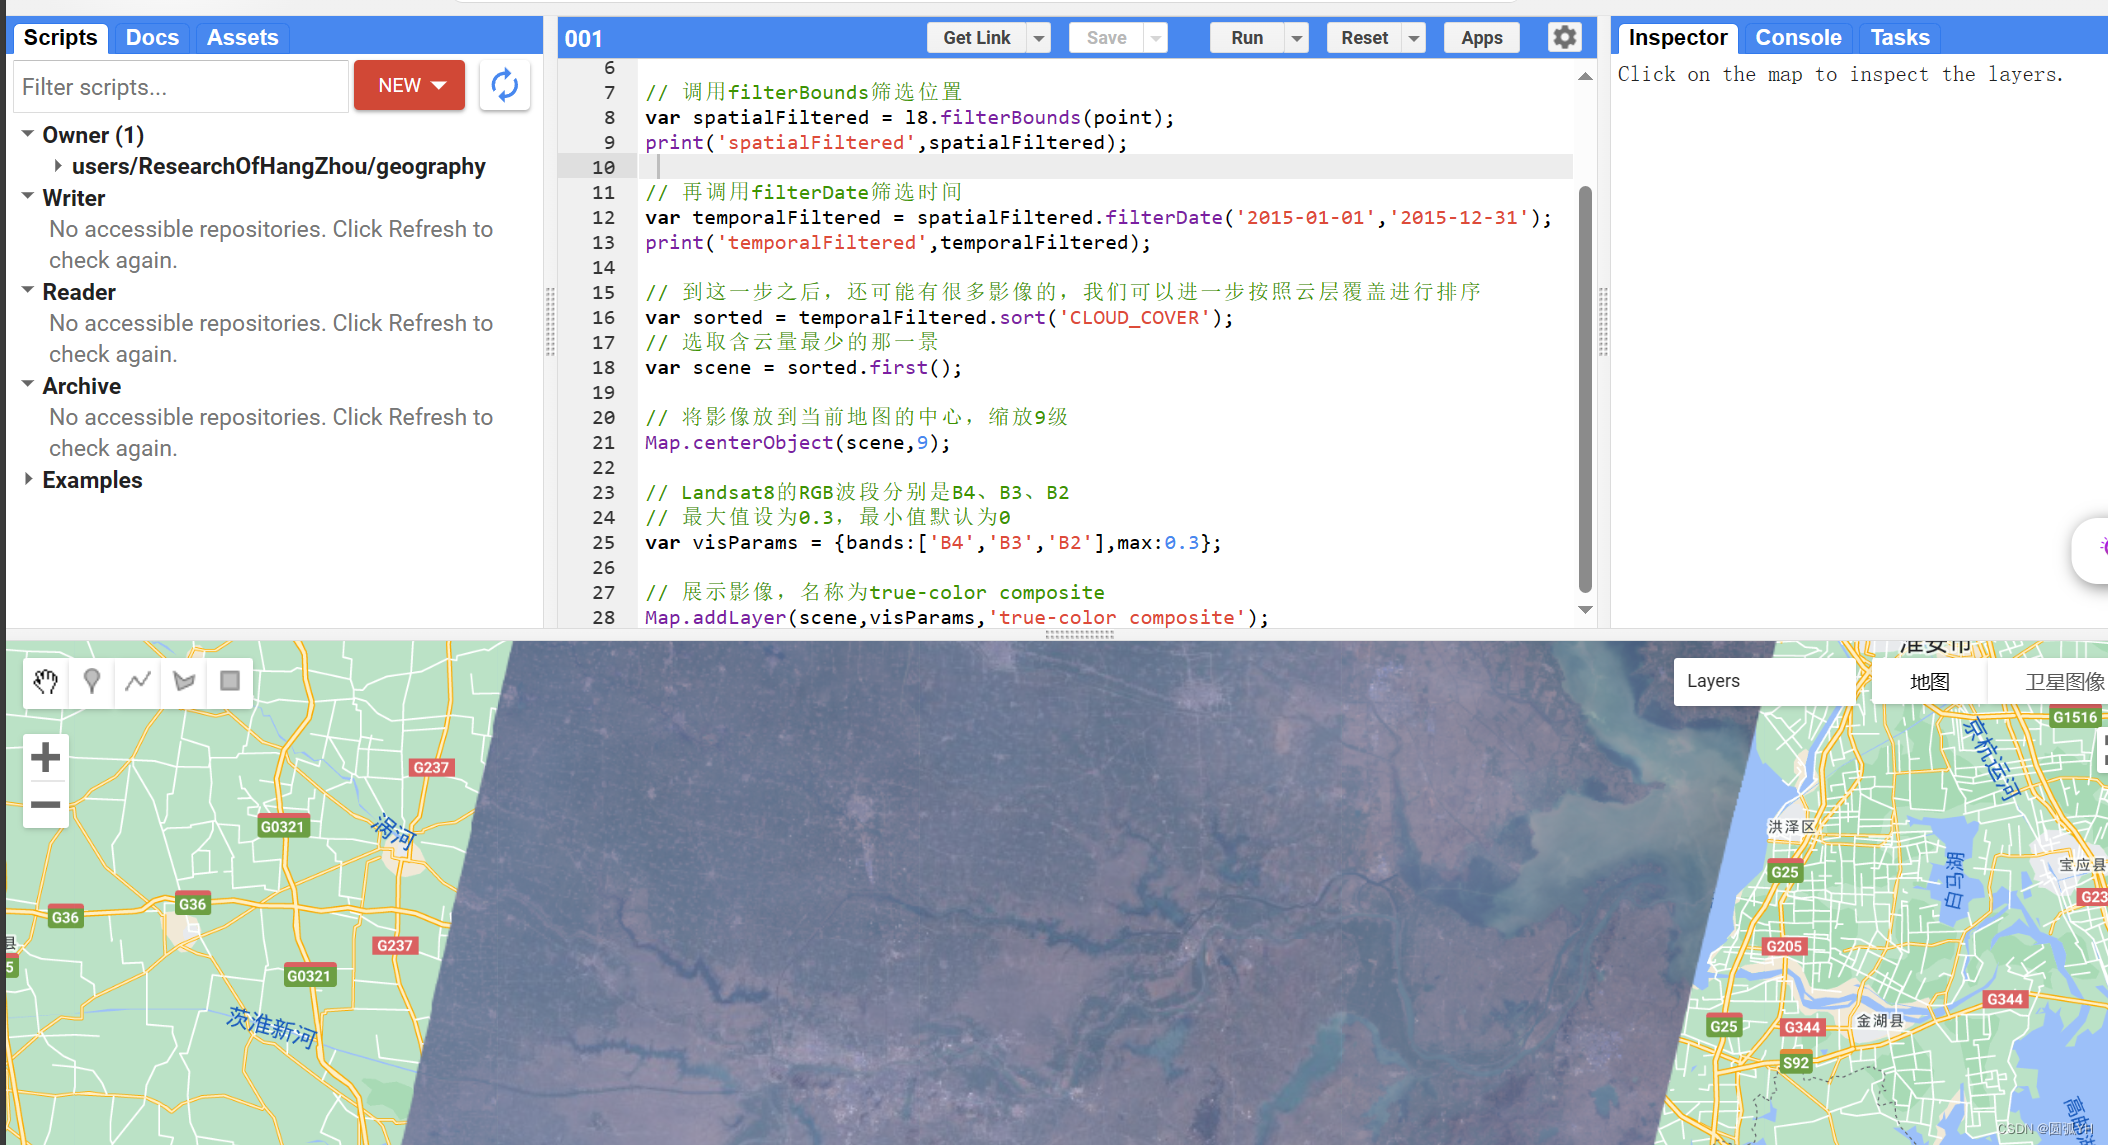
代码筛选了空间和时间范围,然后呈现了出来。
对于遥感数据,也可以写代码下载下来:
// 指定某个目标点
var point = ee.Geometry.Point([117.0721,33.2363]);
// 导入Landsat-8 TOA影像数据集
var l8 = ee.ImageCollection('LANDSAT/LC08/C01/T1_TOA');
// 获取2015年云量最少的影像
var image = ee.Image(
l8.filterBounds(point)
.filterDate('2015-01-01', '2015-12-31')
.sort('CLOUD_COVER')
.first()
);
// 计算Normalized Difference Vegetation Index (NDVI)
// Landsat8 第5波段是近红外(NIR),第4波段是红波段(Red)
var nir = image.select('B5');
var red = image.select('B4');
// 套用NDVI计算公式(NIR-Red)/(NIR+Red)
var ndvi = nir.subtract(red).divide(nir.add(red)).rename('NDVI');
// 设置影像到地图中心
Map.centerObject(image,9);
// 设置最大最小值和显示颜色
var ndviParams = {min:-1,max:1,palette:['blue','white','green']};
// 向地图中添加图层
Map.addLayer(ndvi,ndviParams,'NDVI image');
// 上面的代码都一样
// 这里,调用Export的toDrive函数导出
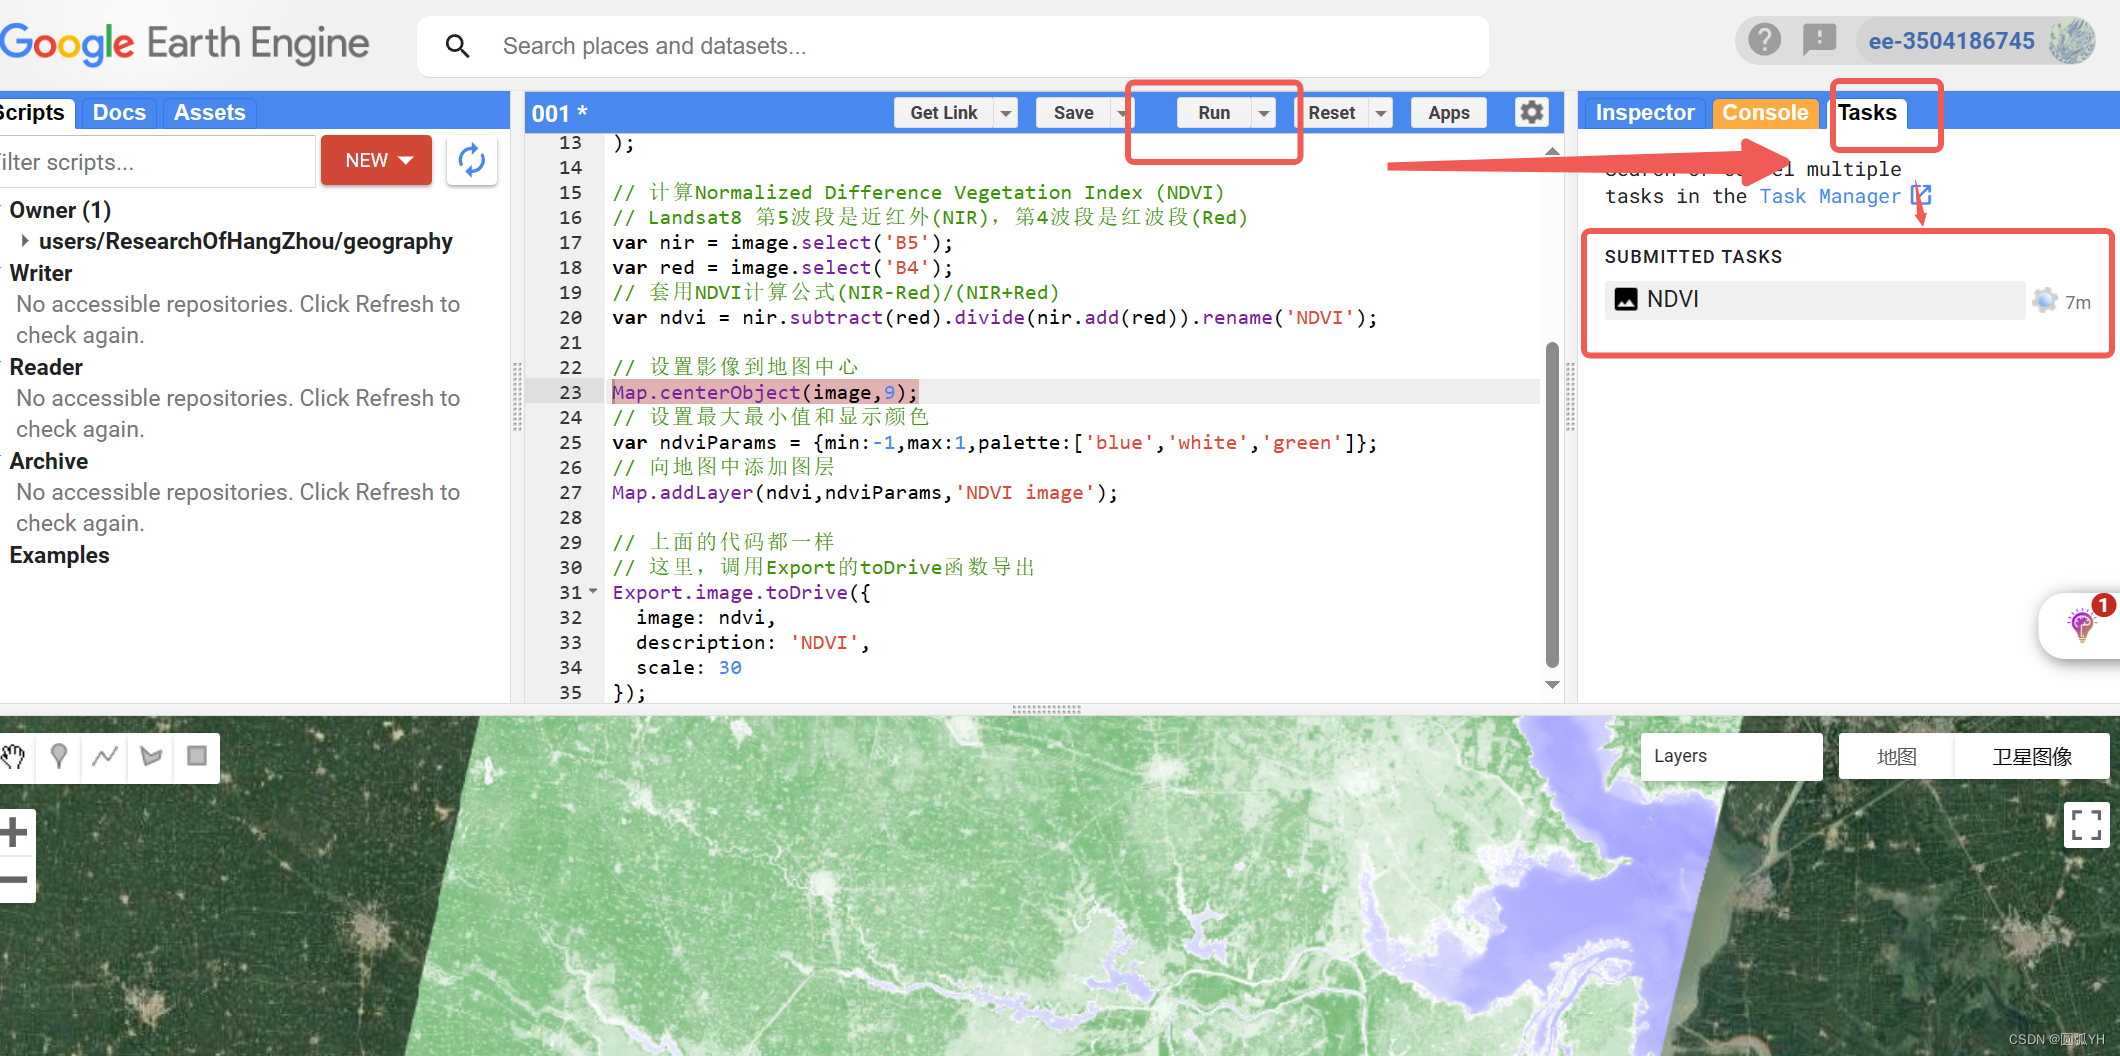
Export.image.toDrive({
image: ndvi,
description: 'NDVI',
scale: 30
});运行后,效果如下:
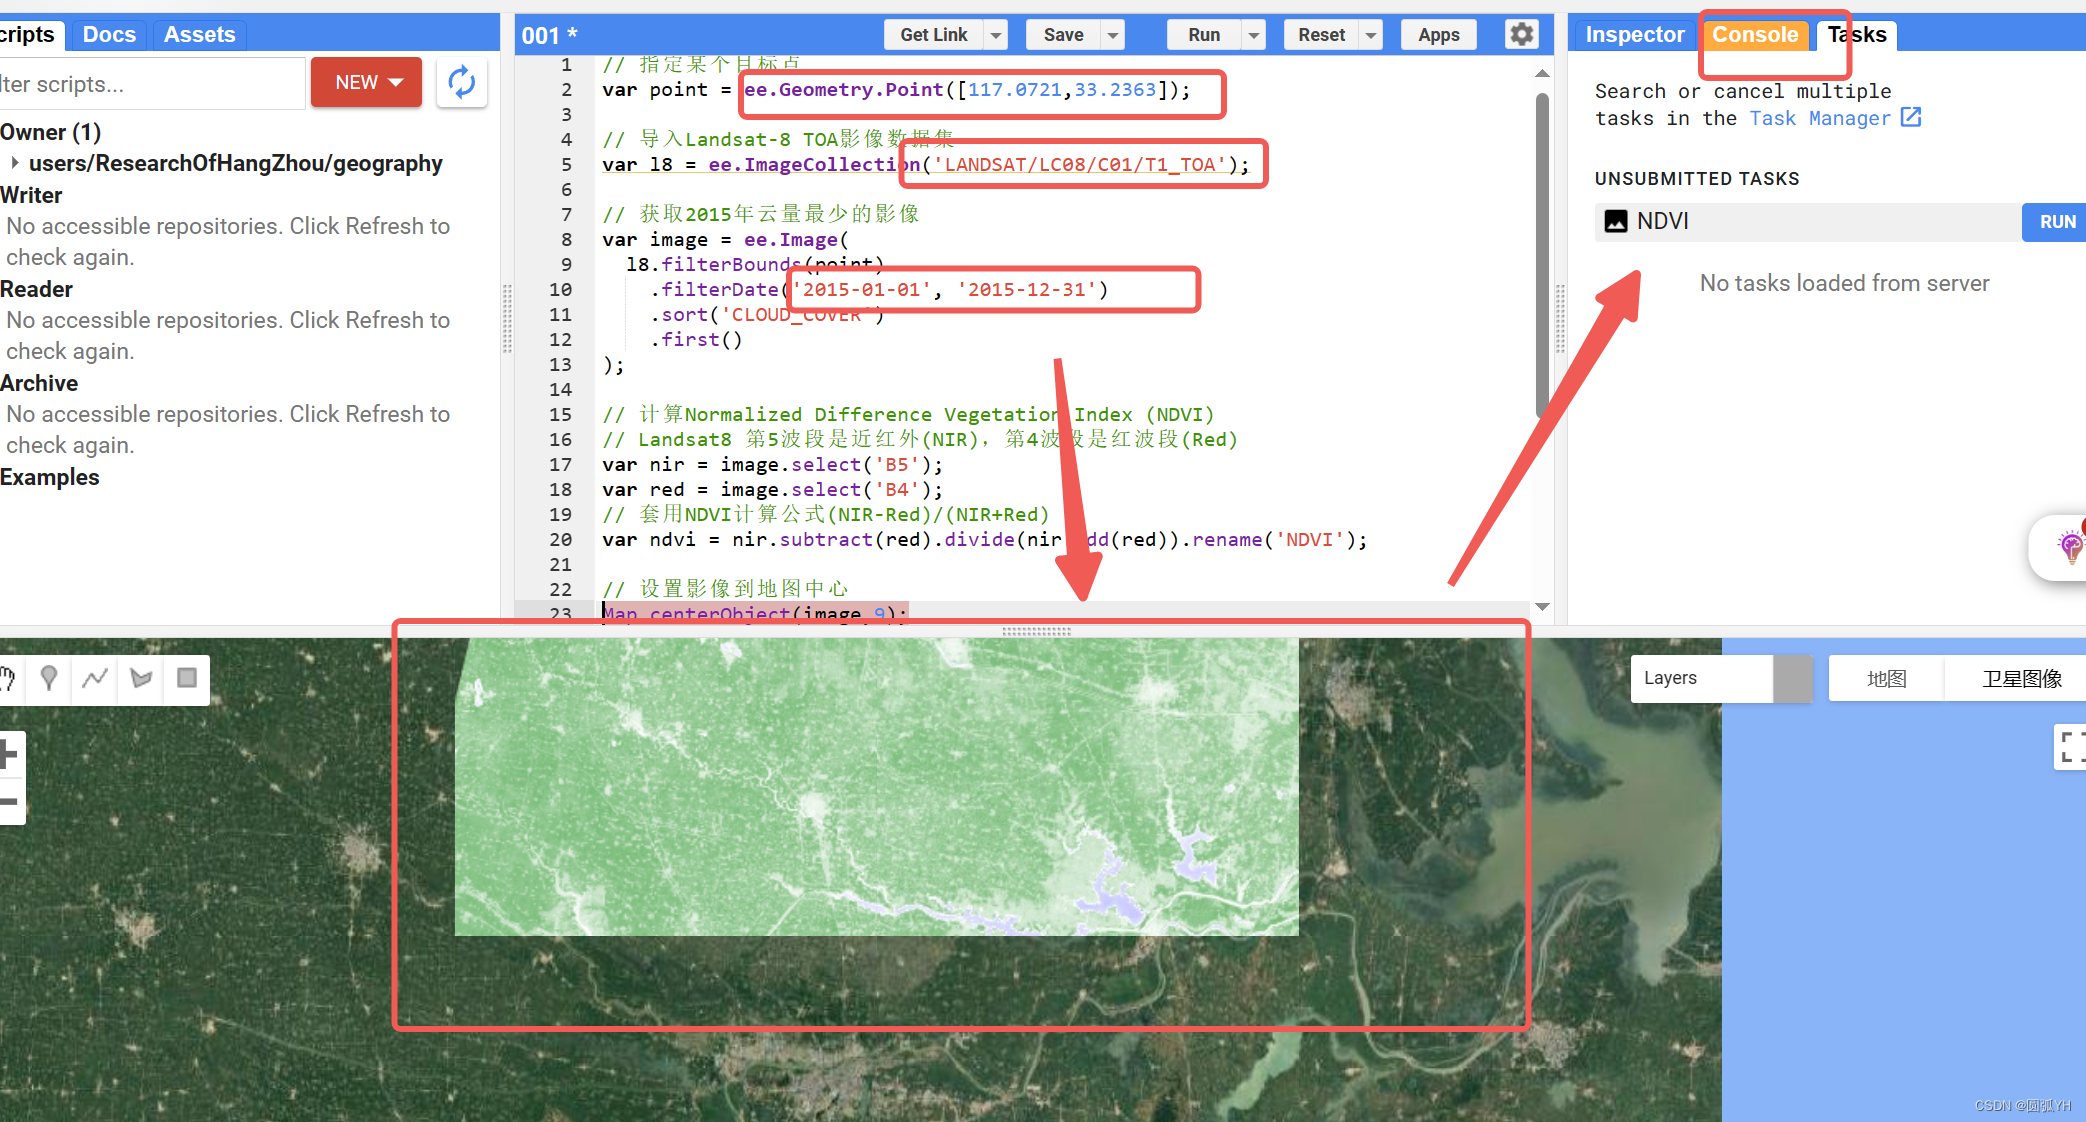
注意,选择的时候,需要明确时间,经纬点,以及对应的卫星数据(如“Landsat”)。这样,程序就能听得懂语言。
这时候,右上角出现Task,点击"RUN"
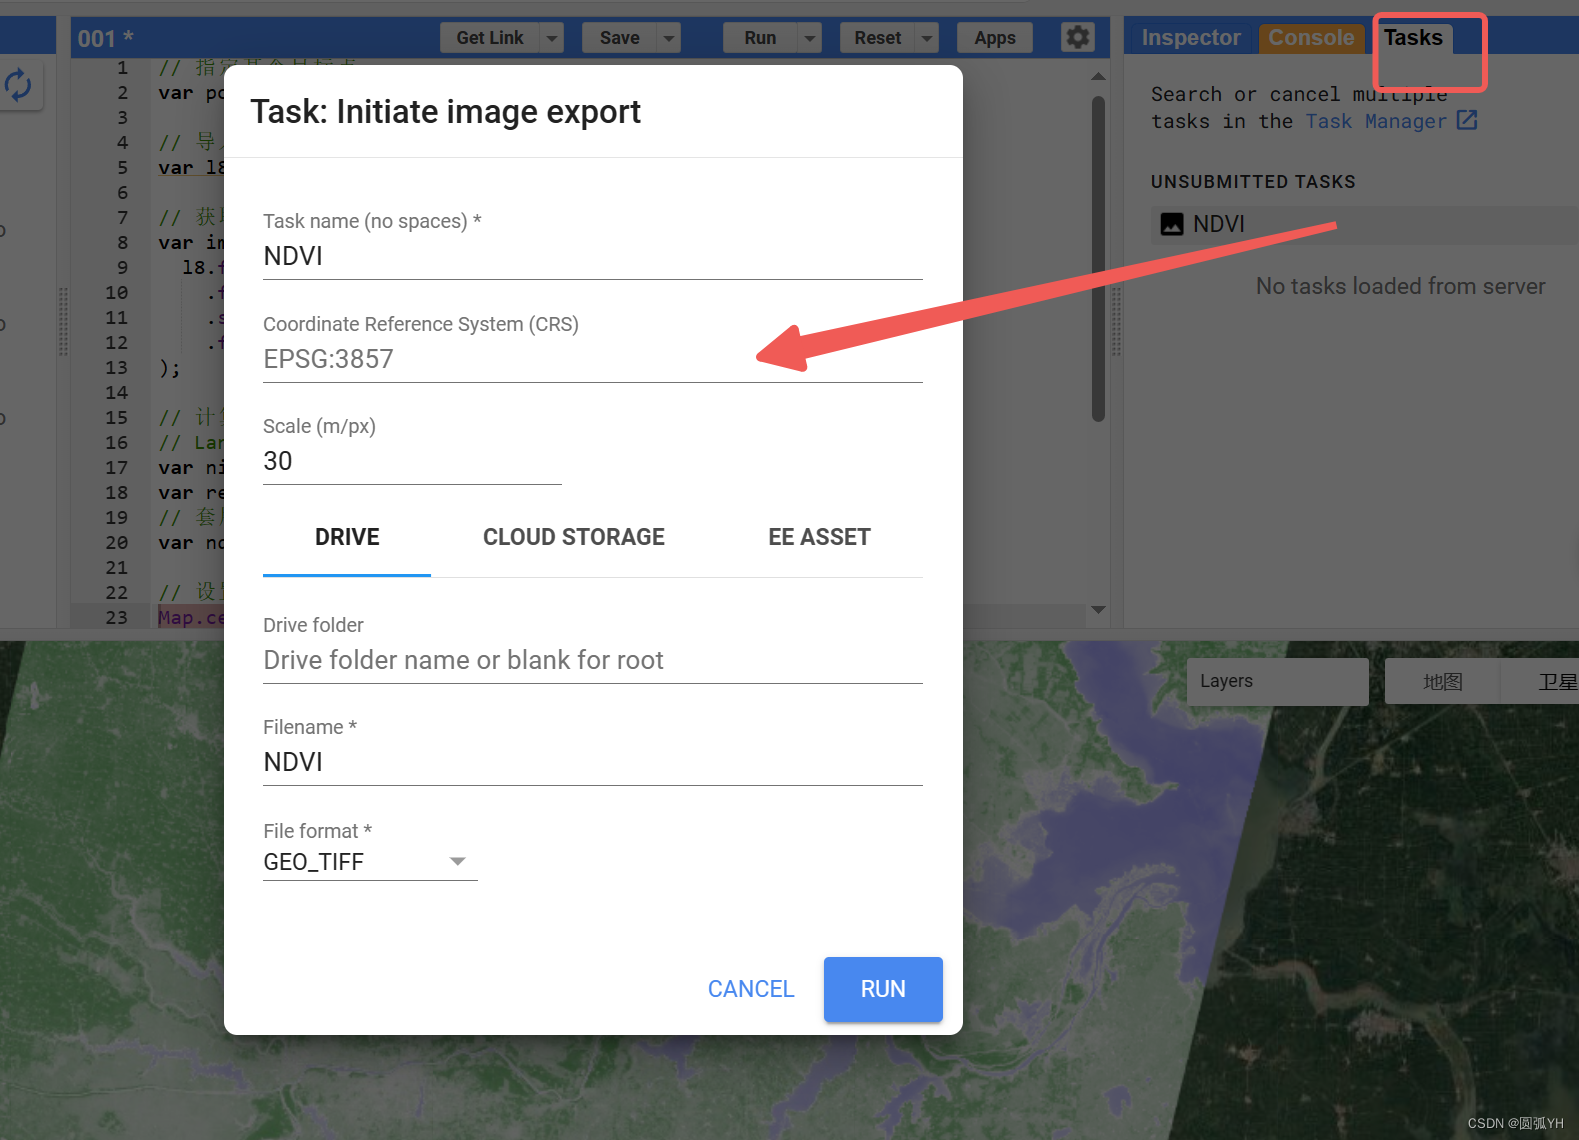
接着,点击“RUN”,这时候,在出现的task界面,可以看到正在保存。
Earth Engine Task Manager (google.com)![]() https://code.earthengine.google.com/tasks
https://code.earthengine.google.com/tasks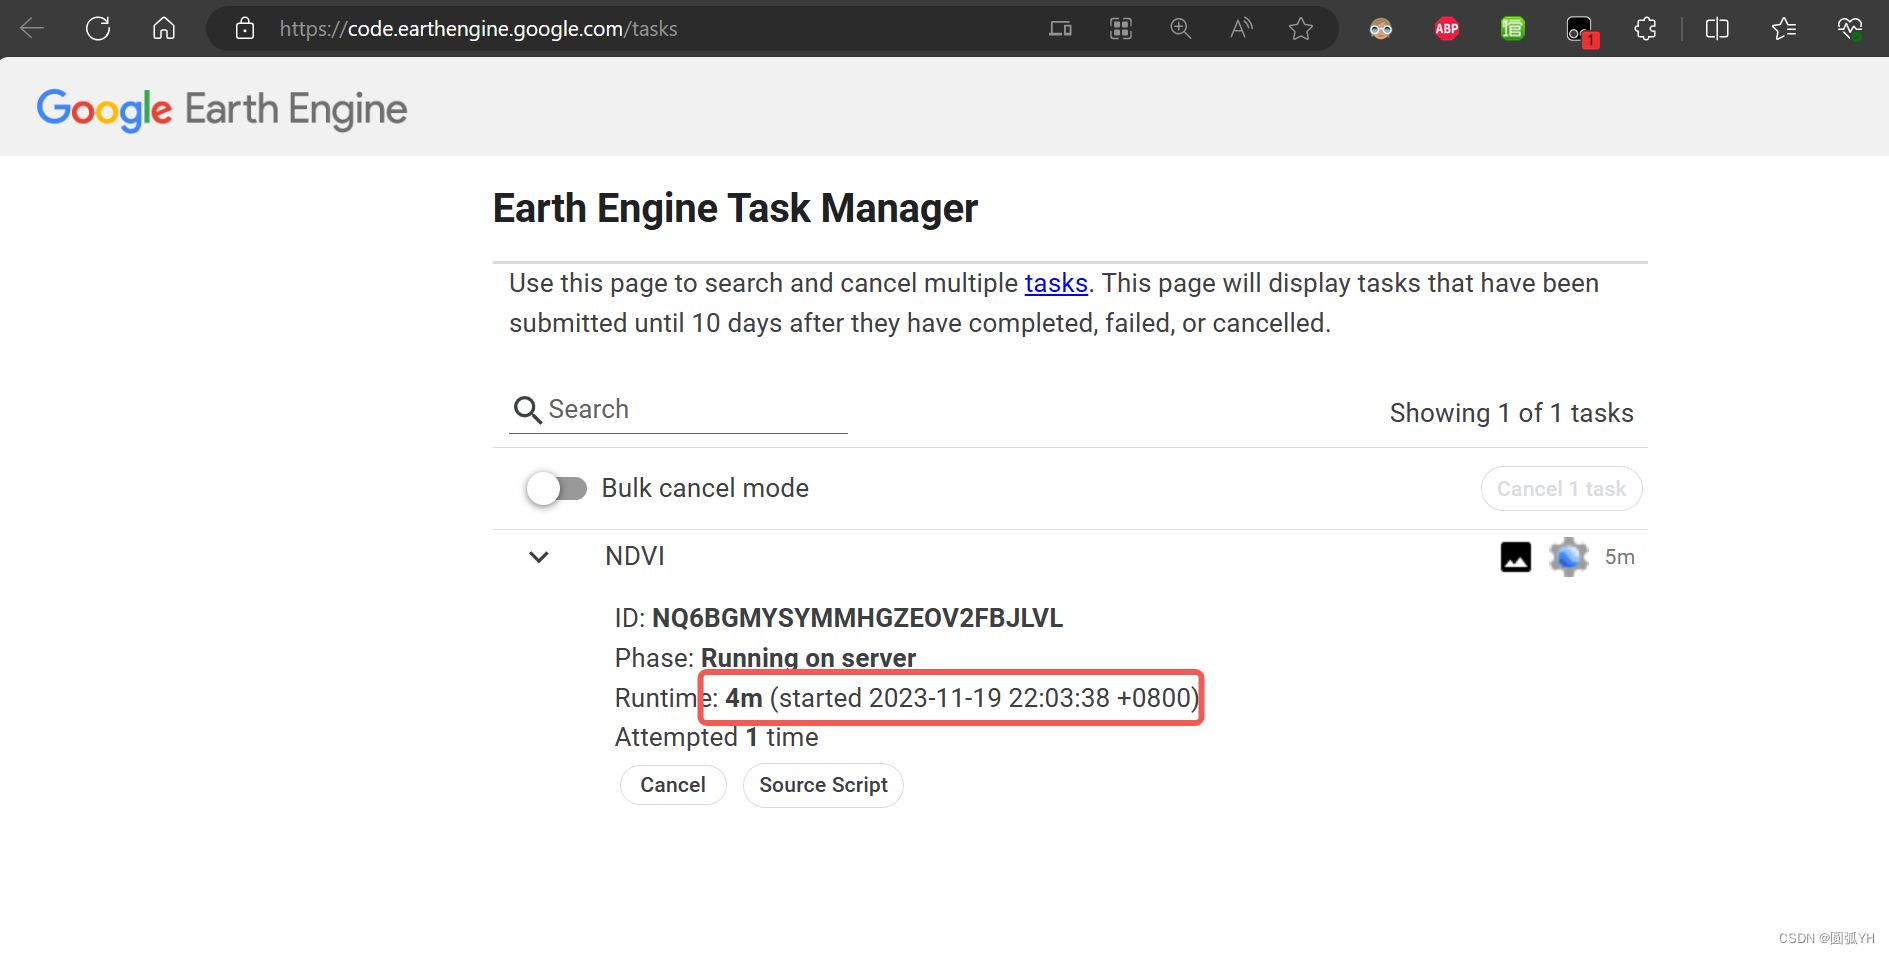
如图所示,显示保存这份文件在保存过程中的耗时。
回到最开始的界面,在Task板块看到程序在运行,文件在保存。
紧接着,在自己的Google Drive 中,可以看到文件已经保存在了云盘。格式为TIF格式。
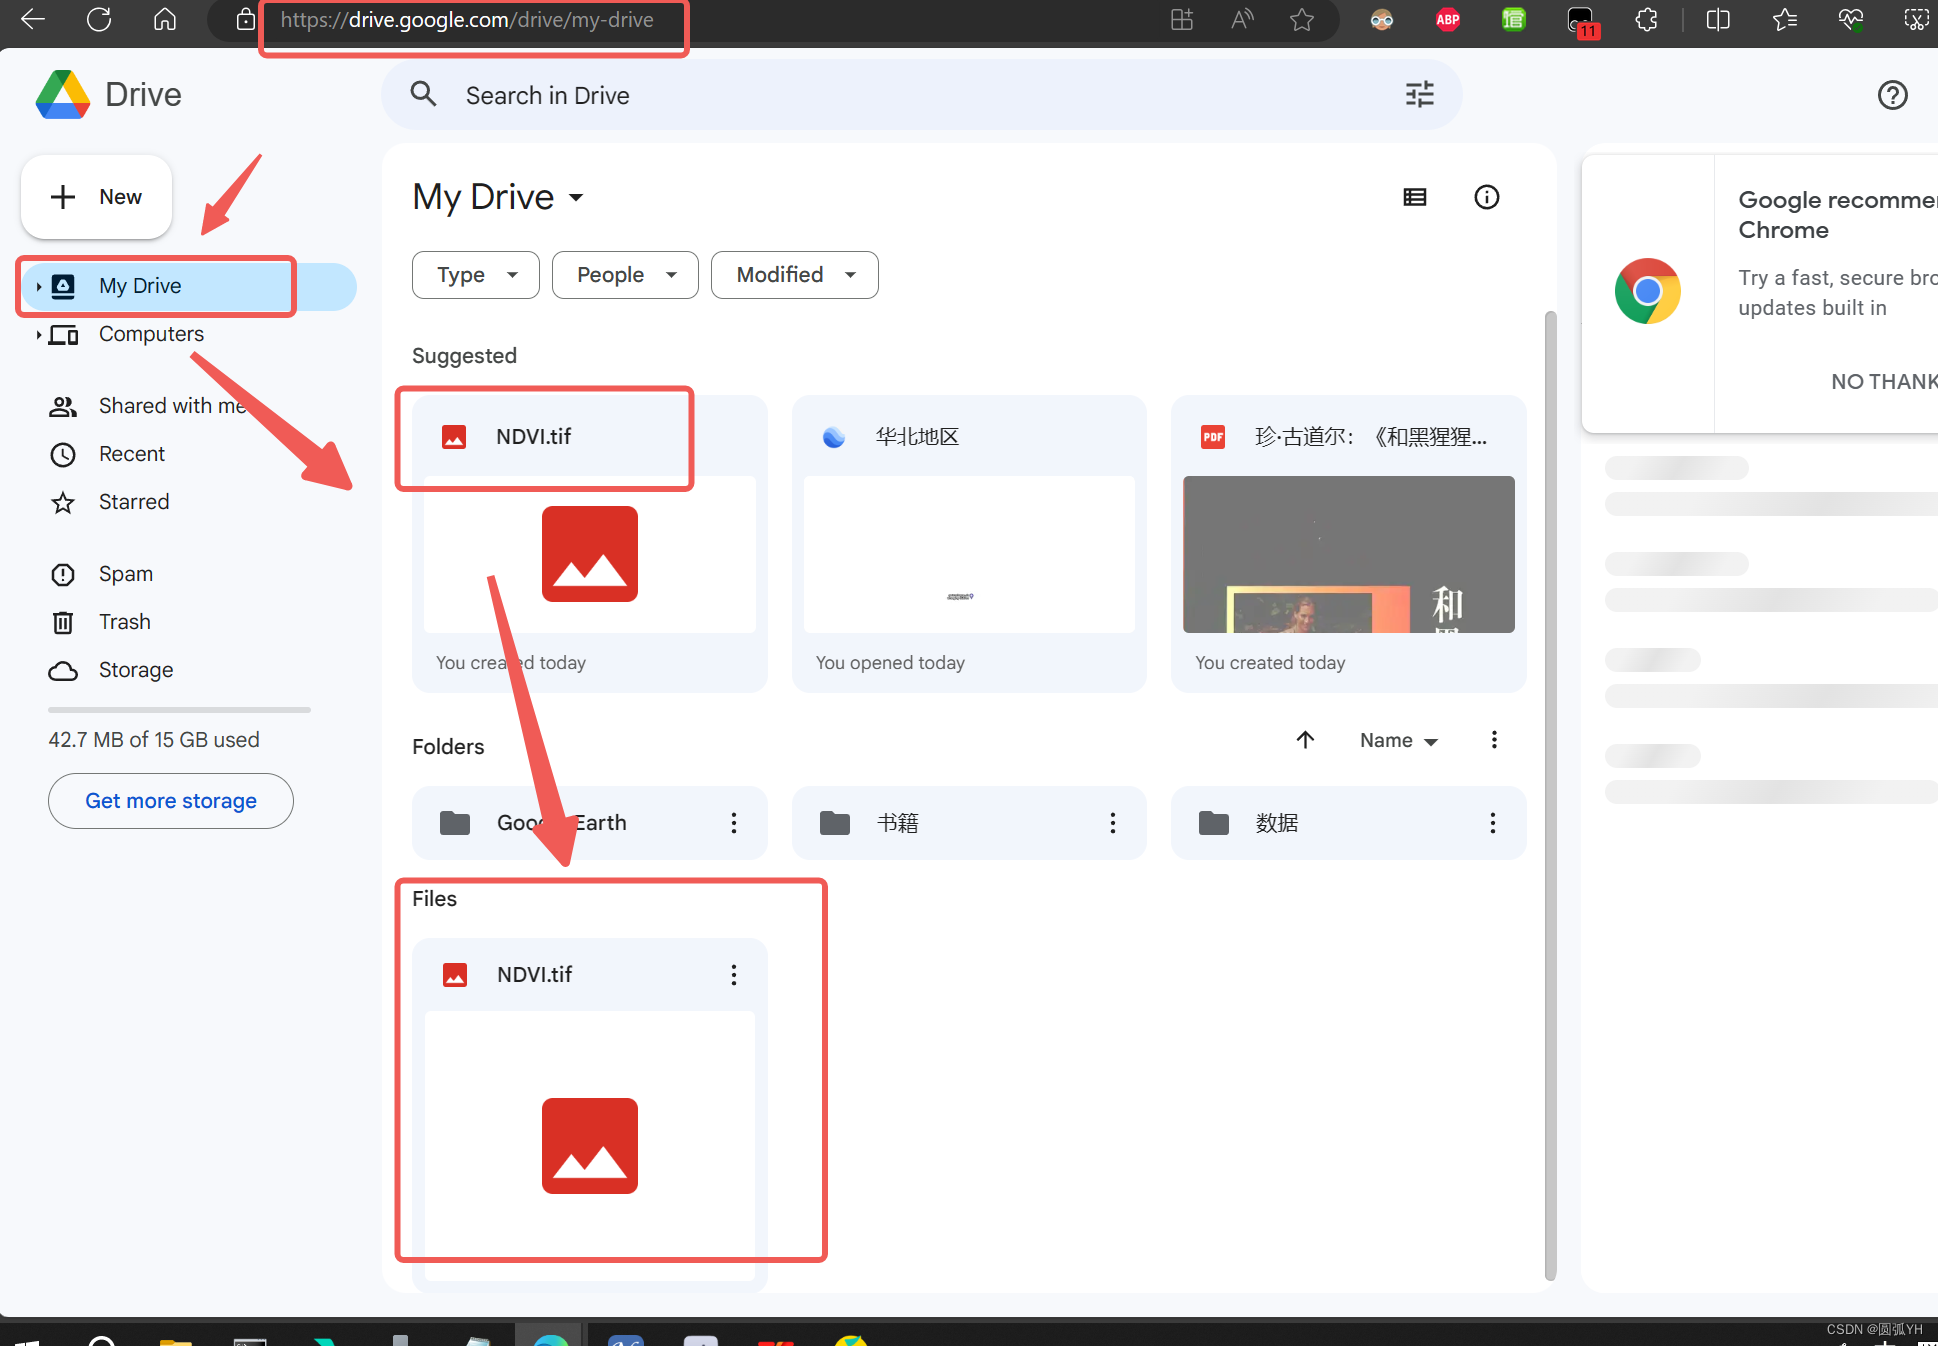
对于该数据,点击右上角可以下载到电脑中。
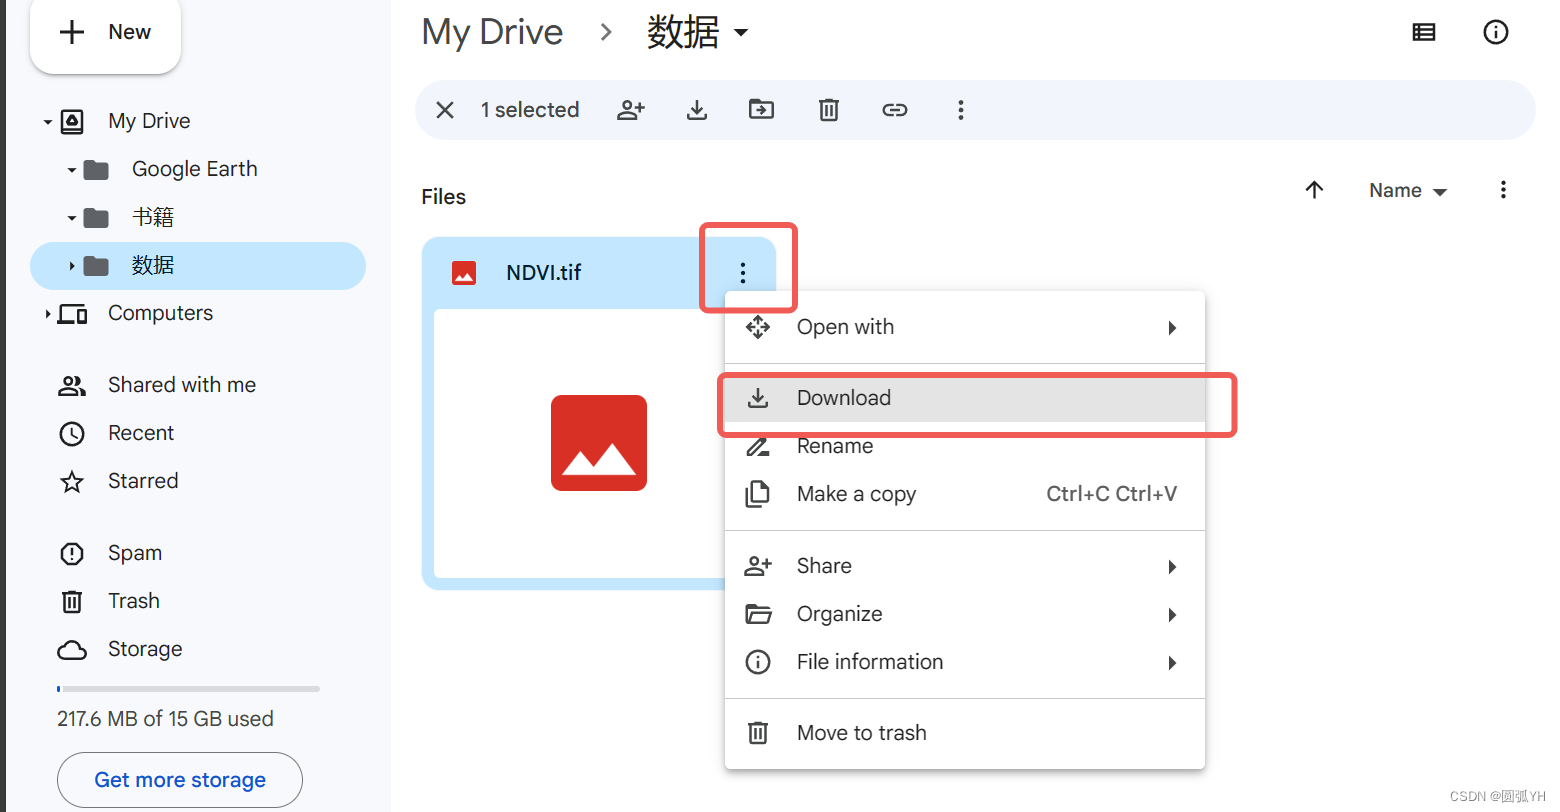
对这些数据,可以进一步操作,以便研究。
【心得】
Google Earth
Google Earth界面操作
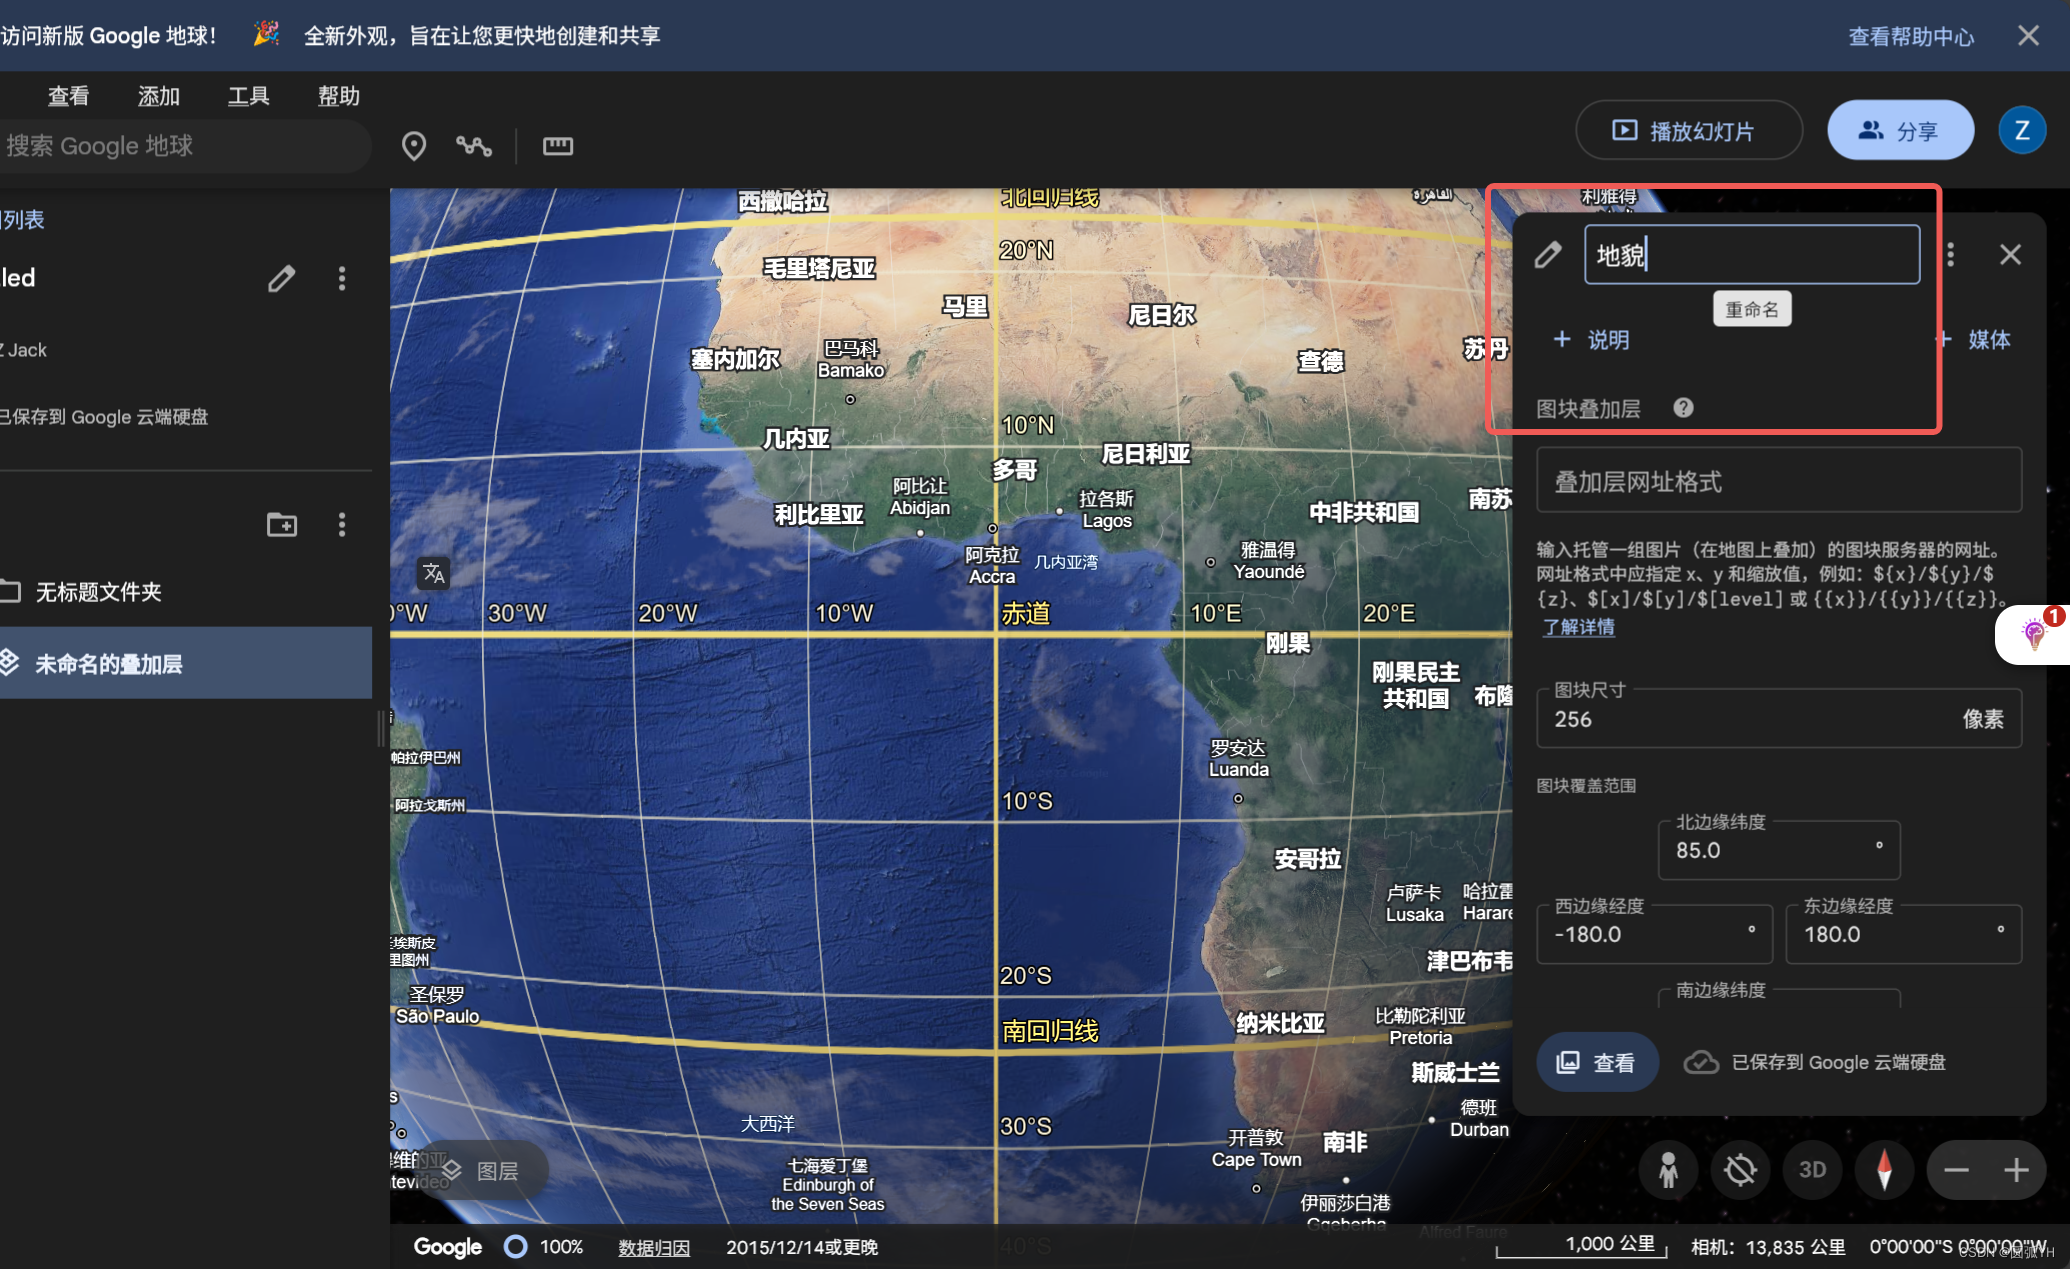
如图,可以新建图层和图层组,并重新命名
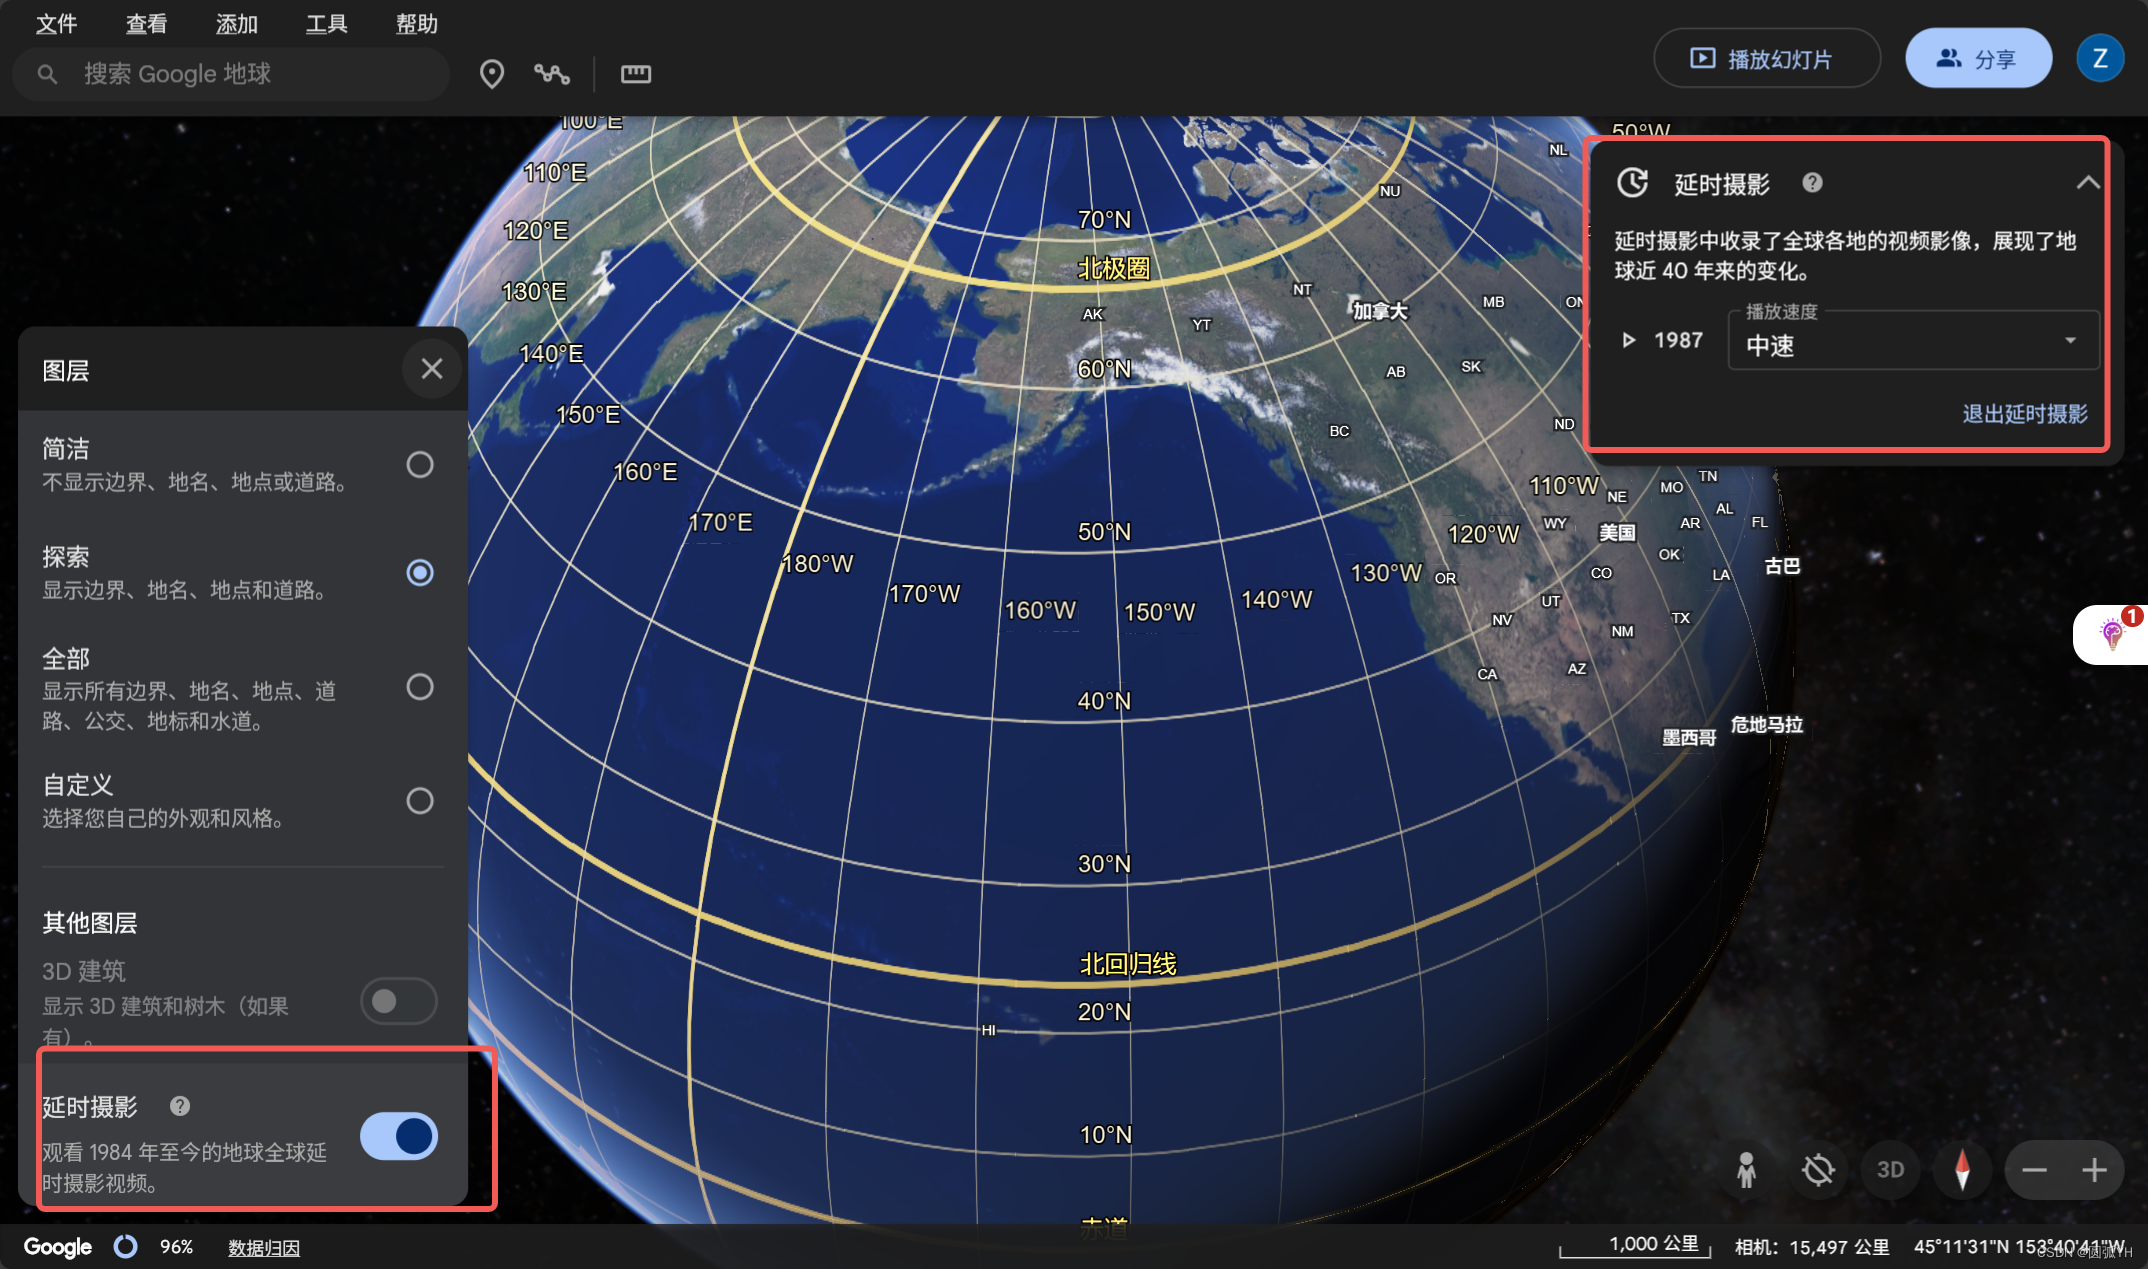
可以在左下界面中,通过延时摄影,观看历年的卫星影像。
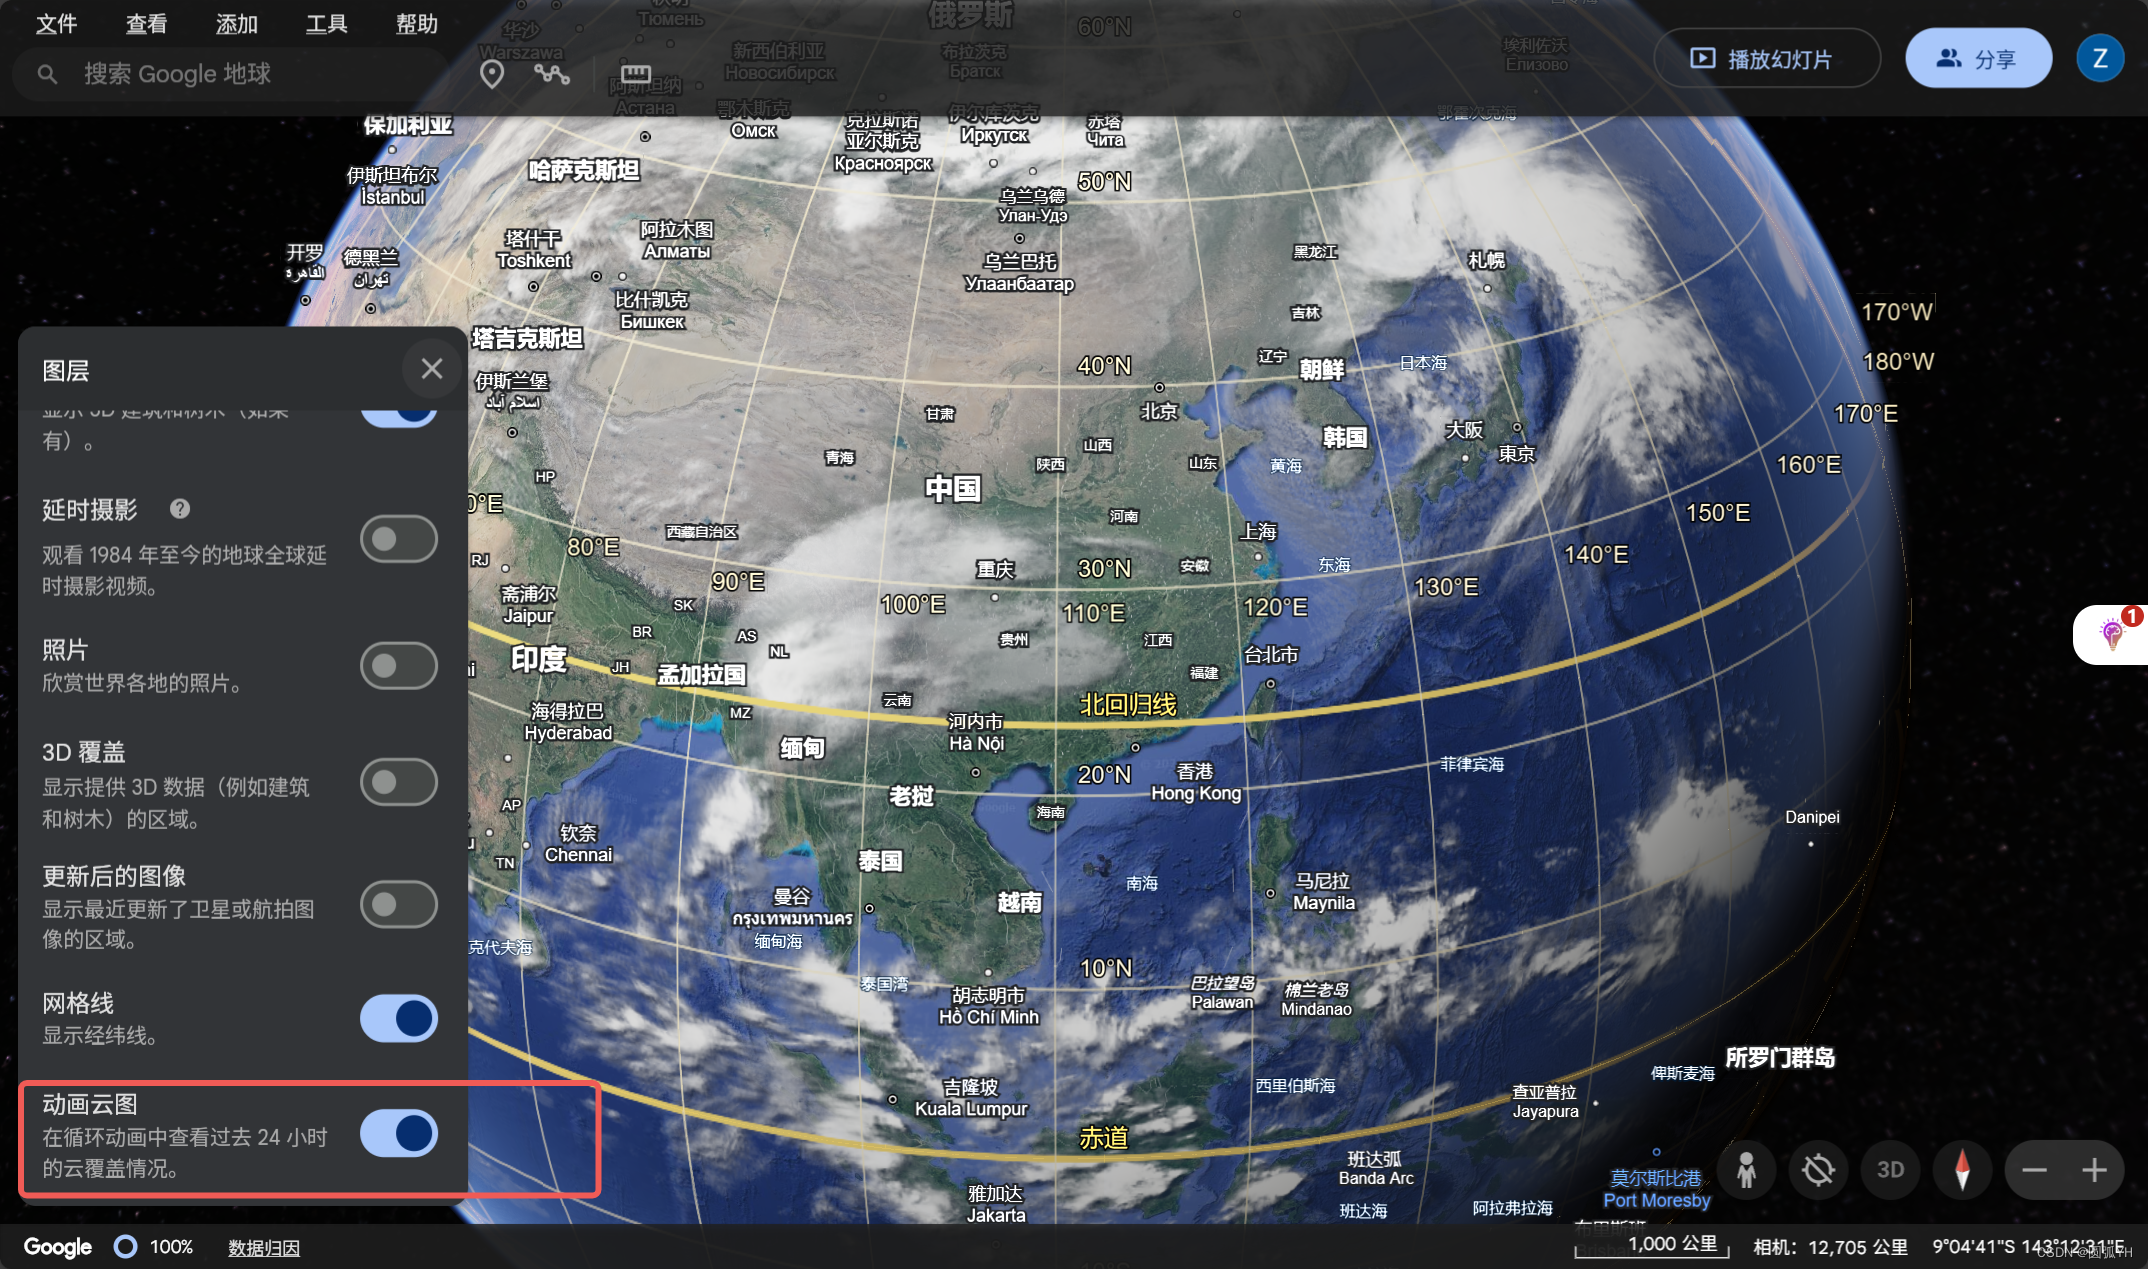
也可也在左下界面,观看24小时云图。
【心得】
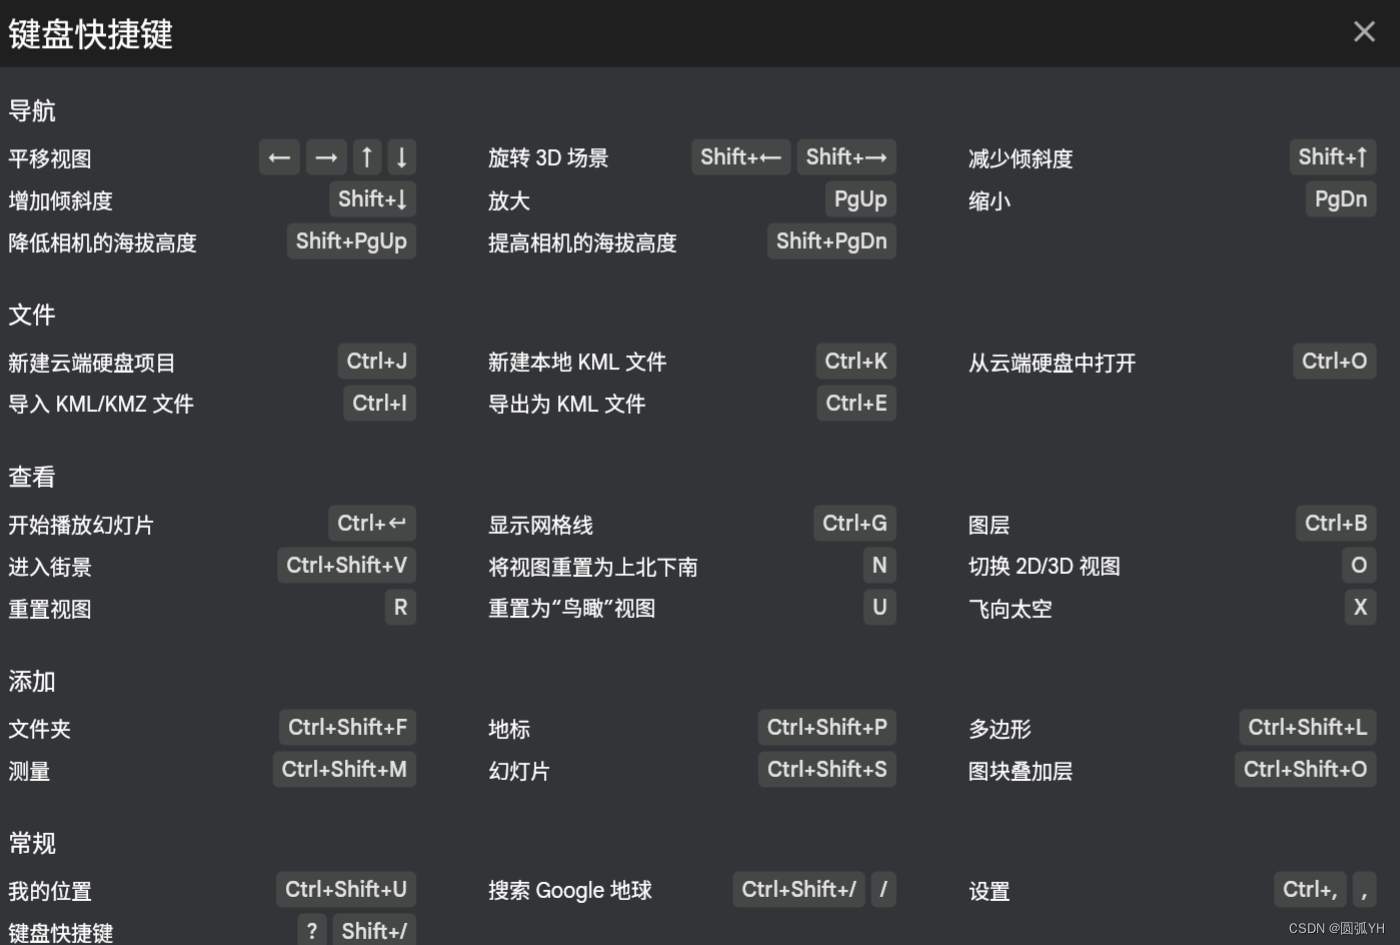
Google Earth快捷键
快捷键如下:
数据导出
操作结果,可以即时保存到Google云端硬盘。这时候,登录谷歌云盘,就能看到保存的文件。
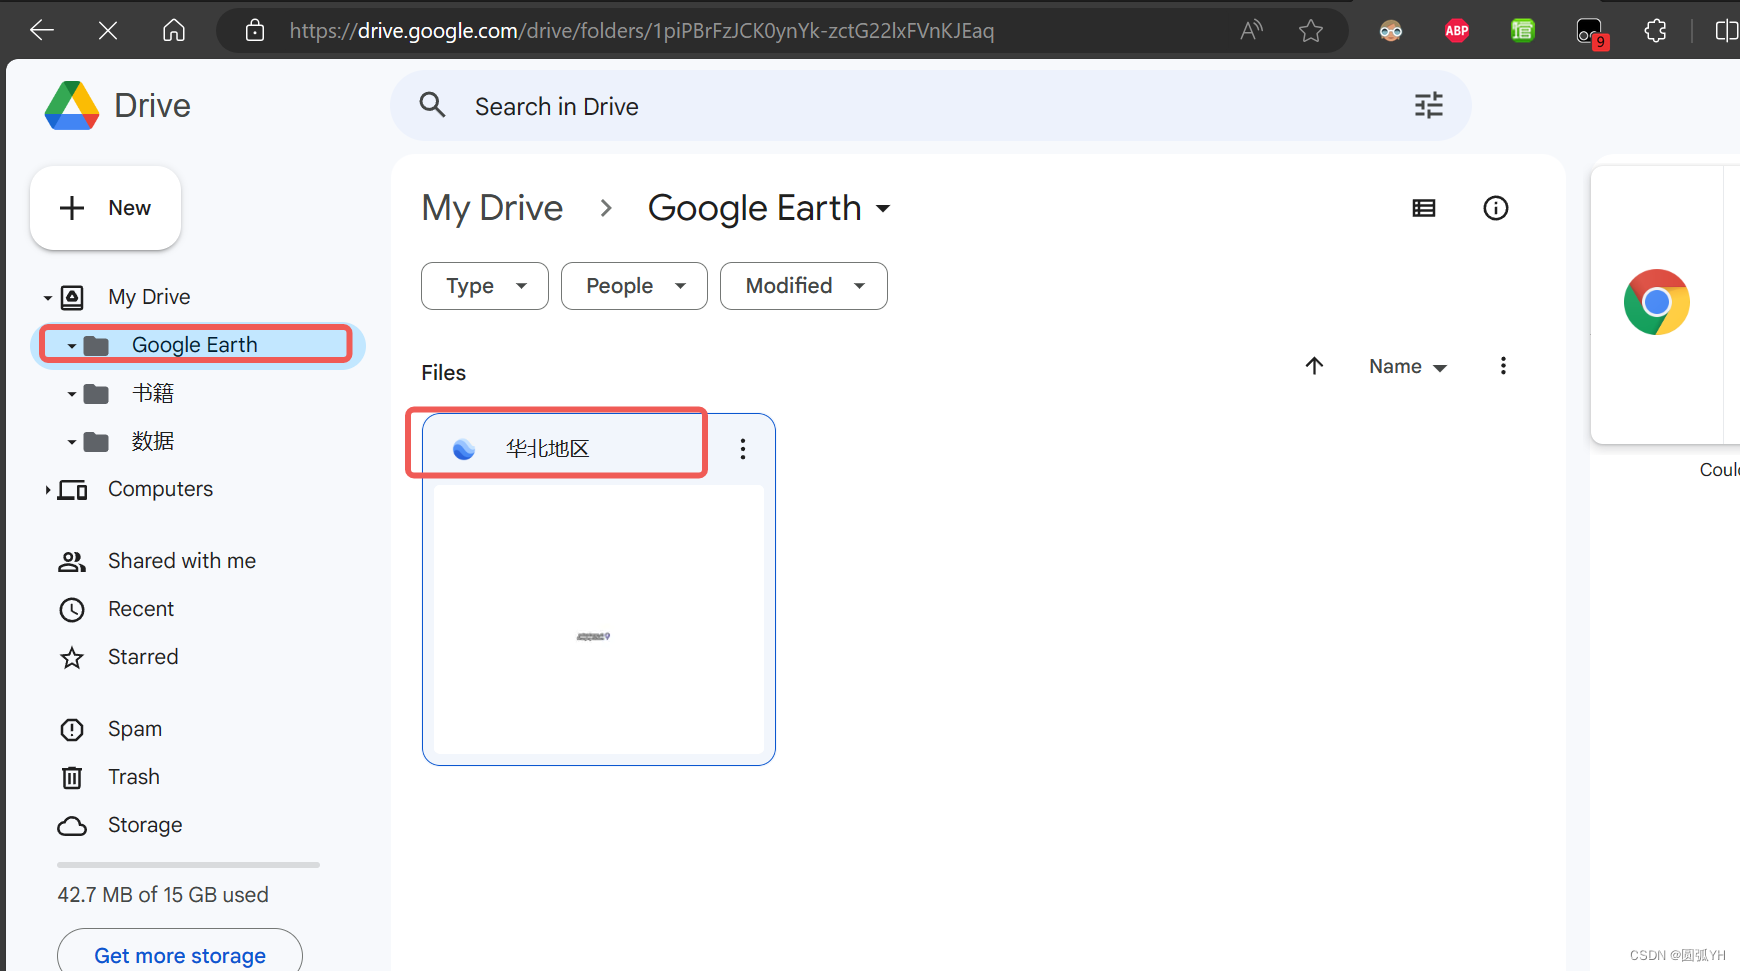
也可以将数据导出到本地。如图进行保存操作。
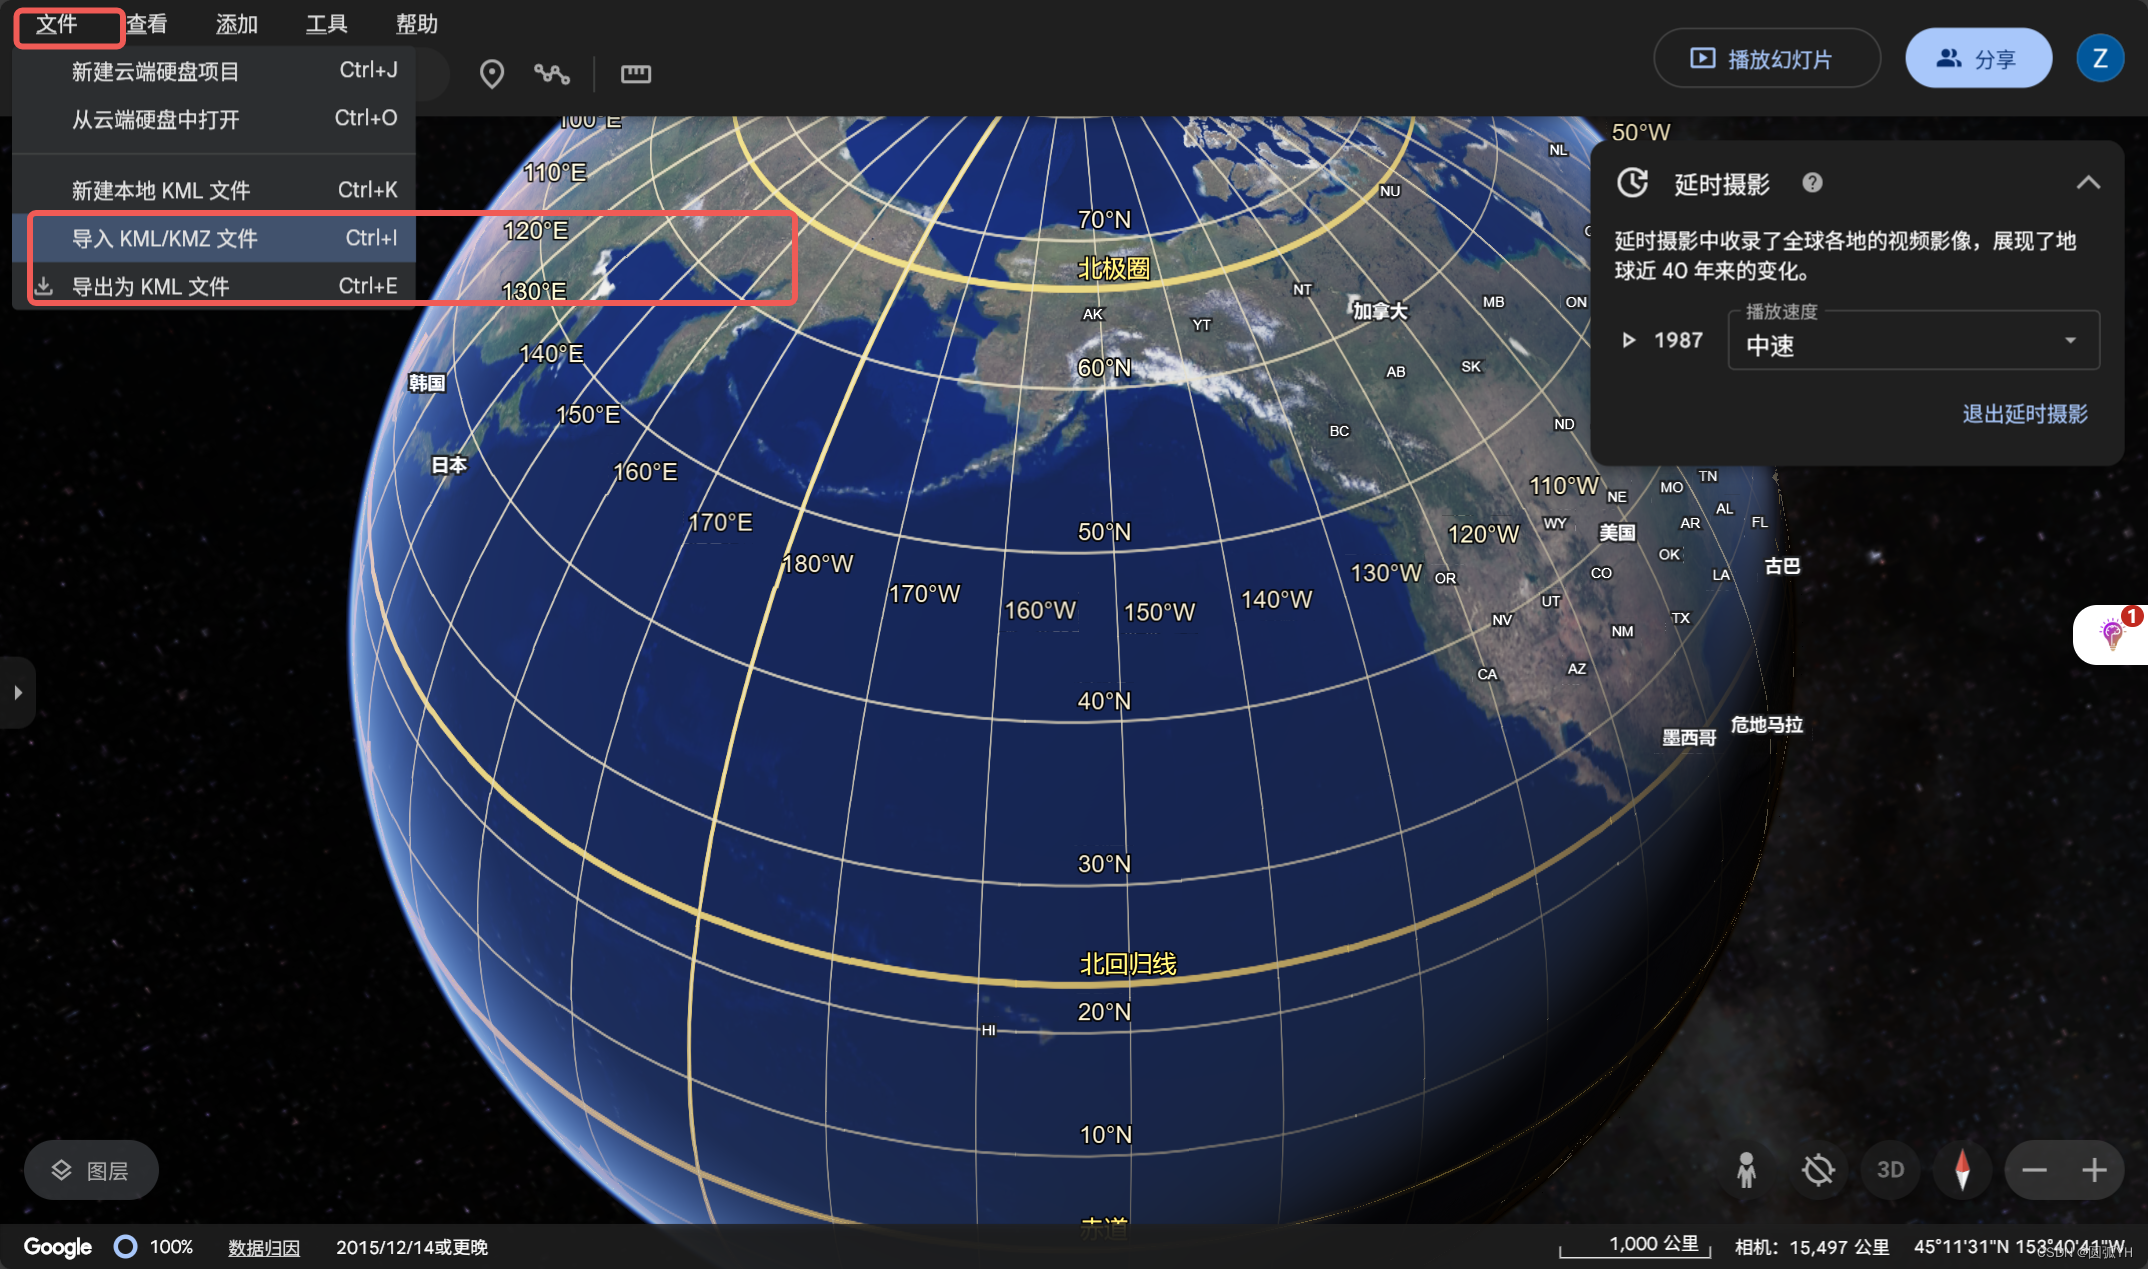
文件为KML文件。
【心得】
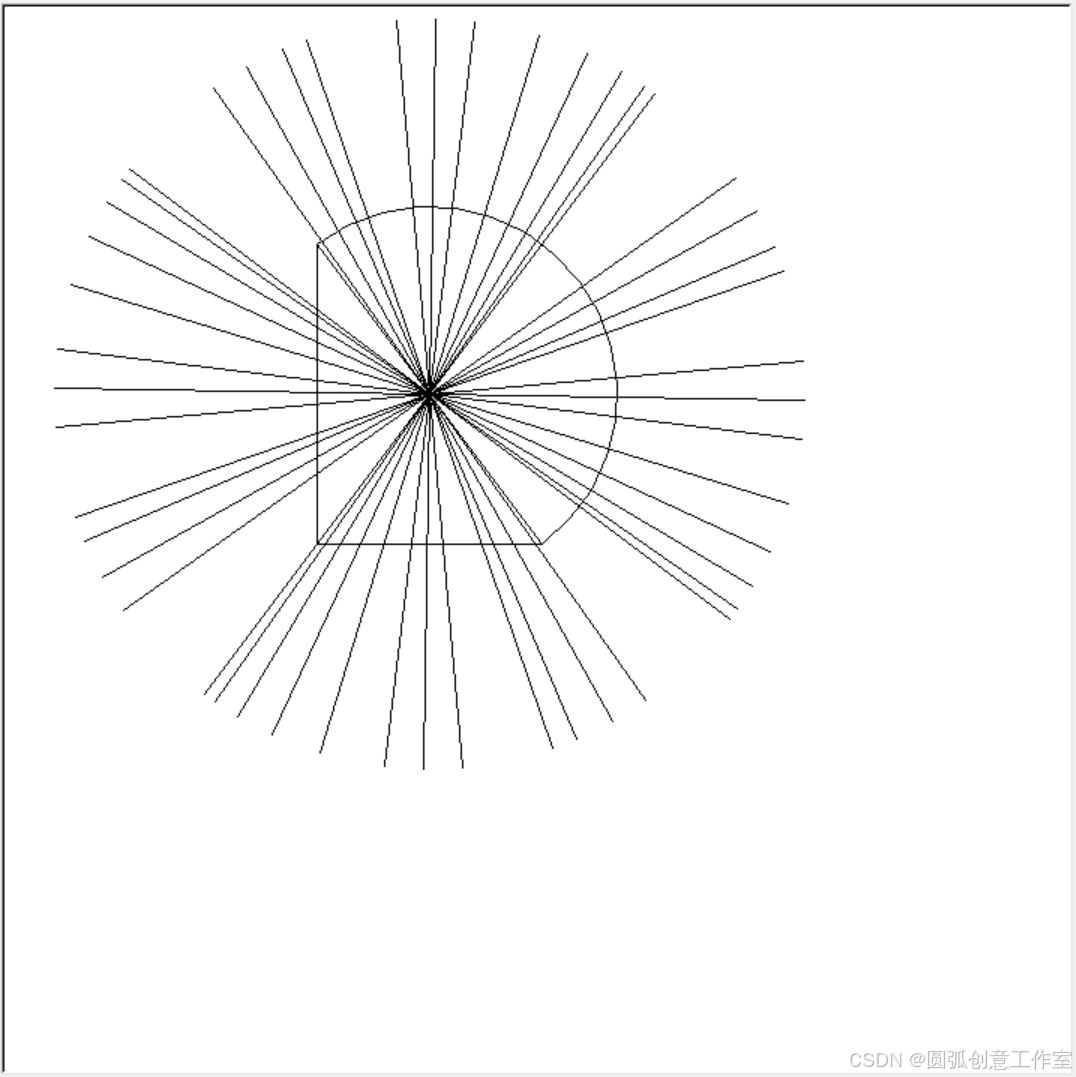
一日一图
代码如下:
import math
import turtle as t

# 计算arctan(4/3)的弧度值
angle_radians = math.atan(3/4)

# 将弧度值转换为度数
angle_degrees = math.degrees(angle_radians)


# 设置画布和画笔
screen = t.Screen()


t.tracer(False)

# 定义直角三角形的边长比例
a = 150  # 较短的直角边
b = 200 # 较长的直角边

# 计算斜边长度
c = math.sqrt(a**2 + b**2)

# 移动到起点
t.penup()
t.goto(0, 0)  # 直角顶点为原点
t.pendown()

# 绘制直角三角形

#t.left(90)  # 左转90度
t.forward(-a)  # 绘制长度为a的直角边

t.left(90)
t.forward(b)  # 绘制长度为b的直角边
t.right(180-angle_degrees)  # 左转90度
t.forward(c)

#以直角顶点为圆心,斜边为半径绘制圆弧
t.penup()
t.goto(0, 0)  # 返回原点
t.pendown()

t.left(90)
t.circle(c/2,180)

#画箭头
t.penup()
t.goto(-a, 0)  # 返回原点
t.pendown()

t.left(90-angle_degrees+90+90-angle_degrees)  # 调整角度,使得经过圆心

t.forward(c/2)

for i in range(1,180):
    t.left(i*2)
    t.forward(c)
    t.goto(-a/2, b/2)

  # 绘制90度的圆弧

# 隐藏画笔
#t.hideturtle()
# 保持窗口
screen.mainloop()
生成图如下:
【心得】


 809
809

 被折叠的 条评论
为什么被折叠?
被折叠的 条评论
为什么被折叠?
 到【灌水乐园】发言


