


核心代码:
 yAxis: {
            min: 0,
            max: 5,
            type: 'value',
            axisLabel: {
                show: true,
                formatter: function (value: any) {
                    return '{' + value + '| }'
                },
                rich: {
                    1: {
                        height: 22,
                        align: 'center',
                        backgroundColor: {
                            image: flowfirst
                        }
                    },
                    2: {
                        height: 22,
                        align: 'center',
                        backgroundColor: {
                            image: flowsecond
                        }
                    },
                    3: {
                        height: 22,
                        align: 'center',
                        backgroundColor: {
                            image: flowthird
                        }
                    },
                    4: {
                        height: 22,
                        align: 'center',
                        backgroundColor: {
                            image: flowfourth
                        }
                    },
                    5: {
                        height: 22,
                        align: 'center',
                        backgroundColor: {
                            image: flowfifth
                        }
                    }
                }
            },
        }
使用formatter和rich实现
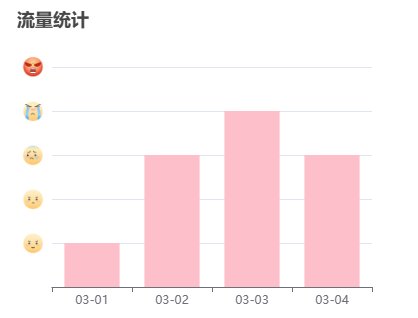
效果展示:


 545
545


 被折叠的 条评论
为什么被折叠?
被折叠的 条评论
为什么被折叠?
 到【灌水乐园】发言


