


代码
# 鸢尾花数据分类-随机森林
# 结果为6个随机森林得到的结果

import numpy as np
import pandas as pd
import matplotlib.pyplot as plt
import matplotlib as mpl
from sklearn.ensemble import RandomForestClassifier


# def iris_type(s):
#     it = {'Iris-setosa': 0, 'Iris-versicolor': 1, 'Iris-virginica': 2}
#     return it[s]

# 'sepal length', 'sepal width', 'petal length', 'petal width'
iris_feature = u'花萼长度', u'花萼宽度', u'花瓣长度', u'花瓣宽度'

if __name__ == "__main__":

    mpl.rcParams['font.sans-serif'] = [u'SimHei']  # 黑体 FangSong/KaiTi
    mpl.rcParams['axes.unicode_minus'] = False

    path = 'iris.data'  # 数据文件路径
    data = pd.read_csv(path, header=None)
    x_prime = data[range(4)]
    y = pd.Categorical(data[4]).codes
    # 特征两两组合,共6个
    feature_pairs = [[0, 1], [0, 2], [0, 3], [1, 2], [1, 3], [2, 3]]

    plt.figure(figsize=(10, 9), facecolor='#FFFFFF')
    for i, pair in enumerate(feature_pairs):
        # 准备数据
        x = x_prime[pair]

        # 随机森林
        # 随机森林有200个决策树,最大深度为3
        clf = RandomForestClassifier(n_estimators=200, criterion='entropy', max_depth=3)
        clf.fit(x, y.ravel())

        # 画图
        N, M = 50, 50  # 横纵各采样多少个值
        x1_min, x2_min = x.min()
        x1_max, x2_max = x.max()
        t1 = np.linspace(x1_min, x1_max, N)
        t2 = np.linspace(x2_min, x2_max, M)
        # np.meshgridL:生成网格点坐标矩阵
        x1, x2 = np.meshgrid(t1, t2)
        x_test = np.stack((x1.flat, x2.flat), axis=1)  # 测试点

        # 训练集上的预测结果
        y_hat = clf.predict(x)
        y = y.reshape(-1)
        c = np.count_nonzero(y_hat == y)    # 统计预测正确的个数
        print('特征:  ', iris_feature[pair[0]], ' + ', iris_feature[pair[1]])
        print('\t预测正确数目:', c)
        print('\t准确率: %.2f%%' % (100 * float(c) / float(len(y))))

        # 显示
        cm_light = mpl.colors.ListedColormap(['#A0FFA0', '#FFA0A0', '#A0A0FF'])
        cm_dark = mpl.colors.ListedColormap(['g', 'r', 'b'])
        y_hat = clf.predict(x_test)  # 预测值
        y_hat = y_hat.reshape(x1.shape)  # 使之与输入的形状相同
        plt.subplot(2, 3, i+1)

        # plt.pcolormesh的作用在于能够直观表现出分类边界;plt.pcolormesh()会根据y_predict的结果自动在cmap里选择颜色
        plt.pcolormesh(x1, x2, y_hat, cmap=cm_light)  # 预测值
        plt.scatter(x[pair[0]], x[pair[1]], c=y, edgecolors='k', cmap=cm_dark)  # 样本
        plt.xlabel(iris_feature[pair[0]], fontsize=14)
        plt.ylabel(iris_feature[pair[1]], fontsize=14)
        plt.xlim(x1_min, x1_max)
        plt.ylim(x2_min, x2_max)
        plt.grid()
    plt.tight_layout(2.5)
    plt.subplots_adjust(top=0.92)
    plt.suptitle(u'随机森林对鸢尾花数据的两特征组合的分类结果', fontsize=18)
    plt.show()
运行结果
特征:   花萼长度  +  花萼宽度		预测正确数目: 124		准确率: 82.67%
特征:   花萼长度  +  花瓣长度		预测正确数目: 142		准确率: 94.67%
特征:   花萼长度  +  花瓣宽度		预测正确数目: 144		准确率: 96.00%
特征:   花萼宽度  +  花瓣长度		预测正确数目: 143		准确率: 95.33%
特征:   花萼宽度  +  花瓣宽度		预测正确数目: 144		准确率: 96.00%
特征:   花瓣长度  +  花瓣宽度		预测正确数目: 145		准确率: 96.67%

过拟合分析-决策树深度的影响
随机森林算法在随机决策树生成过程采用的Boostrap,所以在一棵树的生成过程并不会使用所有的样本,未使用的样本就叫(Out_of_bag)袋外样本(oob 数据集),通过袋外样本,可以评估这个树的准确度,其他子树叶按这个原理评估,最后可以取平均值。
oob_score = True:表示使用 oob 数据集作为测试数据集,估算算法的泛化能力;
oob_score 默认为 False,不使用 oob 数据集作为测试数据集。
‘’‘修改上面该部分代码,分别改变max_depth’‘’
 		# 随机森林
        # 随机森林有200个决策树,最大深度为3
        # 使用袋外数据集作为测试数据
        clf = RandomForestClassifier(n_estimators=200, criterion='entropy', max_depth=3, oob_score=True)
        clf.fit(x, y.ravel())
        print(clf.oob_score_, end='\t')
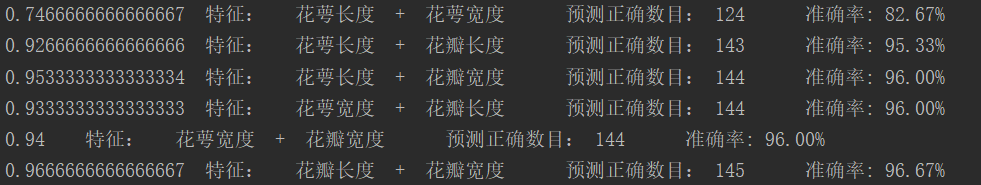
max_depth = 3,没有出现过拟合
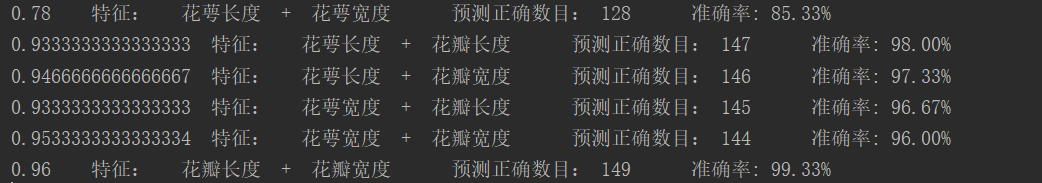
max_depth = 5
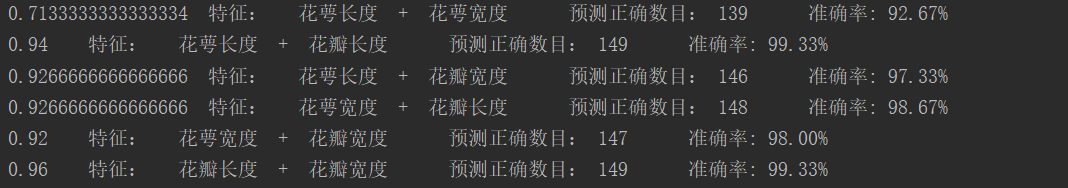
max_depth = 10,出现过拟合


 1864
1864


 被折叠的 条评论
为什么被折叠?
被折叠的 条评论
为什么被折叠?
 到【灌水乐园】发言


