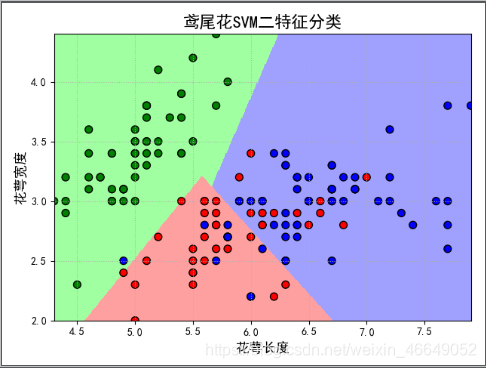
1.鸢尾花SVM-二特征分类
import numpy as np
import pandas as pd
import matplotlib as mpl
import matplotlib.pyplot as plt
from sklearn import svm
from sklearn.model_selection import train_test_split
from sklearn.metrics import accuracy_score
iris_feature = u'花萼长度', u'花萼宽度', u'花瓣长度', u'花瓣宽度'
if __name__ == "__main__":
path = 'iris.data'
data = pd.read_csv(path, header=None)
x, y = data[range(4)], data[4]
y = pd.Categorical(y).codes
x = x[[0, 1]]
x_train, x_test, y_train, y_test = train_test_split(x, y, random_state=1, train_size=0.6)
clf = svm.SVC(C=0.1, kernel='linear', decision_function_shape='ovr')
clf.fit(x_train, y_train.ravel())
print(clf.score(x_train, y_train))
print('训练集准确率:', accuracy_score(y_train, clf.predict(x_train)))
print(clf.score(x_test, y_test))
print('测试集准确率:', accuracy_score(y_test, clf.predict(x_test)))
print('decision_function:\n', clf.decision_function(x_train))
print('\npredict:\n', clf.predict(x_train))
x1_min, x2_min = x.min()
x1_max, x2_max = x.max()
x1, x2 = np.mgrid[x1_min:x1_max:500j, x2_min:x2_max:500j]
grid_test = np.stack((x1.flat, x2.flat), axis=1)
grid_hat = clf.predict(grid_test)
grid_hat = grid_hat.reshape(x1.shape)
mpl.rcParams['font.sans-serif'] = [u'SimHei']
mpl.rcParams['axes.unicode_minus'] = False
cm_light = mpl.colors.ListedColormap(['#A0FFA0', '#FFA0A0', '#A0A0FF'])
cm_dark = mpl.colors.ListedColormap(['g', 'r', 'b'])
plt.figure(facecolor='w')
plt.pcolormesh(x1, x2, grid_hat, cmap=cm_light)
plt.scatter(x[0], x[1], c=y, edgecolors='k', s=50, cmap=cm_dark)
plt.scatter(x_test[0], x_test[1], s=120, facecolors='none', zorder=10)
plt.xlabel(iris_feature[0], fontsize=13)
plt.ylabel(iris_feature[1], fontsize=13)
plt.xlim(x1_min, x1_max)
plt.ylim(x2_min, x2_max)
plt.title(u'鸢尾花SVM二特征分类', fontsize=16)
plt.grid(b=True, ls=':')
plt.tight_layout(pad=1.5)
plt.show()
0.8
训练集准确率: 0.8
0.8
测试集准确率: 0.8
decision_function:
 [[ 2.23327436  0.86782059 -0.2086884 ]
 [-0.18441377  2.18226918  1.01026605]
 [-0.23484387  1.17885164  2.18363523]
 [ 2.21053693  0.99621883 -0.21001569]
 [ 2.23125191  0.90822016 -0.21780963]
 [-0.23548595  1.14446122  2.20715689]
 [ 2.24598673  0.85731286 -0.22467694]
 [-0.19655173  1.12265558  2.15361747]
 [-0.22574542  1.10218037  2.20784054]
 [-0.24414236  1.13665193  2.2237747 ]
 [-0.14561483  2.13979862  1.01688699]
 [-0.23611971  1.09037408  2.2242905 ]
 ...
 [-0.26802028  1.17342522  2.25039591]
 [-0.1733947   2.1703469   1.0125036 ]
 [-0.23014198  1.16636152  2.18411744]
 [-0.2225925   1.11935467  2.19740337]
 [-0.24306957  1.19895557  2.1826614 ]
 [-0.24414236  1.13665193  2.2237747 ]
 [ 2.20641253  0.96238077 -0.19995171]]

predict:
 [0 1 2 0 0 2 0 2 2 2 1 2 2 0 1 2 2 1 2 1 0 0 0 2 0 1 2 2 0 0 1 0 2 2 2 2 1
 2 2 1 0 1 0 1 2 0 2 0 0 2 1 2 0 0 2 0 1 0 2 0 0 2 0 1 0 1 1 0 0 1 0 2 2 0
 2 1 1 2 1 0 0 1 2 2 1 2 2 2 2 0]

2.SVM多分类方法:One/One or One/Other
import matplotlib as mpl
import matplotlib.pyplot as plt
import numpy as np
from scipy import stats
from sklearn import svm
from sklearn.metrics import accuracy_score
def extend(a, b, r):
x = a - b
m = (a + b) / 2
return m - r * x / 2, m + r * x / 2
if __name__ == "__main__":
np.random.seed(0)
N = 20
x = np.empty((4 * N, 2))
means = [(-1, 1), (1, 1), (1, -1), (-1, -1)]
sigmas = [np.eye(2), 2 * np.eye(2), np.diag((1, 2)), np.array(((2, 1), (1, 2)))]
for i in range(4):
mn = stats.multivariate_normal(means[i], sigmas[i] * 0.3)
x[i * N:(i + 1) * N, :] = mn.rvs(N)
a = np.array((0, 1, 2, 3)).reshape((-1, 1))
y = np.tile(a, N).flatten()
print('x=\n', x)
print('y=\n', y)
clf = svm.SVC(C=1, kernel='rbf', gamma=1, decision_function_shape='ovo')
clf.fit(x, y)
y_hat = clf.predict(x)
acc = accuracy_score(y, y_hat)
np.set_printoptions(suppress=True)
print(u'预测正确的样本个数:%d,正确率:%.2f%%' % (round(acc * 4 * N), 100 * acc))
print('decision_function = \n', clf.decision_function(x))
print('预测值为', y_hat)
x1_min, x2_min = np.min(x, axis=0)
x1_max, x2_max = np.max(x, axis=0)
x1_min, x1_max = extend(x1_min, x1_max, 1.05)
x2_min, x2_max = extend(x2_min, x2_max, 1.05)
x1, x2 = np.mgrid[x1_min:x1_max:500j, x2_min:x2_max:500j]
x_test = np.stack((x1.flat, x2.flat), axis=1)
y_test = clf.predict(x_test)
y_test = y_test.reshape(x1.shape)
cm_light = mpl.colors.ListedColormap(['#FF8080', '#A0FFA0', '#6060FF', '#F080F0'])
cm_dark = mpl.colors.ListedColormap(['r', 'g', 'b', 'm'])
mpl.rcParams['font.sans-serif'] = [u'SimHei']
mpl.rcParams['axes.unicode_minus'] = False
plt.figure(facecolor='w')
plt.pcolormesh(x1, x2, y_test, cmap=cm_light)
plt.scatter(x[:, 0], x[:, 1], s=40, c=y, cmap=cm_dark, alpha=0.7)
plt.xlim((x1_min, x1_max))
plt.ylim((x2_min, x2_max))
plt.grid(b=True)
plt.tight_layout(pad=2.5)
plt.title(u'SVM多分类方法:One/One or One/Other', fontsize=18)
plt.show()
预测正确的样本个数:69,正确率:86.25%
[[ 0.00041835  1.0003916   1.25158694  1.03912429  1.06272462  0.06194409]
 [ 0.73619309  0.99992928  1.00035655  1.01254723  1.0001967  -0.0689392 ]
 [-0.15399317  0.73429473  0.85195011  1.02091686  0.54511927 -0.30394945]
 [ 1.00009974  1.13669234  1.42106961  0.90744317  0.60940832 -0.33678376]
 ...
 [-0.04075745 -0.20137817 -1.13175539 -0.16447164 -1.12270726 -1.13341774]
 [ 0.01171865  0.02596605 -0.99995753  0.02779846 -1.00003287 -1.00026606]
 [-0.570479   -0.40889005 -0.99989226  0.26580403


 本文详细介绍了SVM的应用,从二特征分类的鸢尾花数据开始,探讨了SVM的多分类策略、参数调优、处理不平衡数据的方法,以及在手写图片识别和MINIST数字识别中的应用。还涉及了SVR预测和时间序列分析,最后讨论了SVM的RBF核与过拟合问题。
 最低0.47元/天 解锁文章


 1182
1182

 被折叠的 条评论
为什么被折叠?


