


hold on
plot(cos(0:pi/20:2*pi),'*-');
plot(sin(0:pi/20:2*pi),'+ g--');
hold off

x = 0:0.5:4*pi;
y = sin(x);
h = cos(x);
w = 1./(1+exp(-x));
g = (1/(2*pi*2)^0.5).*exp((-1.*(x-2*pi).^2)./(2*2^2));
plot(x,y,'bd-',x,h,'gp-',x,w,'ro-',x,g,'c^-')
legend('sin(x)','cos(x)','sigmoid','gauss function');
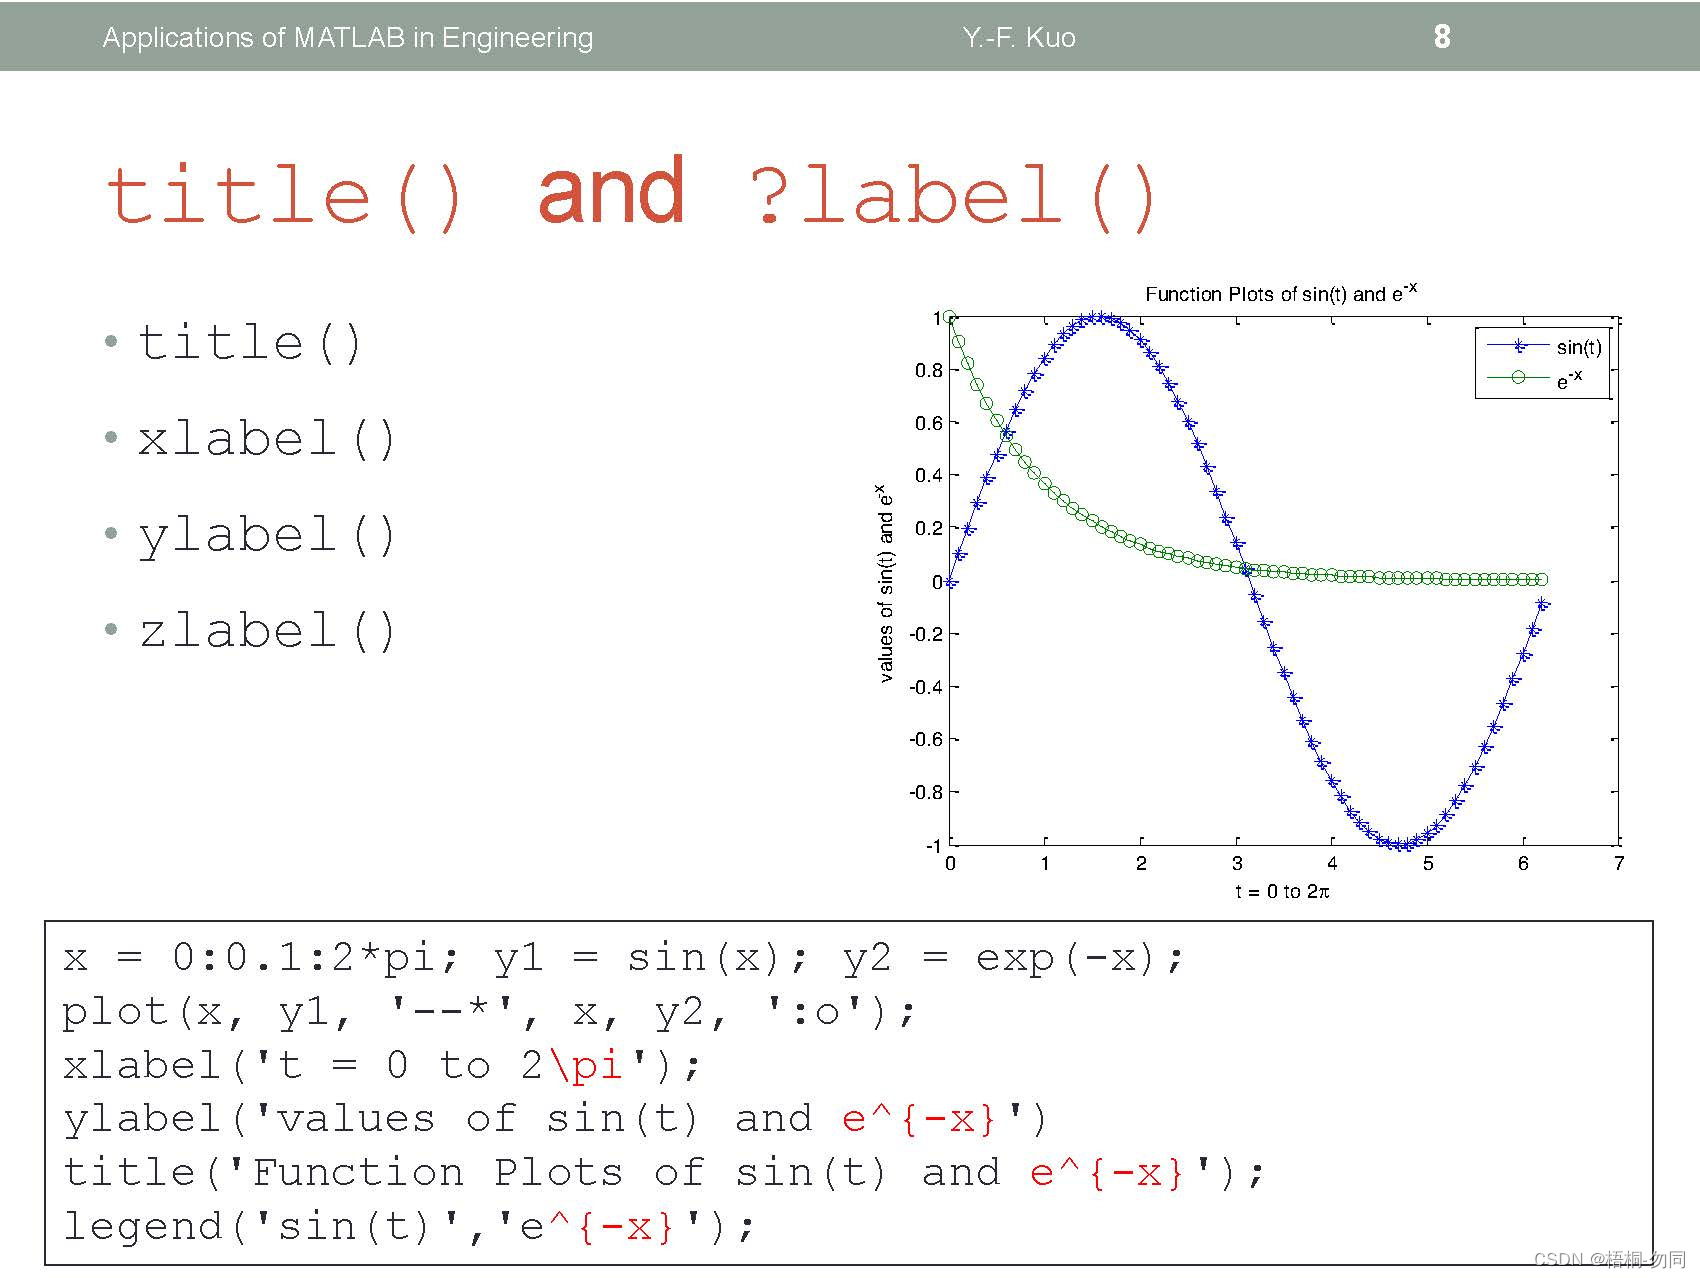
x = 0:0.1:2*pi;
y1 = sin(x);
y2 = exp(-x);
plot(x,y1,'--*',x,y2,':o');
xlabel('t = 0 to 2\pi');
ylabel('values of sin(t) and e^{-x}');
title('Fnction Plots of sin(t) and e^{-x}');
legend('sin(t)','e^{-x}');
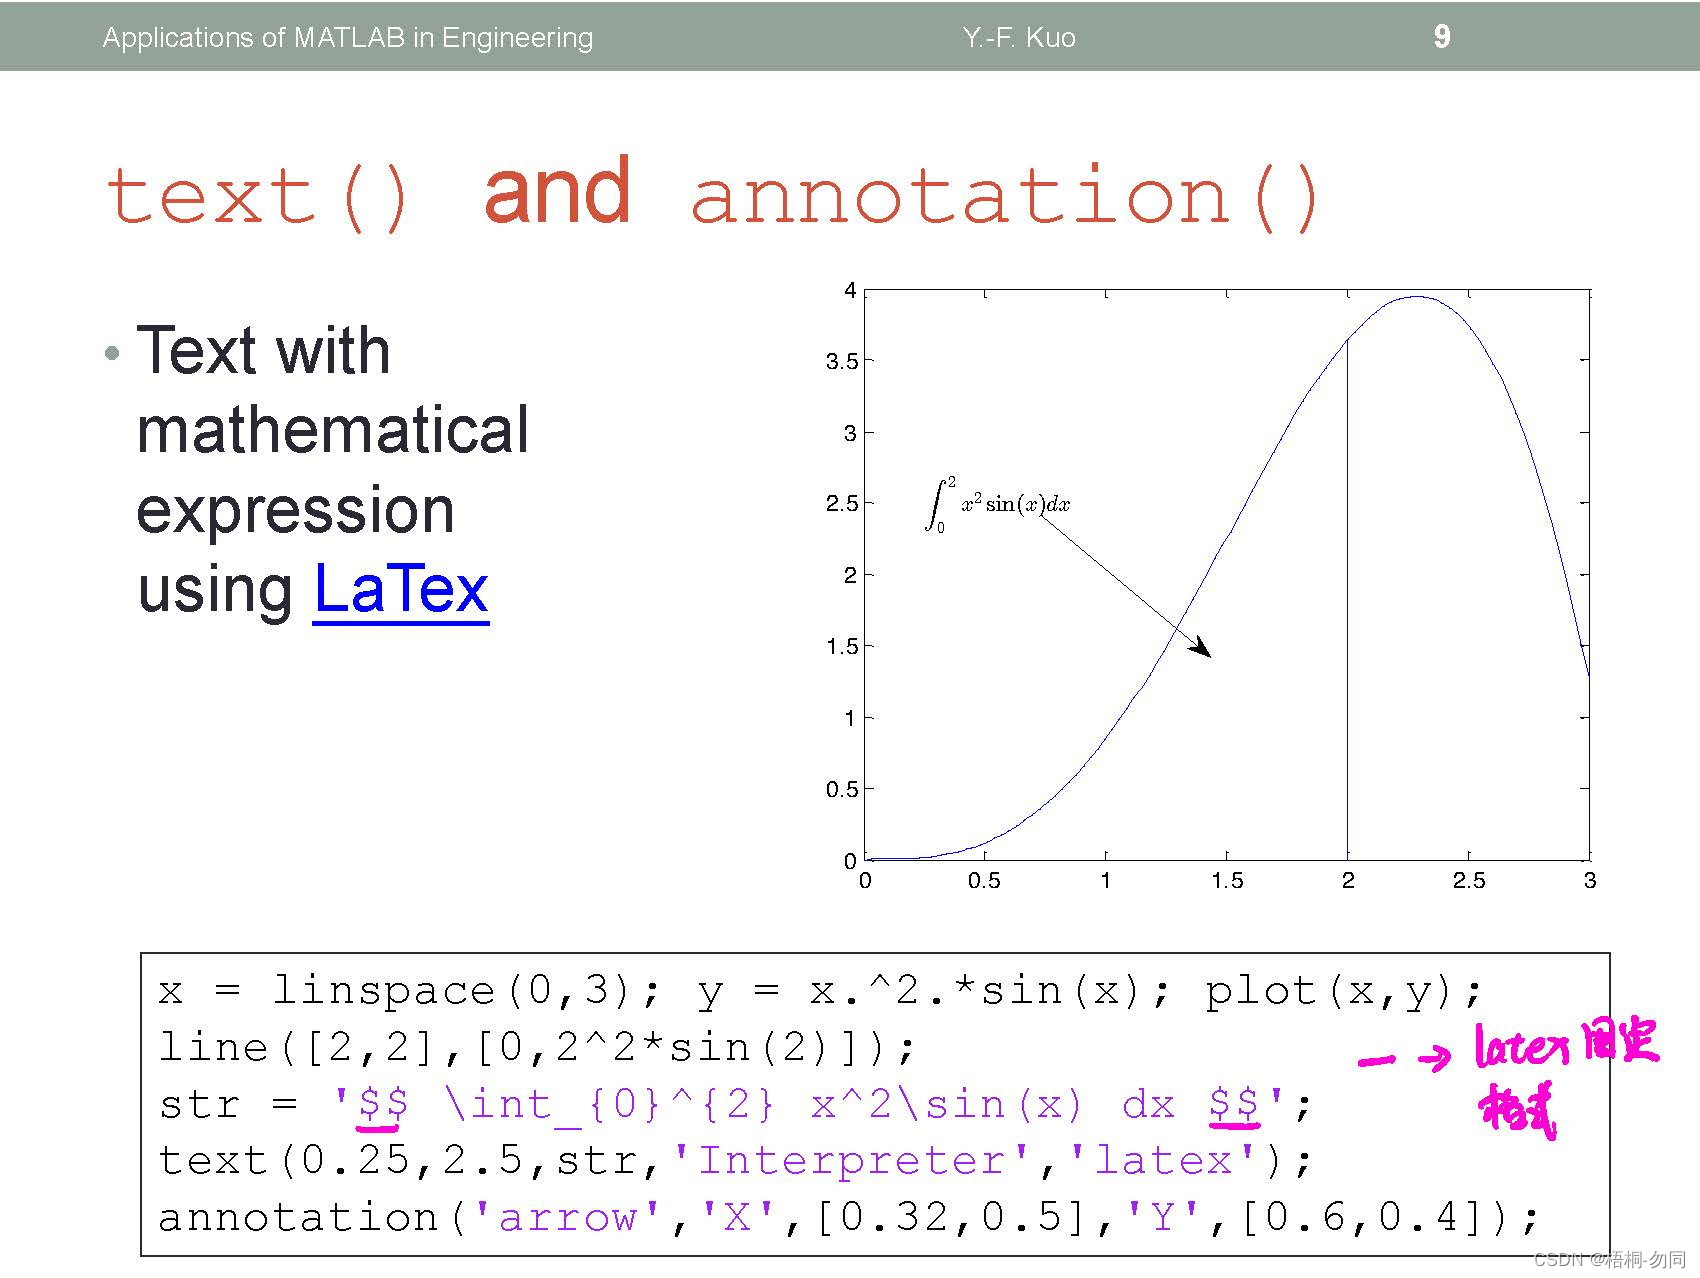
x = linspace(0,3);
y = x.^x.*sin(x);
plot(x,y);
line([2,2],[0,2^2*sin(2)]);
str = '$$ \int_{0}^{2}x^2\sin(x)dx $$';
text(0.25,2.5,str,'Interpreter','latex');
annotation('arrow','X',[0.32,0.5],'Y',[0.6,0.3]);
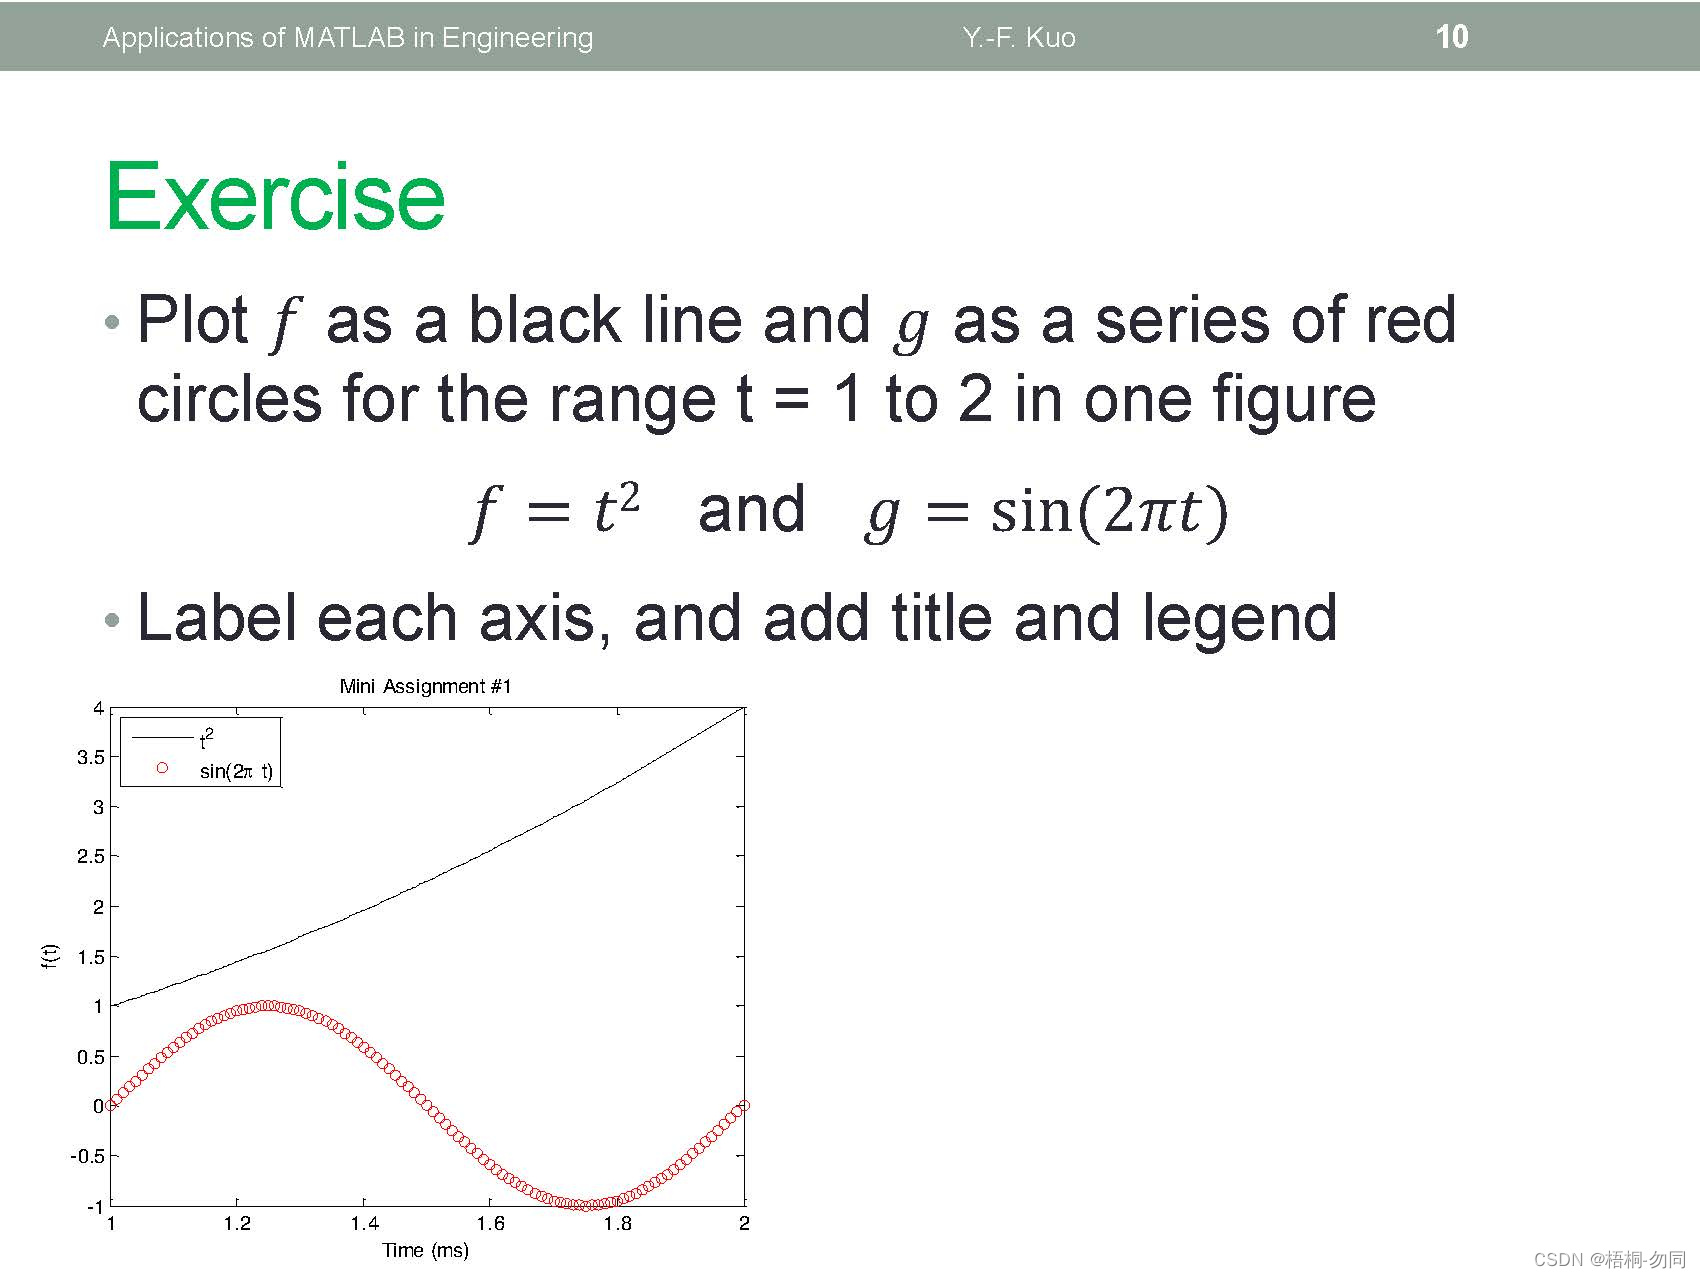
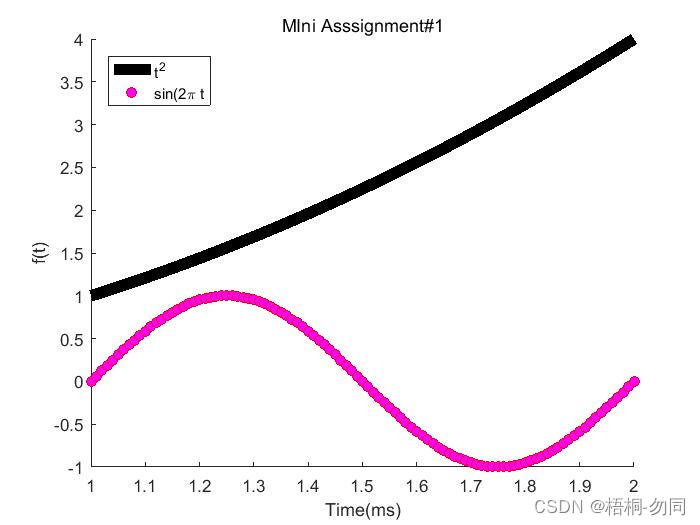
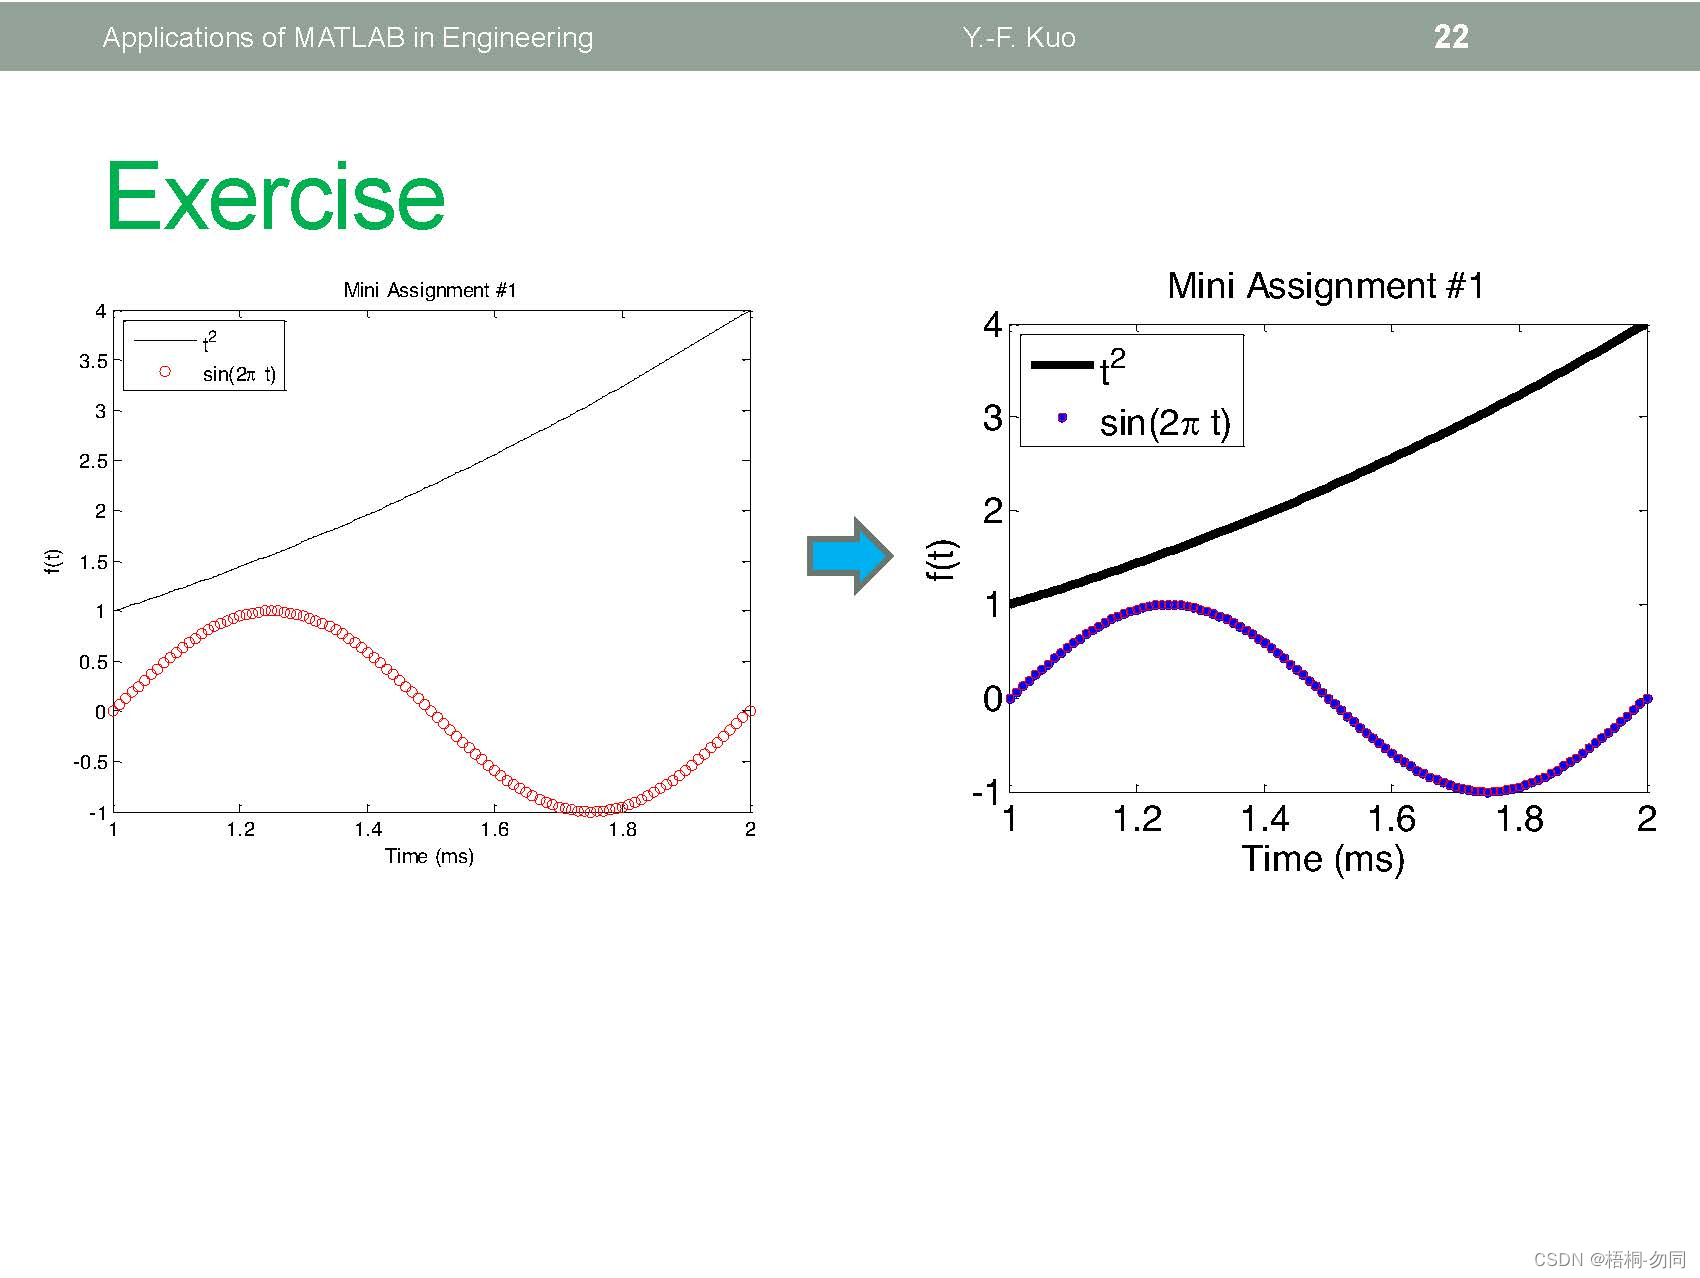
t = 1:0.01:2;
f = t.^2;
g = sin(2.*pi.*t);
hold on
plot(t,f,'k -','LineWidth',7);
plot(t,g,'ro','MarkerFaceColor','m');
xlabel('Time(ms)');
ylabel('f(t)');
legend('t^2','sin(2\pi t','Location','northwest');
title('MIni Asssignment#1');


x = linspace(0,2*pi,1000);
y = sin(x);
plot(x,y);
set(gcf,'Color',[1 1 1]);


x = linspace(0,2*pi,1000);
y = sin(x);
plot(x,y);
h = plot(x,y);
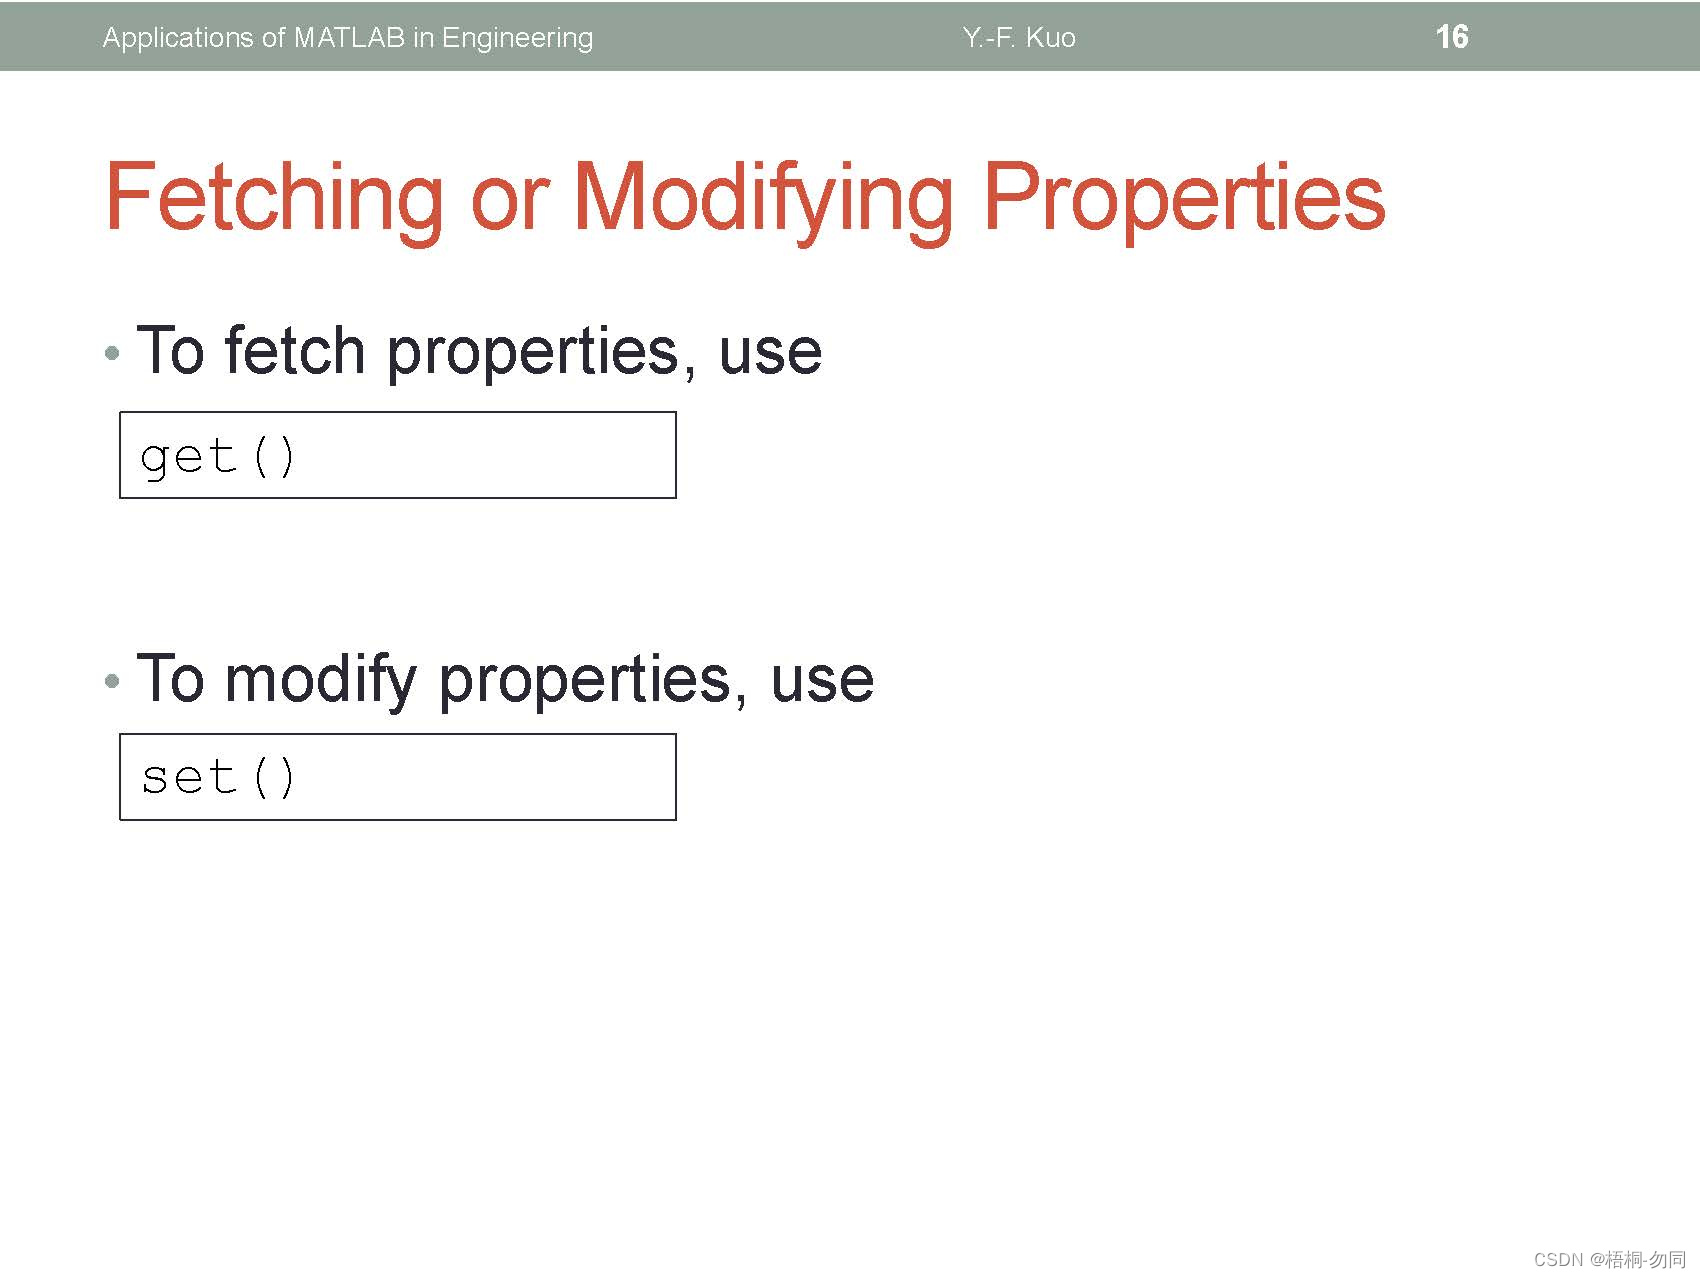
get(h);
get(gca);
set(gca,'XLim',[0,2*pi]);
set(gca,'YLim',[-1.2,1.2]);
set(gca,'FontSize',25);
set(gca,'XTick',0:pi/2:2*pi);
set(gca,'XTickLabel',0:90:360);
set(gca,'XTickLabel',{'0','\pi/2','\pi','3\pi/2','2\pi'});
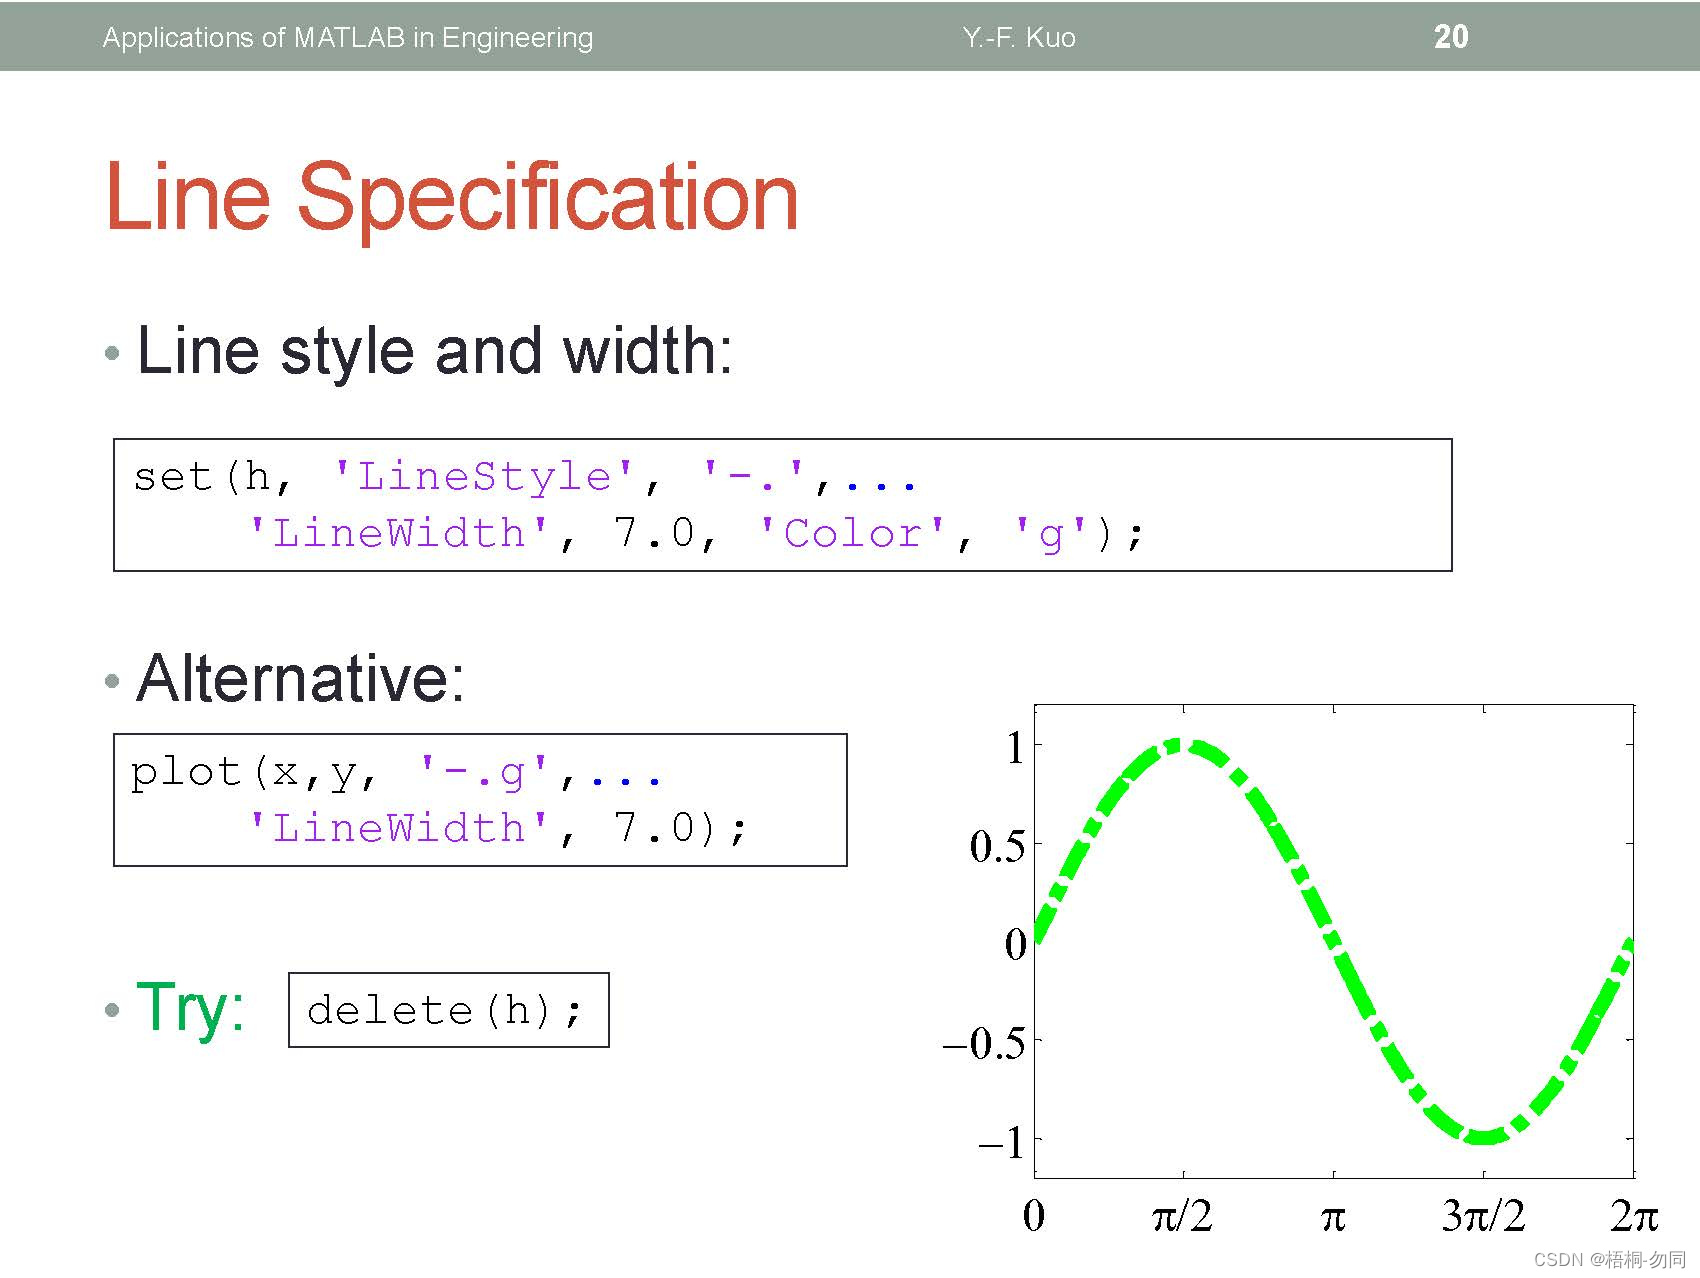
set(h,'LineStyle','-.','LineWidth',7.0,'Color','g');

x = rand(20,1);
set(gca,'FontSize',18);
plot(x,'-md','LineWidth',2,'MarkerEdgeColor','k',...
    'MarkerFaceColor','g','Markersize',10);
xlim([1,20]);


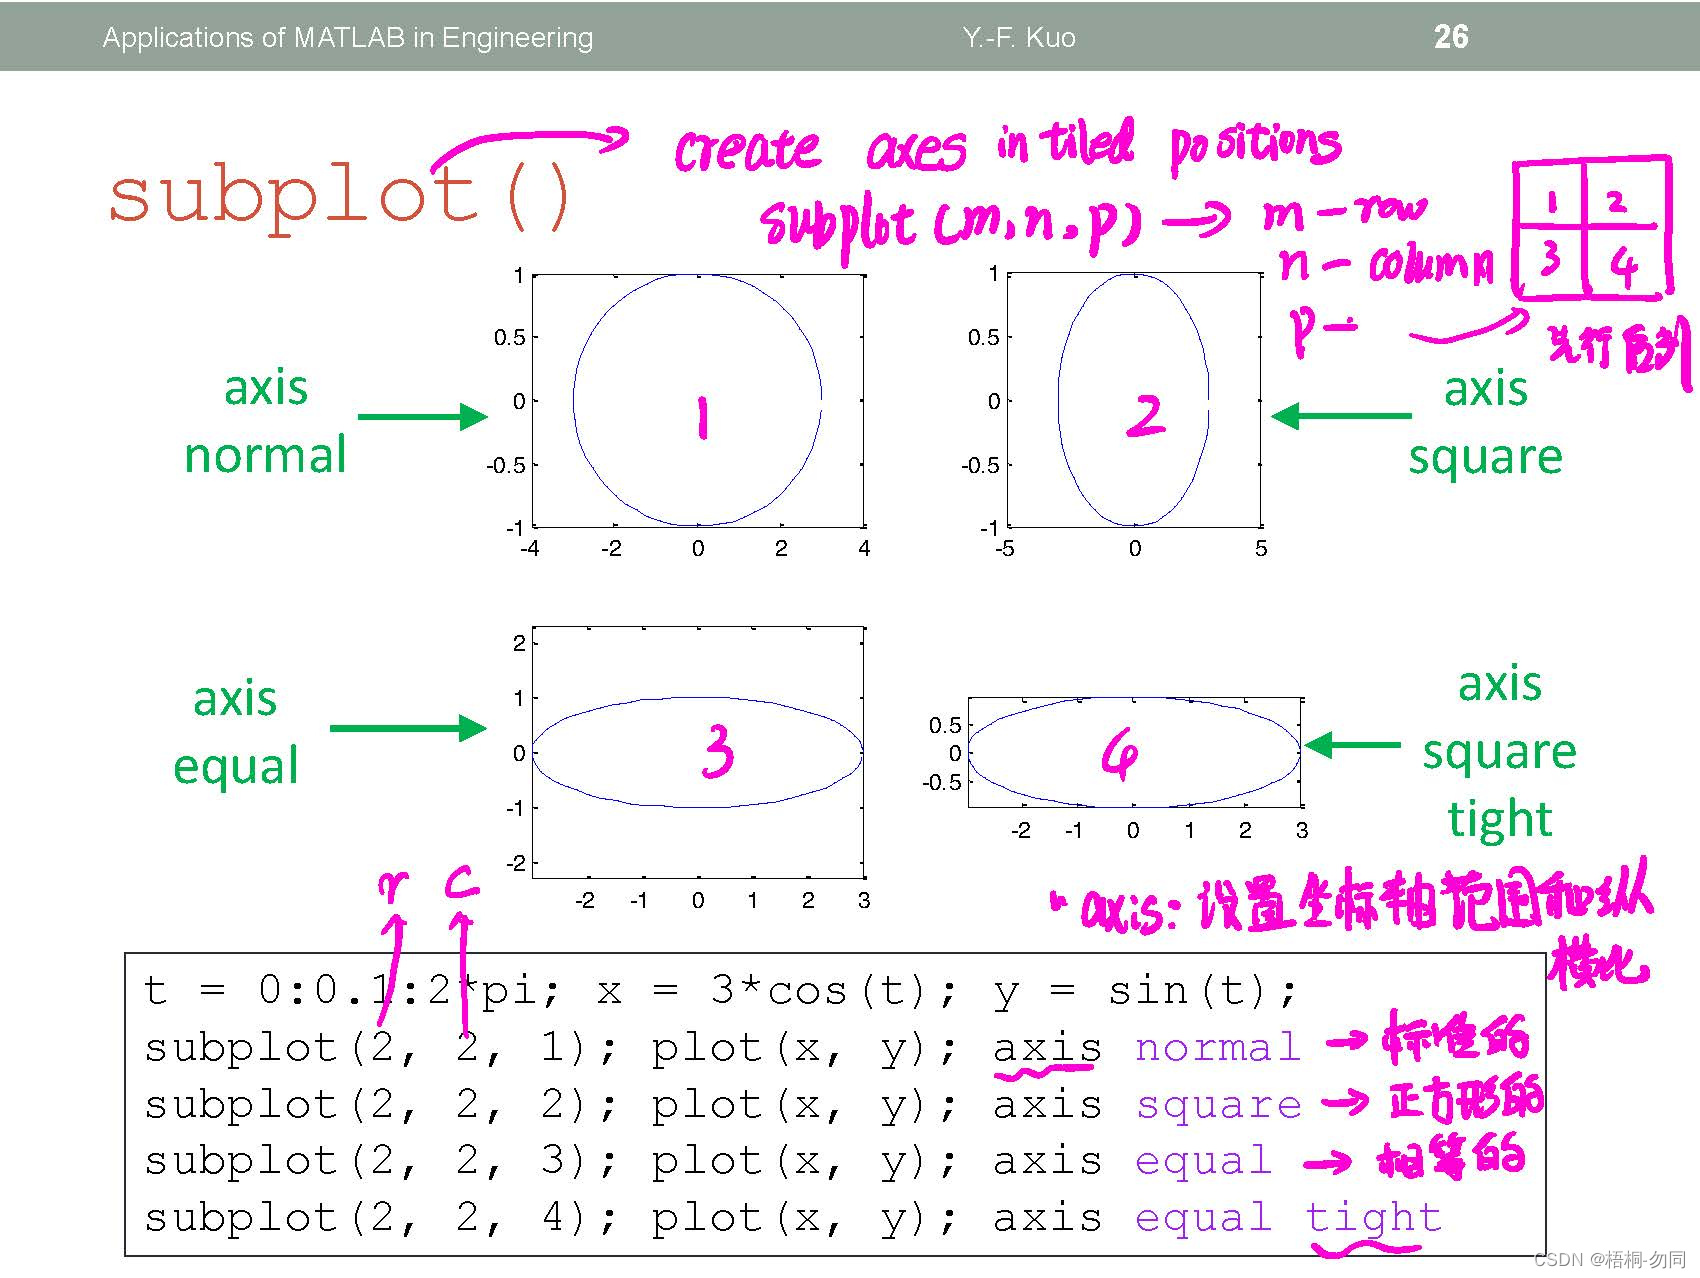
t = 0:0.1:2*pi;
x = 3*cos(t);
y = sin(t);
subplot(2,2,1);
plot(x,y);axis normal
subplot(2,2,2);
plot(x,y);axis square
subplot(2,2,3);
plot(x,y);axis equal
subplot(2,2,4);
plot(x,y);axis equal tight


 235
235


 被折叠的 条评论
为什么被折叠?
被折叠的 条评论
为什么被折叠?
 到【灌水乐园】发言


