import matplotlib.pyplot as plt
plt.rcParams['font.sans-serif'] = ['SimHei']
plt.rcParams['axes.unicode_minus'] = False
绘制TI折线图
def draw_TI(df_TI_night, output_TI_png, sector_id, terrain, label):
"""
Args:
df_TI_night: datafrmae
output_TI_png: 图片保存路径
sector_id: 1,2等,任意
terrain: 地形
label: day or night
Returns:
"""
plt.figure(figsize=(10, 6))
colors = ['royalblue', 'red', 'limegreen', 'mediumpurple', 'cyan', 'darkorange']
for i, category in enumerate(df_TI_night.columns[:6]):
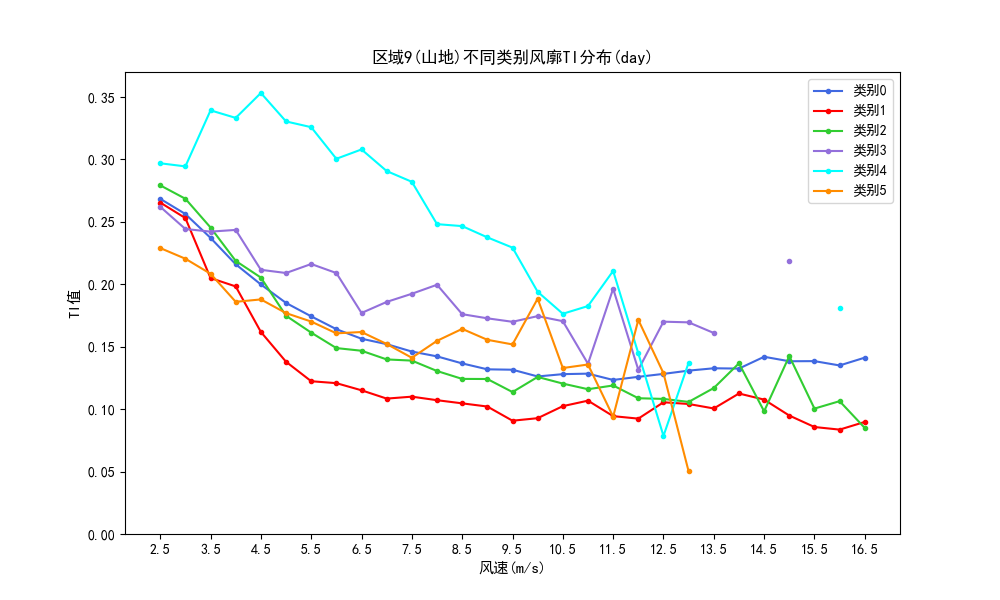
plt.plot(df_TI_night.index[:29], df_TI_night[category].values[:29], label=f'类别{i}', color=colors[i], marker='.')
plt.xlabel('风速(m/s)', fontsize=11)
plt.ylabel('TI值', fontsize=11)
plt.title(f'区域{sector_id}-{terrain}不同类别TI分布({label})')
plt.legend()
plt.xticks(df_TI_night.index[:29][::2])
df_max = round(df_TI_night.iloc[:29, :].max().max(), 1)
if df_max <= 0.3:
ylim = 0.3
else:
ylim = df_max
plt.ylim(0, ylim)
plt.savefig(output_TI_png)
绘制
def draw_day_night(normalized_table, output_day_night_png, sector_id, terrain):
normalized_table_T = normalized_table.T
plt.figure(figsize=(10, 6))
colors = ['c', 'k']
for i, category in enumerate(normalized_table_T.index):
plt.plot(normalized_table_T.columns, normalized_table_T.loc[category], label=category, color=colors[i],
marker='.')
plt.xlabel('风廓线类别', fontsize=11)
plt.ylabel('占比(%)', fontsize=11)
plt.title(f'区域{sector_id}({terrain})不同类别风廓线昼夜分布')
for category in normalized_table_T.index:
for i, value in enumerate(normalized_table_T.loc[category]):
plt.text(i, value, f'{value:.2f}', ha='center', va='bottom', fontsize=10,
color=colors[normalized_table_T.index.get_loc(category)])
plt.legend()
plt.ylim(0, 100)
plt.savefig(output_day_night_png)
plt.close()


 23万+
23万+


 被折叠的 条评论
为什么被折叠?
被折叠的 条评论
为什么被折叠?
 到【灌水乐园】发言


