library(ggpubr)
p1 <- ggplot2::ggplot(mtcars,aes(mpg,hp))+geom_point()
p2 <- ggplot2::ggplot(mtcars,aes(mpg,hp))+geom_point()
p3 <- ggplot2::ggplot(mtcars,aes(mpg,hp))+geom_point()
p4 <- ggplot2::ggplot(mtcars,aes(mpg,hp))+geom_point()
p5 <- ggplot2::ggplot(mtcars,aes(mpg,hp))+geom_point()
p6 <- ggplot2::ggplot(mtcars,aes(mpg,hp))+geom_point()
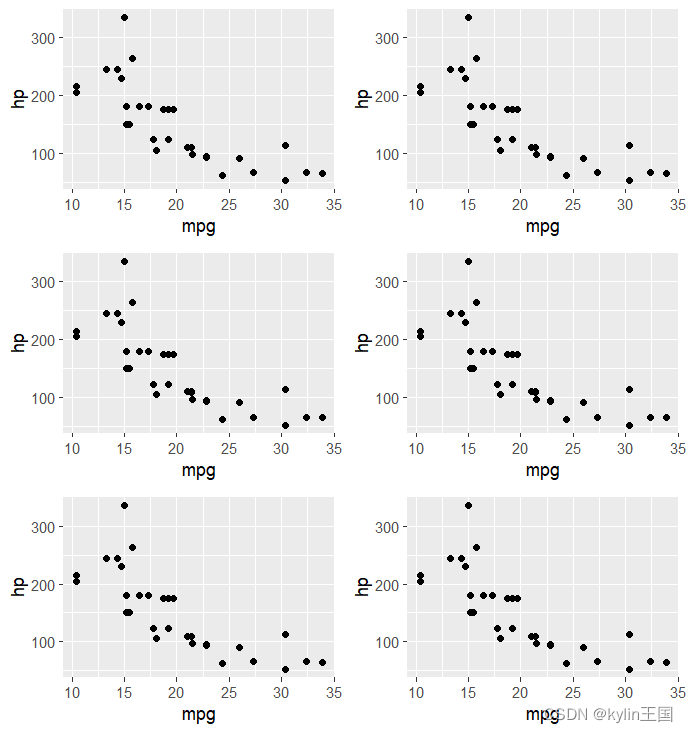
ggarrange(
  p1,
  p2,
  p3,
  p4,
  p5,
  p6,
  ncol = 2,
  nrow = 3,
  widths = c(1, 1),
  heights = c(1, 1, 1)
)
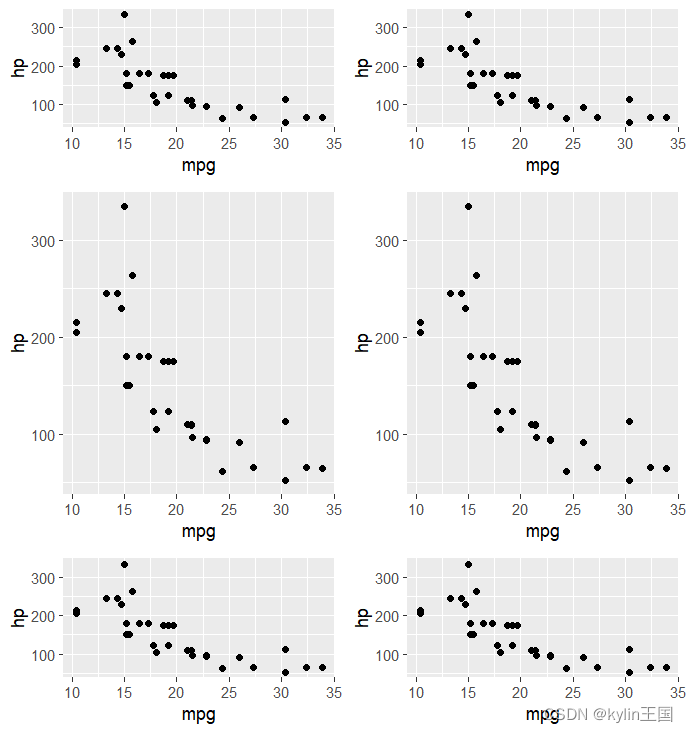
ggarrange(
  p1,
  p2,
  p3,
  p4,
  p5,
  p6,
  ncol = 2,
  nrow = 3,
  widths = c(1, 1),
  heights = c(1, 2, 1)
)
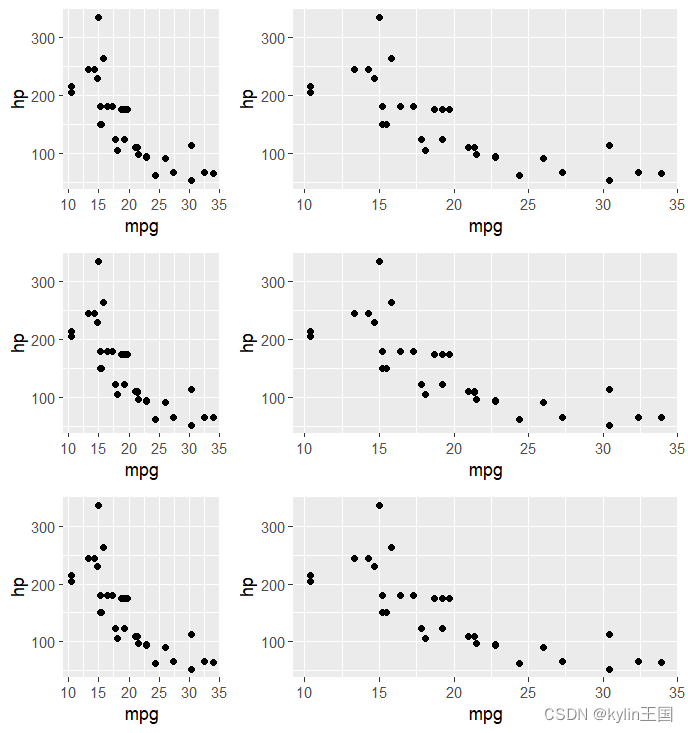
ggarrange(
  p1,
  p2,
  p3,
  p4,
  p5,
  p6,
  ncol = 2,
  nrow = 3,
  widths = c(1, 2),
  heights = c(1, 1, 1)
)


 1416
1416


 被折叠的 条评论
为什么被折叠?
被折叠的 条评论
为什么被折叠?
 到【灌水乐园】发言


