


1、K-MEANS算法介绍
1.1、聚类概念
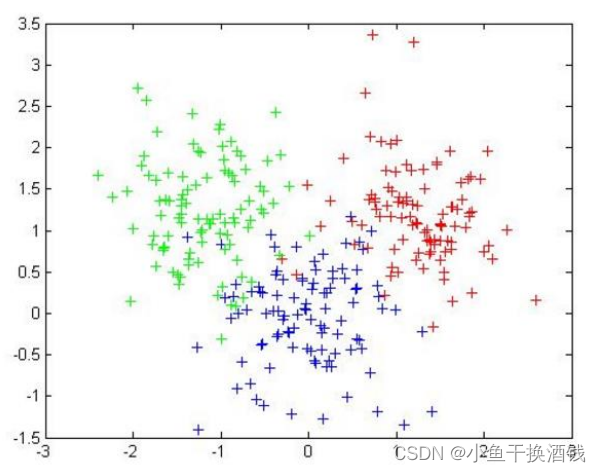
1.2、基本概念
标准化方法最常用的有两种:
- min-max标准化(离差标准化):对原始数据进行线性变换,将结果落到【0,1】区间,转换方法为 X'=(X-min)/(max-min),其中max为样本数据最大值,min为样本数据最小值。
- z-score标准化(标准差标准化):处理后的数据符合标准正态分布(均值为0,方差为1),转换公式:X减去均值,再除以标准差.
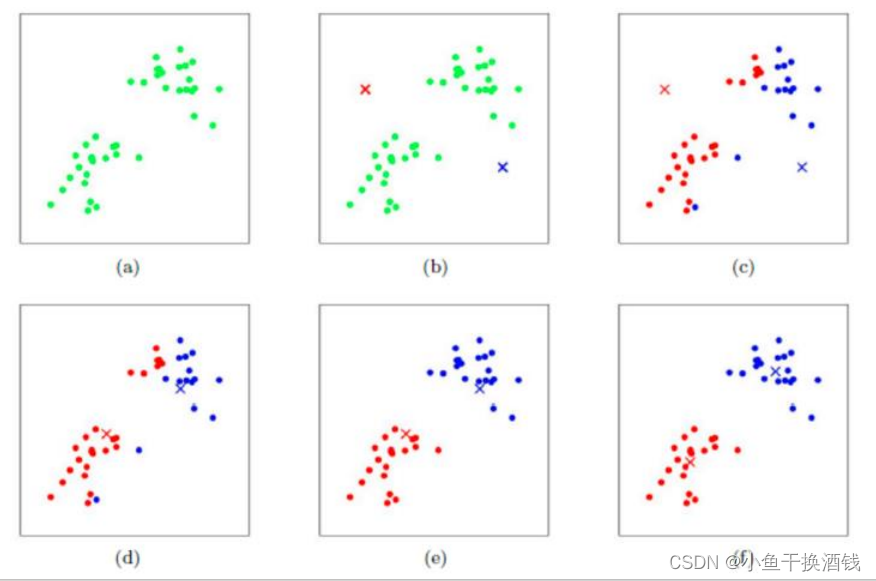
1.3、工作流程
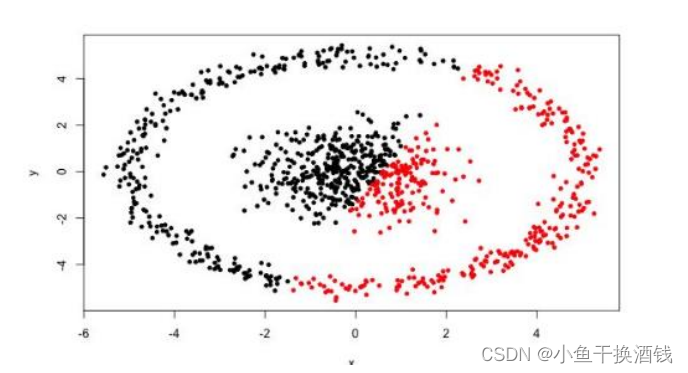
1.4、优劣势
2、代码
2.1、使用Scikit-learn库
使用Python的Scikit-learn库实现K均值聚类
2.1.1、聚类语法
class sklearn.cluster.KMeans(n_clusters=8, , init='k-means++', n_init=10, max_iter=300, tol=0.0001, precompute_distances='deprecated', verbose=0, random_state=None, copy_x=True, n_jobs='deprecated', algorithm='auto')2.1.2、参数解释
n_clusters:簇的个数,即你想聚成几类
init: 初始簇中心的获取方法
n_init: 获取初始簇中心的更迭次数,为了弥补初始质心的影响,算法默认会初始10次质心,实现算法,然后返回最好的结果。
max_iter: 最大迭代次数(因为kmeans算法的实现需要迭代)
tol: 容忍度,即kmeans运行准则收敛的条件
precompute_distances:是否需要提前计算距离,这个参数会在空间和时间之间做权衡,如果是True 会把整个距离矩阵都放到内存中,auto 会默认在数据样本大于featurs*samples 的数量大于12e6 的时候False,False 时核心实现的方法是利用Cpython 来实现的
verbose: 冗长模式
random_state: 随机生成簇中心的状态条件。
copy_x: 对是否修改数据的一个标记,如果True,即复制了就不会修改数据。bool 在scikit-learn 很多接口中都会有这个参数的,就是是否对输入数据继续copy 操作,以便不修改用户的输入数据。这个要理解Python 的内存机制才会比较清楚。
n_jobs: 并行设置
algorithm: kmeans的实现算法,有:‘auto’, ‘full’, ‘elkan’, 其中 'full’表示用EM方式实现
属性:
cluster_centers_:聚类中心点
labels_:每个样本所属的聚类标签
inertia_:样本到其最近的聚类中心的平方距离的总和
n_iter_:运行的迭代次数
方法:
fit(X[,y]):训练样本
fit_predict(X[,y]):计算聚类中心并预测每个样本的聚类索引
fit_transform(X[,y]):计算聚类并将X转换为聚类距离空间
predict(X):预测X中每个样本所属的最近簇。
2.1.3、对鸢尾花数据进行聚类
# 导入所需要的库,绘图库,numpy库,sklearn机器学习库内的数据集,聚类,划分数据集方法
import matplotlib.pyplot as plt
import numpy as np
from sklearn.cluster import KMeans
from sklearn.model_selection import train_test_split
from sklearn.datasets import load_iris
iris=load_iris() # 导入鸢尾花数据集
X = iris.data[:, 2:4] ##表示我们只取特征空间中的后两个维度
y = iris.target # 将鸢尾花的标签赋值给y
X_train, X_test, y_train, y_test = train_test_split(X, y, test_size=0.3, random_state=42) # 划分鸢尾花数据集,其中训练集占70%,测试集占30%
#绘制数据分布图
plt.scatter(X[:, 0], X[:, 1], c = "red", marker='o', label='iris')
plt.xlabel('petal length')
plt.ylabel('petal width')
plt.legend(loc=2)
plt.show()
estimator = KMeans(n_clusters=3) # 构造聚类器,将样本聚于3类
estimator.fit(X_train) # 开始聚类
label_pred = estimator.labels_ # 获取聚类标签
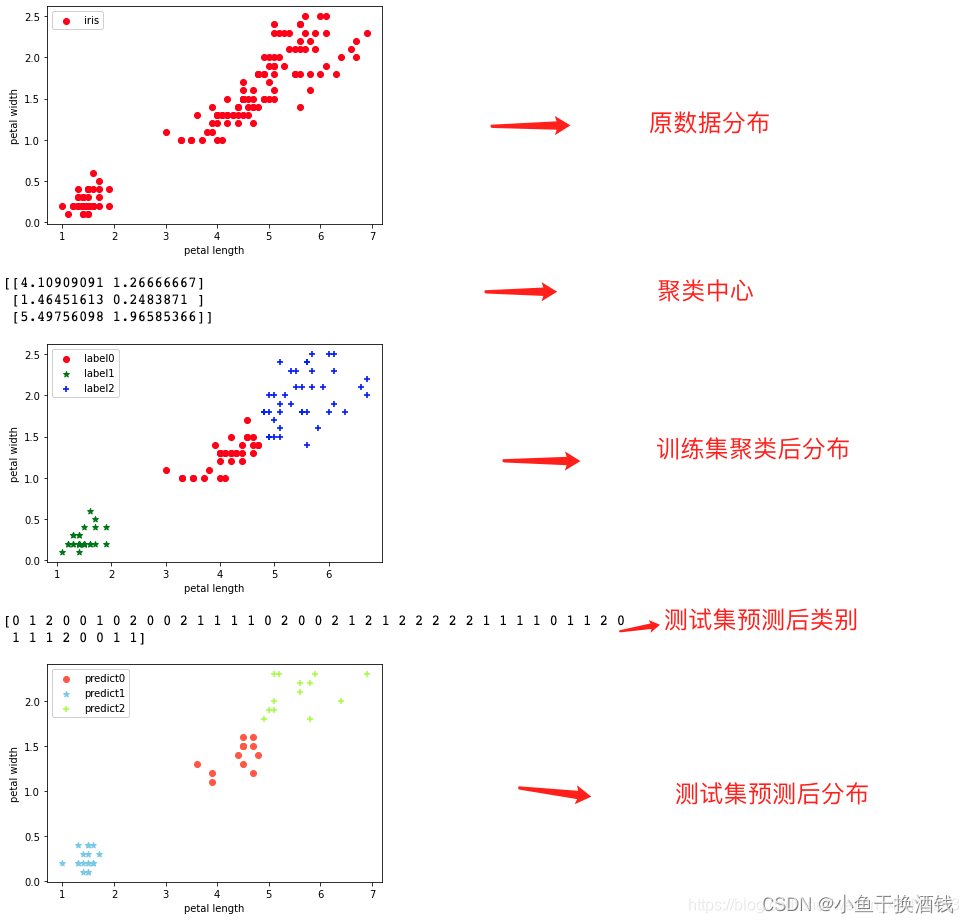
print(estimator.cluster_centers_) # 获取聚类中心点
#绘制k-means结果,将训练集聚类后的结果绘图展示,三种颜色表示三类,红色表示第一类,绿色表示第二类,蓝色表示第三类
x0 = X_train[label_pred == 0]
x1 = X_train[label_pred == 1]
x2 = X_train[label_pred == 2]
plt.scatter(x0[:, 0], x0[:, 1], c = "red", marker='o', label='label0')
plt.scatter(x1[:, 0], x1[:, 1], c = "green", marker='*', label='label1')
plt.scatter(x2[:, 0], x2[:, 1], c = "blue", marker='+', label='label2')
plt.xlabel('petal length') # 坐标轴属性
plt.ylabel('petal width')
plt.legend(loc=2)
plt.show()
print(estimator.predict(X_test)) # 使用训练出的KMeans模型预测测试集中的数据属于哪一类
#绘制k-means预测结果,将测试集集聚类后的结果绘图展示,三种颜色表示三类,橘色表示第一类,天蓝色表示第二类,蓝绿色表示第三类。
predict_0=X_test[estimator.predict(X_test) == 0]
predict_1=X_test[estimator.predict(X_test) == 1]
predict_2=X_test[estimator.predict(X_test) == 2]
plt.scatter(predict_0[:, 0], predict_0[:, 1], c = "tomato", marker='o', label='predict0')
plt.scatter(predict_1[:, 0], predict_1[:, 1], c = "skyblue", marker='*', label='predict1')
plt.scatter(predict_2[:, 0], predict_2[:, 1], c = "greenyellow", marker='+', label='predict2')
plt.xlabel('petal length')
plt.ylabel('petal width')
plt.legend(loc=2)
plt.show()
输出结果:
2.2、手写K-MEANS算法
①数据格式
sepal_length,sepal_width,petal_length,petal_width,class
5.1,3.5,1.4,0.2,SETOSA
4.9,3.0,1.4,0.2,SETOSA
7.0,3.2,4.7,1.4,VERSICOLOR
6.4,3.2,4.5,1.5,VERSICOLOR
6.3,3.3,6.0,2.5,VIRGINICA
5.8,2.7,5.1,1.9,VIRGINICA
②主函数类
import numpy as np
import pandas as pd
import matplotlib.pyplot as plt
from k_means import KMeans
data = pd.read_csv('../data/iris.csv')
iris_types = ['SETOSA','VERSICOLOR','VIRGINICA']
x_axis = 'petal_length'
y_axis = 'petal_width'
# figure:图
# 表示figure 的大小为宽、长(单位为inch)
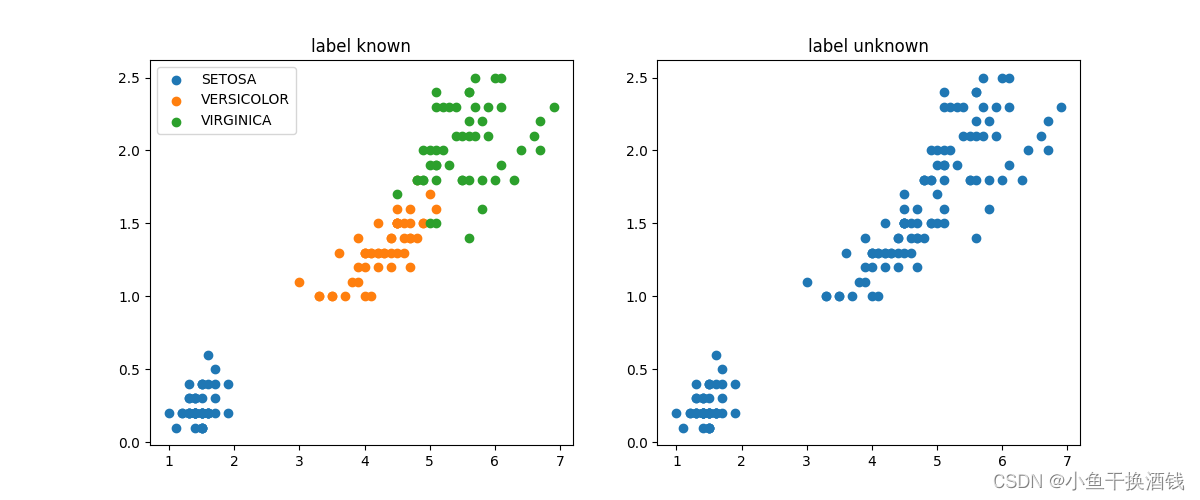
plt.figure(figsize=(12,5))
# 表示整个figure分成1行2列,共2个子图,这里子图在第一行第一列
plt.subplot(1,2,1)
for iris_type in iris_types:
plt.scatter(data[x_axis][data['class']==iris_type],data[y_axis][data['class']==iris_type],label = iris_type)
plt.title('label known')
plt.legend()
# 这里子图在第一行第二列
plt.subplot(1,2,2)
plt.scatter(data[x_axis][:],data[y_axis][:])
plt.title('label unknown')
plt.show()
num_examples = data.shape[0]
x_train = data[[x_axis,y_axis]].values.reshape(num_examples,2)
# 指定好训练所需的参数
# 分为3类,可调整
num_clusters = 3
max_iteritions = 50
k_means = KMeans(x_train,num_clusters)
centroids,closest_centroids_ids = k_means.train(max_iteritions)
# 对比结果
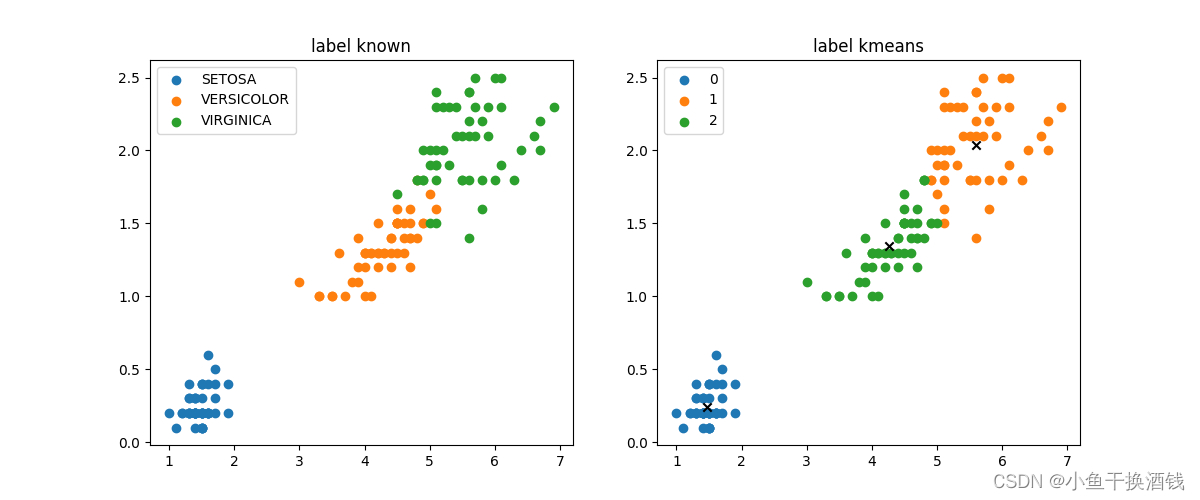
plt.figure(figsize=(12,5))
plt.subplot(1,2,1)
for iris_type in iris_types:
plt.scatter(data[x_axis][data['class']==iris_type],data[y_axis][data['class']==iris_type],label = iris_type)
plt.title('label known')
plt.legend()
plt.subplot(1,2,2)
for centroid_id, centroid in enumerate(centroids):
current_examples_index = (closest_centroids_ids == centroid_id).flatten()
plt.scatter(data[x_axis][current_examples_index],data[y_axis][current_examples_index],label = centroid_id)
for centroid_id, centroid in enumerate(centroids):
plt.scatter(centroid[0],centroid[1],c='black',marker = 'x')
plt.legend()
plt.title('label kmeans')
plt.show()③K-MEANS类 k-means.py
import numpy as np

class KMeans:
    def __init__(self,data,num_clustres):
        self.data = data
        self.num_clustres = num_clustres

    def train(self,max_iterations):
        # 1.先随机选择K个中心点
        centroids = KMeans.centroids_init(self.data,self.num_clustres)
        # 2.开始训练
        num_examples = self.data.shape[0]
        closest_centroids_ids = np.empty((num_examples,1))
        for _ in range(max_iterations):
            # 3得到当前每一个样本点到K个中心点的距离,找到最近的
            closest_centroids_ids = KMeans.centroids_find_closest(self.data,centroids)
            # 4.进行中心点位置更新
            centroids = KMeans.centroids_compute(self.data,closest_centroids_ids,self.num_clustres)
        return centroids,closest_centroids_ids

    @staticmethod
    def centroids_init(data,num_clustres):
        num_examples = data.shape[0]
        # 产生一个 0到num_examples 的乱序数组,且不重复
        random_ids = np.random.permutation(num_examples)
        centroids = data[random_ids[:num_clustres],:]
        return centroids
    @staticmethod
    def centroids_find_closest(data,centroids):
        num_examples = data.shape[0]
        num_centroids = centroids.shape[0]
        closest_centroids_ids = np.zeros((num_examples,1))
        for example_index in range(num_examples):
            distance = np.zeros((num_centroids,1))
            for centroid_index in range(num_centroids):
                distance_diff = data[example_index,:] - centroids[centroid_index,:]
                distance[centroid_index] = np.sum(distance_diff**2)
            # np.argmin:给出水平方向最小值的下标
            closest_centroids_ids[example_index] = np.argmin(distance)
        return closest_centroids_ids
    @staticmethod
    def centroids_compute(data,closest_centroids_ids,num_clustres):
        num_features = data.shape[1]
        centroids = np.zeros((num_clustres,num_features))
        for centroid_id in range(num_clustres):
            closest_ids = closest_centroids_ids == centroid_id
            # 计算属于同一类的数据的平均值来作为该类新的中心点
            centroids[centroid_id] = np.mean(data[closest_ids.flatten(),:],axis=0)
        return centroids
④结果
运行前的对比
运行后的对比
3、想法
机器学习的K均值算法很简单,只需要简单的数据公式计算欧式距离就行了。
最后,觉得有帮助或者有点收获的话,帮忙点个赞吧!


 1216
1216


 被折叠的 条评论
为什么被折叠?
被折叠的 条评论
为什么被折叠?
 到【灌水乐园】发言


