


mumpy 、random
import numpy as np
import seaborn as sns
import matplotlib.pyplot as plt
from scipy import stats
np.random.seed(1234)
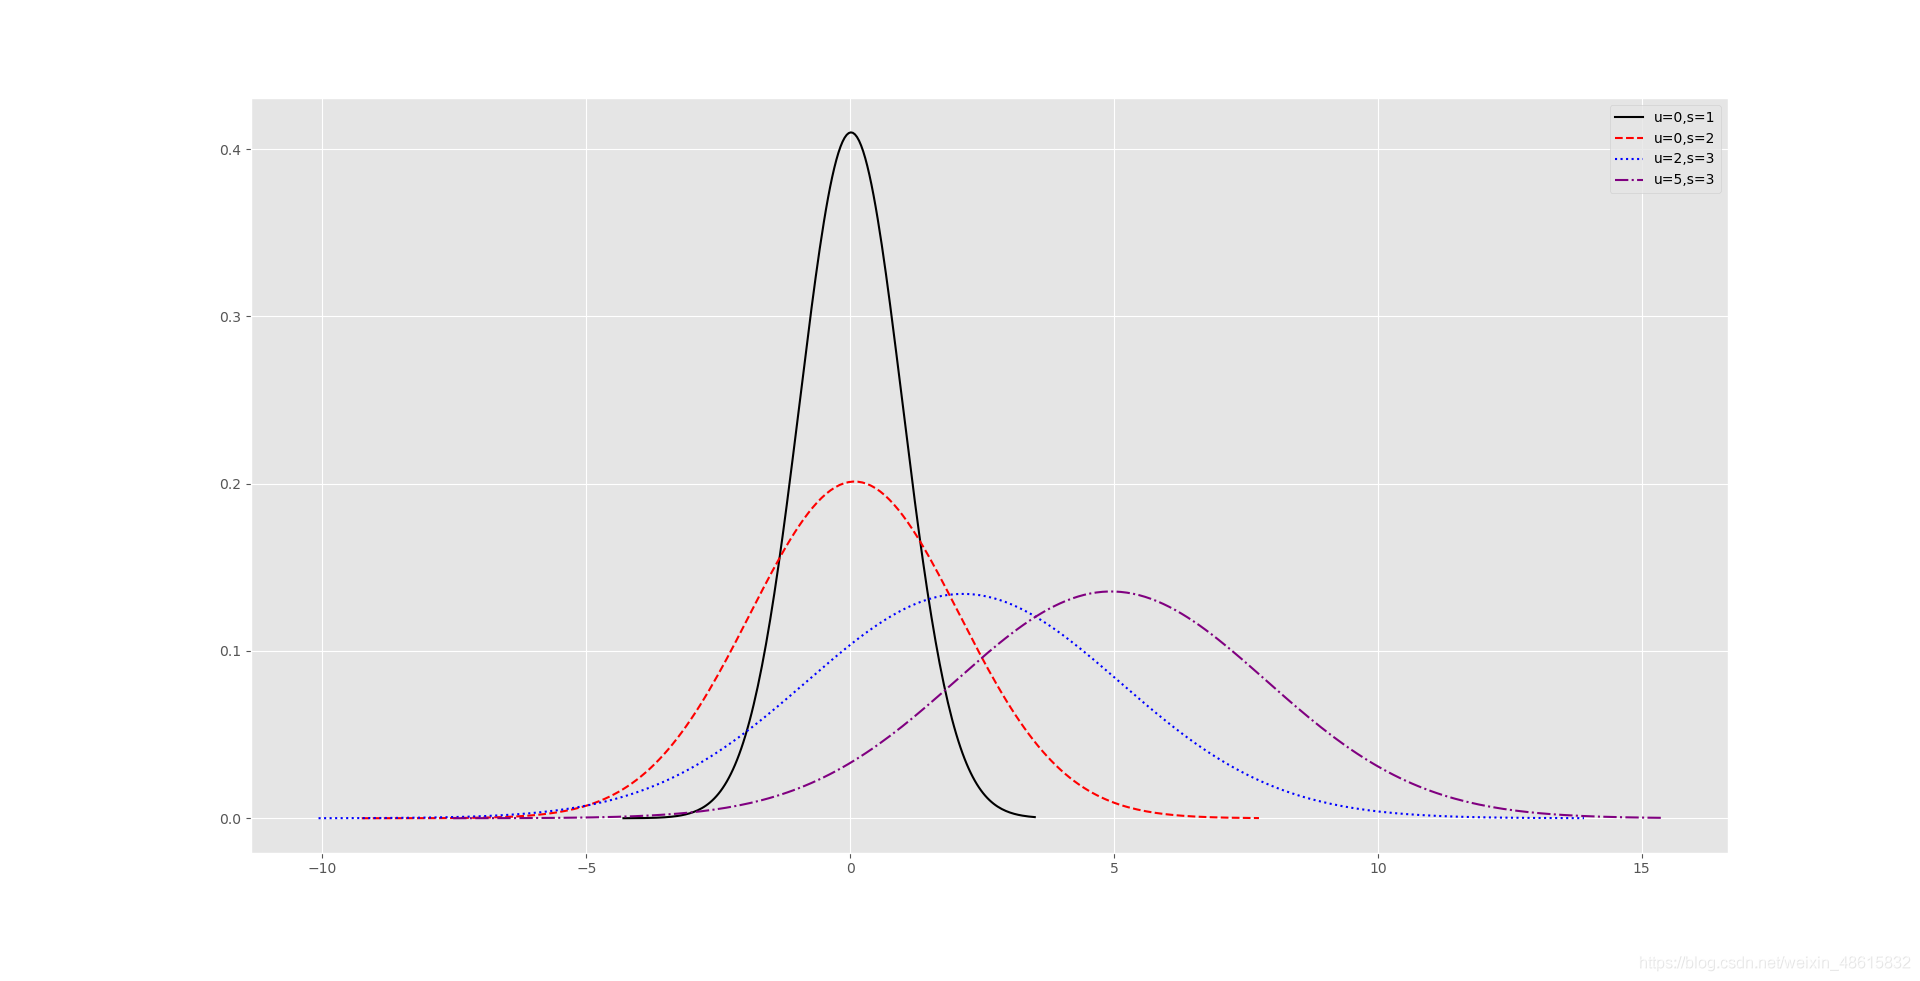
rn1 = np.random.normal(loc = 0, scale = 1, size = 1000)
rn2 = np.random.normal(loc = 0, scale = 2, size = 1000)
rn3 = np.random.normal(loc = 2, scale = 3, size = 1000)
rn4 = np.random.normal(loc = 5, scale = 3, size = 1000)
#绘图
plt.style.use('ggplot')
sns.distplot(rn1, hist=False, kde=False, fit=stats.norm, fit_kws={'color':'black','label':'u=0,s=1','linestyle':'-'})
sns.distplot(rn2, hist=False, kde=False, fit=stats.norm, fit_kws={'color':'red','label':'u=0,s=2','linestyle':'--'})
sns.distplot(rn3, hist=False, kde=False, fit=stats.norm, fit_kws={'color':'blue','label':'u=2,s=3','linestyle':':'})
sns.distplot(rn4, hist=False, kde=False, fit=stats.norm, fit_kws={'color':'purple','label':'u=5,s=3','linestyle':'-.'})
#呈现图例
plt.legend()
#呈现图形
plt.show()


 1万+
1万+


 被折叠的 条评论
为什么被折叠?
被折叠的 条评论
为什么被折叠?
 到【灌水乐园】发言


