


 文章介绍了如何使用Python的OpenCV库和自定义类Colors,实现图像中对象检测框的绘制,包括颜色选择和大小自适应,适用于YOLOv5风格的标注。作者还提供了实验设置和参考代码链接。
import os
import cv2
class Colors:
# Ultralytics color palette https://ultralytics.com/
def __init__(self):
# hex = matplotlib.colors.TABLEAU_COLORS.values()
hex = ('FF3838', 'FF9D97', 'FF701F', 'FFB21D', 'CFD231', '48F90A', '92CC17', '3DDB86', '1A9334', '00D4BB',
'2C99A8', '00C2FF', '344593', '6473FF', '0018EC', '8438FF', '520085', 'CB38FF', 'FF95C8', 'FF37C7')
# 将hex列表中所有hex格式(十六进制)的颜色转换rgb格式的颜色
self.palette = [self.hex2rgb('#' + c) for c in hex]
# 颜色个数
self.n = len(self.palette)
def __call__(self, i, bgr=False):
# 根据输入的index 选择对应的rgb颜色
c = self.palette[int(i) % self.n]
# 返回选择的颜色 默认是rgb
return (c[2], c[1], c[0]) if bgr else c
@staticmethod
def hex2rgb(h): # rgb order (PIL)
# hex -> rgb
return tuple(int(h[1 + i:1 + i + 2], 16) for i in (0, 2, 4))
def plot_one_box(x, im, color=(128, 128, 128), label=None, line_thickness=3):
"""一般会用在detect.py中在nms之后变量每一个预测框,再将每个预测框画在原图上
使用opencv在原图im上画一个bounding box
:params x: 预测得到的bounding box [x1 y1 x2 y2]
:params im: 原图 要将bounding box画在这个图上 array
:params color: bounding box线的颜色
:params labels: 标签上的框框信息 类别 + score
:params line_thickness: bounding box的线宽
"""
# check im内存是否连续
assert im.data.contiguous, 'Image not contiguous. Apply np.ascontiguousarray(im) to plot_on_box() input image.'
# tl = 框框的线宽 要么等于line_thickness要么根据原图im长宽信息自适应生成一个
tl = line_thickness or round(0.002 * (im.shape[0] + im.shape[1]) / 2) + 1 # line/font thickness
# c1 = (x1, y1) = 矩形框的左上角 c2 = (x2, y2) = 矩形框的右下角
c1, c2 = (int(x[0]), int(x[1])), (int(x[2]), int(x[3]))
# cv2.rectangle: 在im上画出框框 c1: start_point(x1, y1) c2: end_point(x2, y2)
# 注意: 这里的c1+c2可以是左上角+右下角 也可以是左下角+右上角都可以
cv2.rectangle(im, c1, c2, color, thickness=tl, lineType=cv2.LINE_AA)
# 如果label不为空还要在框框上面显示标签label + score
if label:
tf = max(tl - 1, 1) # label字体的线宽 font thickness
# cv2.getTextSize: 根据输入的label信息计算文本字符串的宽度和高度
# 0: 文字字体类型 fontScale: 字体缩放系数 thickness: 字体笔画线宽
# 返回retval 字体的宽高 (width, height), baseLine 相对于最底端文本的 y 坐标
t_size = cv2.getTextSize(label, 0, fontScale=tl / 3, thickness=tf)[0]
c2 = c1[0] + t_size[0], c1[1] - t_size[1] - 3
# 同上面一样是个画框的步骤 但是线宽thickness=-1表示整个矩形都填充color颜色
cv2.rectangle(im, c1, c2, color, -1, cv2.LINE_AA) # filled
# cv2.putText: 在图片上写文本 这里是在上面这个矩形框里写label + score文本
# (c1[0], c1[1] - 2)文本左下角坐标 0: 文字样式 fontScale: 字体缩放系数
# [225, 255, 255]: 文字颜色 thickness: tf字体笔画线宽 lineType: 线样式
cv2.putText(im, label, (c1[0], c1[1] - 2), 0, tl / 3, [225, 255, 255], thickness=tf, lineType=cv2.LINE_AA)
def show_label(path_root_imgs,path_root_labels, save_path_root_imgs):
#需修改,根据自己的类别,注意一一对应
class_catagories=['Abrasion', 'Crazing', 'Patches', 'Inclusion', 'Uneven', 'Blowhole', 'Break', 'Crack', 'Crescent_Gap', 'Crease', 'Silk-Spot', 'Water-Spot', 'Weld-Line', 'GC-Inclusion', 'Oil-Spot', 'Rolled-Pit', 'Punching', 'Waist-Folding', 'Bruise', 'Pitted_Surface', 'Rolled-in_Scale', 'Scratches', 'Bubble']
if not os.path.exists(save_path_root_imgs):
os.makedirs(save_path_root_imgs)
type_object = '.txt'
for ii in os.walk(path_root_imgs):
for j in ii[2]:
save_path=save_path_root_imgs
type = j.split(".")[1]
if type != 'jpg':
continue
save_path=os.path.join(save_path,j)
path_img = os.path.join(path_root_imgs, j)
label_name = j[:-4]+type_object
path_label = os.path.join(path_root_labels, label_name)
f = open(path_label, 'r+', encoding='utf-8')
if os.path.exists(path_label) == True:
img = cv2.imread(path_img)
w = img.shape[1]
h = img.shape[0]
img_tmp = img.copy()
while True:
line = f.readline()
if line:
temp_list=[]
msg = line.split(" ")
label_index=int(msg[0])
x1 = int((float(msg[1]) - float(msg[3]) / 2) * w) # x_center - width/2
y1 = int((float(msg[2]) - float(msg[4]) / 2) * h) # y_center - height/2
x2 = int((float(msg[1]) + float(msg[3]) / 2) * w) # x_center + width/2
y2 = int((float(msg[2]) + float(msg[4]) / 2) * h) # y_center + height/2
temp_list.append(x1)
temp_list.append(y1)
temp_list.append(x2)
temp_list.append(y2)
plot_one_box(x=temp_list,im=img_tmp,color=colors(int(label_index)),label=class_catagories[label_index])
else :
break
cv2.imwrite(save_path,img_tmp)
print(save_path)
print("succfully")
if __name__ == '__main__':
# 初始化Colors对象
colors = Colors()
# 需修改,检测标签根目录
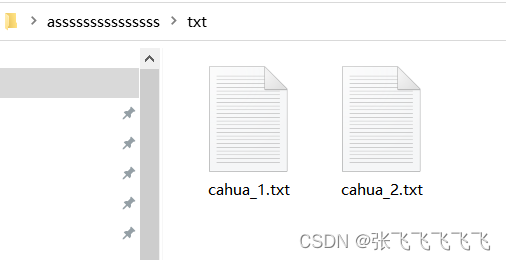
path_root_labels = r'D:\desk\asssssssssssssss\txt'
# 需修改,检测图片根目录
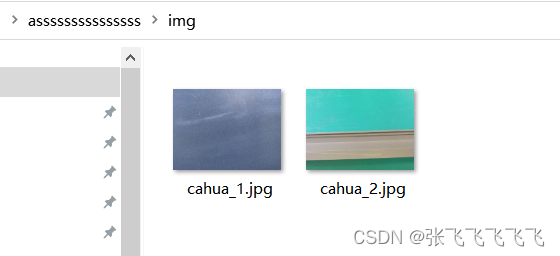
path_root_imgs = r'D:\desk\asssssssssssssss\img'
# 需修改,结果保存根目录
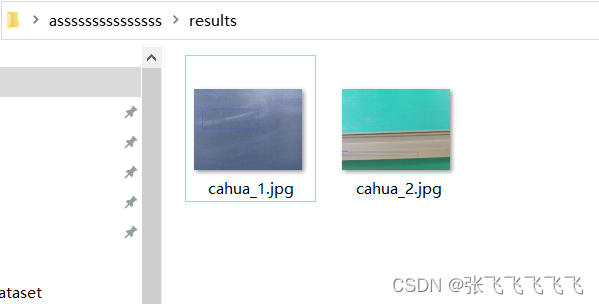
save_path_root_imgs=r'D:\desk\asssssssssssssss\results'
show_label(path_root_imgs,path_root_labels,save_path_root_imgs)
需要修改部分
在以下链接的基础上,增加了类别显示功能,仅需修改以下几部分即可使用本代码
(1)第60行
根据自己的类别替换列表
    #需修改,根据自己的类别,注意一一对应

    class_catagories=['Cahua', 'Crazing', 'Patches', 'Inclusion']
(2)第107行
替换为自己的标签根目录
    # 需修改,检测标签根目录
    path_root_labels = r'D:\desk\asssssssssssssss\txt'
(3)第109行
替换为自己的图片根目录
    # 需修改,检测图片根目录
    path_root_imgs = r'D:\desk\asssssssssssssss\img'
(4)第111行
可视化的结果保存根目录
    # 需修改,结果保存根目录
    save_path_root_imgs=r'D:\desk\asssssssssssssss\results'
实验准备
两张图片
两个txt标签
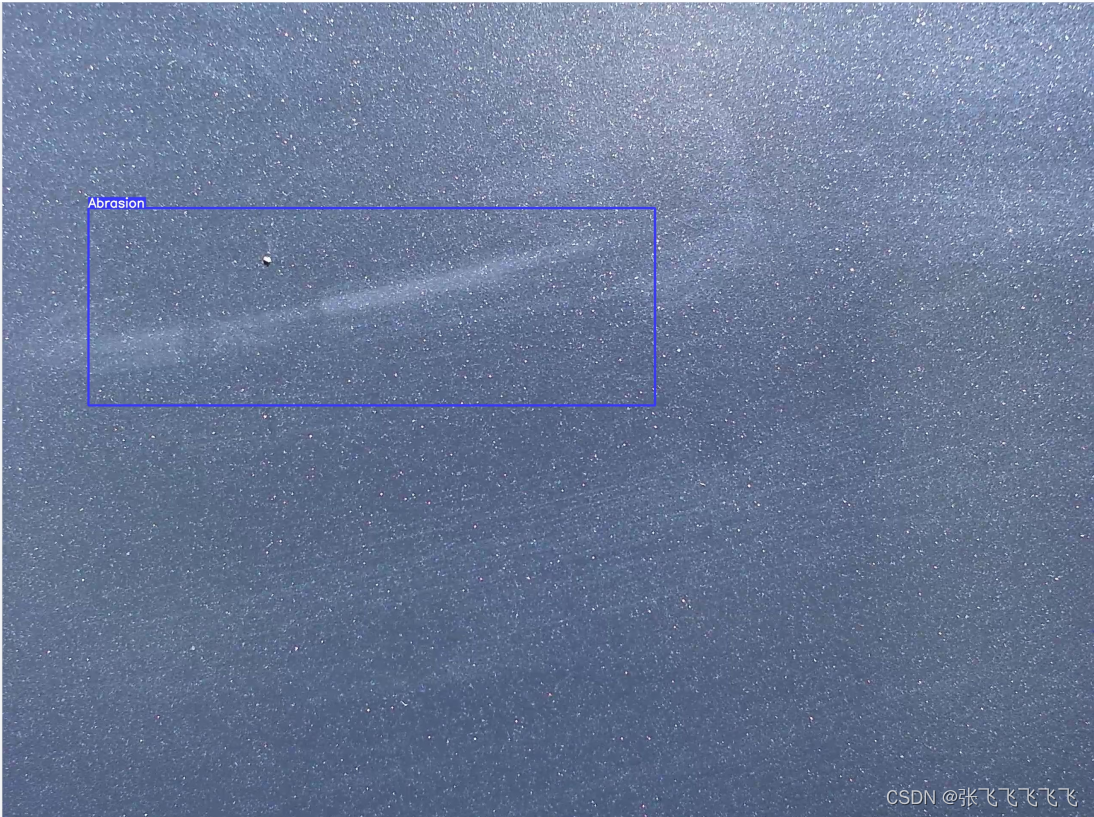
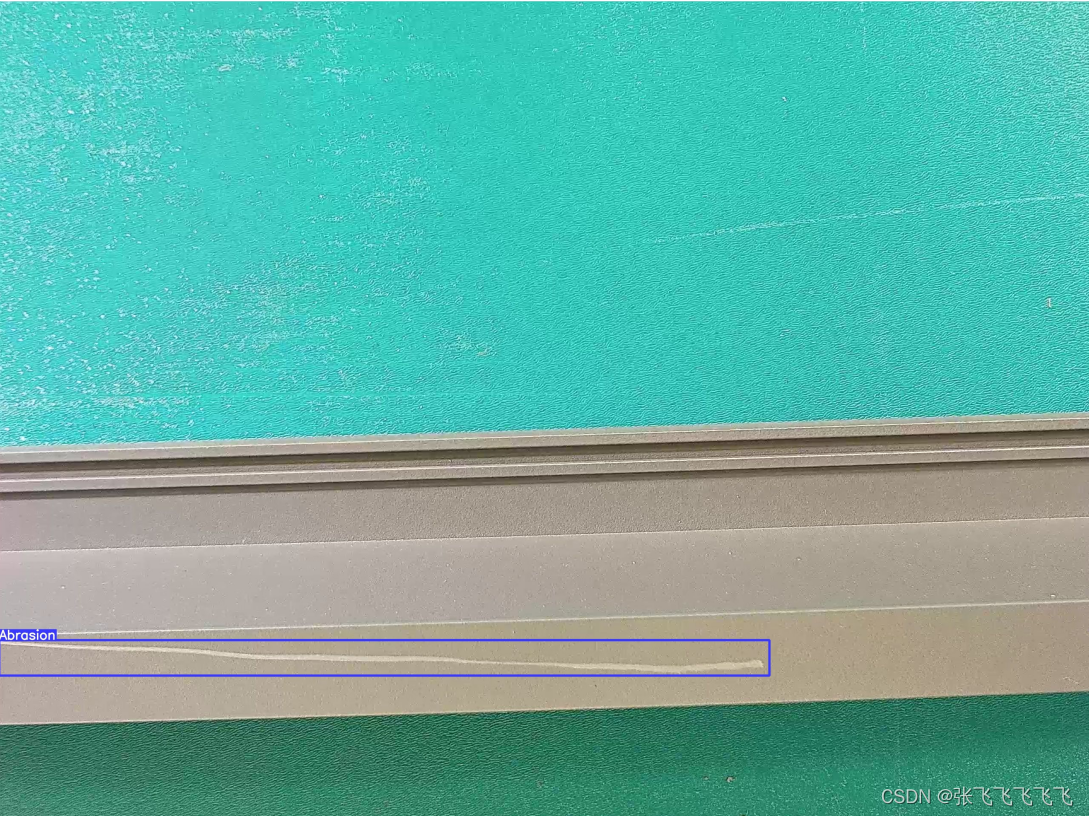
实验结果
参考代码:
【YOLOV5-5.x 源码解读】plots.py_yolov5找不到plot_one_box-CSDN博客
【python】在原图中显示标签(yolo格式)的检测框bbox_python 图片中相框检测_石头城修道的博客-CSDN博客
本代码主要借鉴了yolov5中的plot.py中的函数,可以根据不同的类别生成不同颜色的标签,并且会根据图片的大小自适应调整标签大小,相比自己定义的标签格式画得更好看些!
本代码仅供本人学习使用
xml格式批量可视化
from lxml import etree
import cv2
import os
from tqdm import tqdm

class Colors:
    # Ultralytics color palette https://ultralytics.com/
    def __init__(self):
        # hex = matplotlib.colors.TABLEAU_COLORS.values()
        hex = ('FF3838', 'FF9D97', 'FF701F', 'FFB21D', 'CFD231', '48F90A', '92CC17', '3DDB86', '1A9334', '00D4BB',
               '2C99A8', '00C2FF', '344593', '6473FF', '0018EC', '8438FF', '520085', 'CB38FF', 'FF95C8', 'FF37C7')
        # 将hex列表中所有hex格式(十六进制)的颜色转换rgb格式的颜色
        self.palette = [self.hex2rgb('#' + c) for c in hex]
        # 颜色个数
        self.n = len(self.palette)

    def __call__(self, i, bgr=False):
        # 根据输入的index 选择对应的rgb颜色
        c = self.palette[int(i) % self.n]
        # 返回选择的颜色 默认是rgb
        return (c[2], c[1], c[0]) if bgr else c

    @staticmethod
    def hex2rgb(h):  # rgb order (PIL)
        # hex -> rgb
        return tuple(int(h[1 + i:1 + i + 2], 16) for i in (0, 2, 4))

def plot_one_box(x, im, color=(128, 128, 128), label=None, line_thickness=3):
    """一般会用在detect.py中在nms之后变量每一个预测框,再将每个预测框画在原图上
    使用opencv在原图im上画一个bounding box
    :params x: 预测得到的bounding box  [x1 y1 x2 y2]
    :params im: 原图 要将bounding box画在这个图上  array
    :params color: bounding box线的颜色
    :params labels: 标签上的框框信息  类别 + score
    :params line_thickness: bounding box的线宽
    """
    # check im内存是否连续
    assert im.data.contiguous, 'Image not contiguous. Apply np.ascontiguousarray(im) to plot_on_box() input image.'
    # tl = 框框的线宽  要么等于line_thickness要么根据原图im长宽信息自适应生成一个
    tl = line_thickness or round(0.002 * (im.shape[0] + im.shape[1]) / 2) + 1  # line/font thickness
    # c1 = (x1, y1) = 矩形框的左上角   c2 = (x2, y2) = 矩形框的右下角
    c1, c2 = (int(x[0]), int(x[1])), (int(x[2]), int(x[3]))
    # cv2.rectangle: 在im上画出框框   c1: start_point(x1, y1)  c2: end_point(x2, y2)
    # 注意: 这里的c1+c2可以是左上角+右下角  也可以是左下角+右上角都可以
    cv2.rectangle(im, c1, c2, color, thickness=tl, lineType=cv2.LINE_AA)
    # 如果label不为空还要在框框上面显示标签label + score
    if label:
        tf = max(tl - 1, 1)  # label字体的线宽 font thickness
        # cv2.getTextSize: 根据输入的label信息计算文本字符串的宽度和高度
        # 0: 文字字体类型  fontScale: 字体缩放系数  thickness: 字体笔画线宽
        # 返回retval 字体的宽高 (width, height), baseLine 相对于最底端文本的 y 坐标
        t_size = cv2.getTextSize(label, 0, fontScale=tl / 3, thickness=tf)[0]
        c2 = c1[0] + t_size[0], c1[1] - t_size[1] - 3
        # 同上面一样是个画框的步骤  但是线宽thickness=-1表示整个矩形都填充color颜色
        cv2.rectangle(im, c1, c2, color, -1, cv2.LINE_AA)  # filled
        # cv2.putText: 在图片上写文本 这里是在上面这个矩形框里写label + score文本
        # (c1[0], c1[1] - 2)文本左下角坐标  0: 文字样式  fontScale: 字体缩放系数
        # [225, 255, 255]: 文字颜色  thickness: tf字体笔画线宽     lineType: 线样式
        cv2.putText(im, label, (c1[0], c1[1] - 2), 0, tl / 3, [225, 255, 255], thickness=tf, lineType=cv2.LINE_AA)

# 读取 xml 文件信息,并返回字典形式
def parse_xml_to_dict(xml):
    if len(xml) == 0:  # 遍历到底层,直接返回 tag对应的信息
        return {xml.tag: xml.text}

    result = {}
    for child in xml:
        child_result = parse_xml_to_dict(child)  # 递归遍历标签信息
        if child.tag != 'object':
            result[child.tag] = child_result[child.tag]
        else:
            if child.tag not in result:  # 因为object可能有多个,所以需要放入列表里
                result[child.tag] = []
            result[child.tag].append(child_result[child.tag])
    return {xml.tag: result}


# xml 标注文件的可视化
def xmlShow(img_path,xml_path,save_path, save = True):
    class_catagories=['Abrasion', 'Crazing', 'Patches', 'Inclusion', 'Uneven', 'Blowhole', 'Break', 'Crack', 'Crescent_Gap', 'Crease', 'Silk-Spot', 'Water-Spot', 'Weld-Line', 'GC-Inclusion', 'Oil-Spot', 'Rolled-Pit', 'Punching', 'Waist-Folding', 'Bruise', 'Pitted_Surface', 'Rolled-in_Scale', 'Scratches', 'Bubble']
    image = cv2.imread(img_path)
    image_temp = image.copy()
    with open(xml_path, encoding='utf-8', errors='ignore') as fid:  # 防止出现非法字符报错
        xml_str = fid.read()
    xml = etree.fromstring(xml_str.encode('utf8'))
    data = parse_xml_to_dict(xml)["annotation"]  # 读取 xml文件信息

    ob = []         # 存放目标信息
    for i in data['object']:        # 提取检测框
        name = str(i['name'])        # 检测的目标类别

        bbox = i['bndbox']
        xmin = int(bbox['xmin'])
        ymin = int(bbox['ymin'])
        xmax = int(bbox['xmax'])
        ymax = int(bbox['ymax'])

        # 绘制框、类别
        plot_one_box(x=[xmin,ymin,xmax,ymax],im=image_temp,color=colors(int(class_catagories.index(name))),label=name)

    # 保存图像
    if save:
        cv2.imwrite(save_path,image_temp)

    # 展示图像
    # cv2.imshow('test',image)
    # cv2.waitKey()
    # cv2.destroyAllWindows()

 # 批量可视化
def batch_visual(img_folder, xml_folder, save_folder):

    for img_name in tqdm(os.listdir(img_folder)):
        img_path = os.path.join(img_folder, img_name)
        xml_path = os.path.join(xml_folder, img_name.split(".")[0]+".xml")
        save_path = os.path.join(save_folder, img_name)
        xmlShow(img_path=img_path, xml_path=xml_path, save_path=save_path)

if __name__ == "__main__":
    # 初始化Colors对象
    colors = Colors()

    # 文件夹路径
    img_folder = r"/home/zhangh/project1/pilipalawz/faster_rcnn/VOCdevkit/VOC2012/JPEGImages"
    xml_folder = r"/home/zhangh/project1/pilipalawz/faster_rcnn/VOCdevkit/VOC2012/Annotations"
    save_folder = r"/home/zhangh/project1/pilipalawz/faster_rcnn/VOCdevkit/VOC2012/show_imgs_1"

    # 批量可视化
    batch_visual(img_folder=img_folder, xml_folder=xml_folder, save_folder=save_folder)


 被折叠的 条评论
为什么被折叠?
被折叠的 条评论
为什么被折叠?
 到【灌水乐园】发言


