


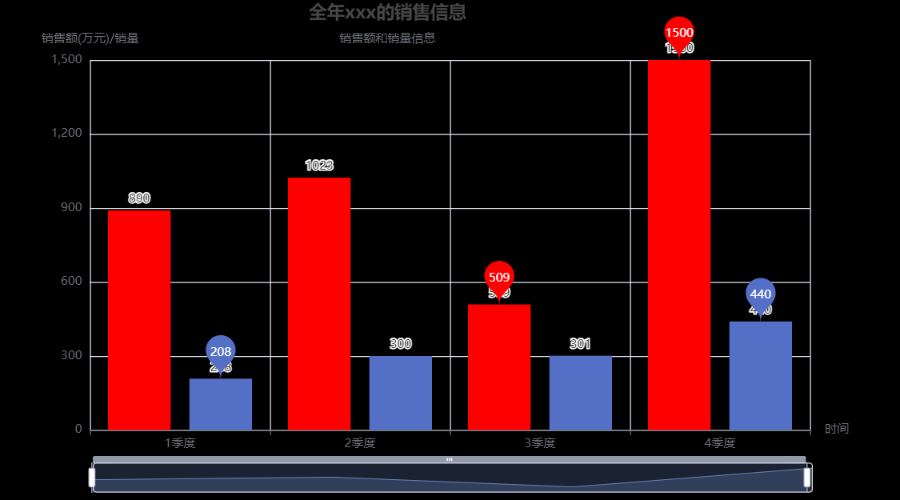
一、 柱状图
from pyecharts.charts import Bar
from pyecharts import options

# 1. 创建图表对象
bar = Bar()

# 2. 添加数据
# 1)添加x轴上的数据
bar.add_xaxis(['1季度', '2季度', '3季度', '4季度'])

# 2) 添加y轴上的数据
bar.add_yaxis('销售额', [890, 1023, 509, 1500],
              # 设置销售额对应的柱子的颜色
              color='red',
              # is_show_background=True,
              # bar_width=40
              bar_max_width=100,
              bar_min_width=40
        )

bar.add_yaxis('销量', [208, 300, 301, 440])

# 3.柱状图相关的配置
# 1)全局配置
bar.set_global_opts(
    # 设置标题
    title_opts=options.TitleOpts(
        title='全年xxx的销售信息',
        title_link='https://www.baidu.com',
        subtitle='销售额和销量信息',
        pos_right=350,
        text_align='center'
    ),
    # 设置图例
    legend_opts=options.LegendOpts(
        is_show=False,
        pos_right=90,
        item_width=20,
        item_height=10
    ),
    # 设置工具箱
    toolbox_opts=options.ToolboxOpts(
        is_show=True
    ),
    # 设置区域缩放
    datazoom_opts=options.DataZoomOpts(
       is_show=True
    ),
    # x轴和y轴的配置
    xaxis_opts=options.AxisOpts(
        name='时间'
    ),
    yaxis_opts=options.AxisOpts(
        name='销售额(万元)/销量',
        name_rotate=0
    )
)

# 2)系列配置
bar.set_series_opts(
    # 设置标签
    label_opts=options.LabelOpts(
        is_show=True,
        position='top',      # 'top'、'left'、'right'
        rotate=0,
        # color='#00ff00'
    ),
    # 设置标记点
    markpoint_opts=options.MarkPointOpts(
        data=[options.MarkPointItem(name='最小值', type_='min'), options.MarkPointItem(name='最大值', type_='max')]
    )
)

# 3)数据配置
# 数据配置只能在添加数据的时候设置

# 4. 渲染图表(制图)
bar.render('files/01柱状图.html')
结果展示:
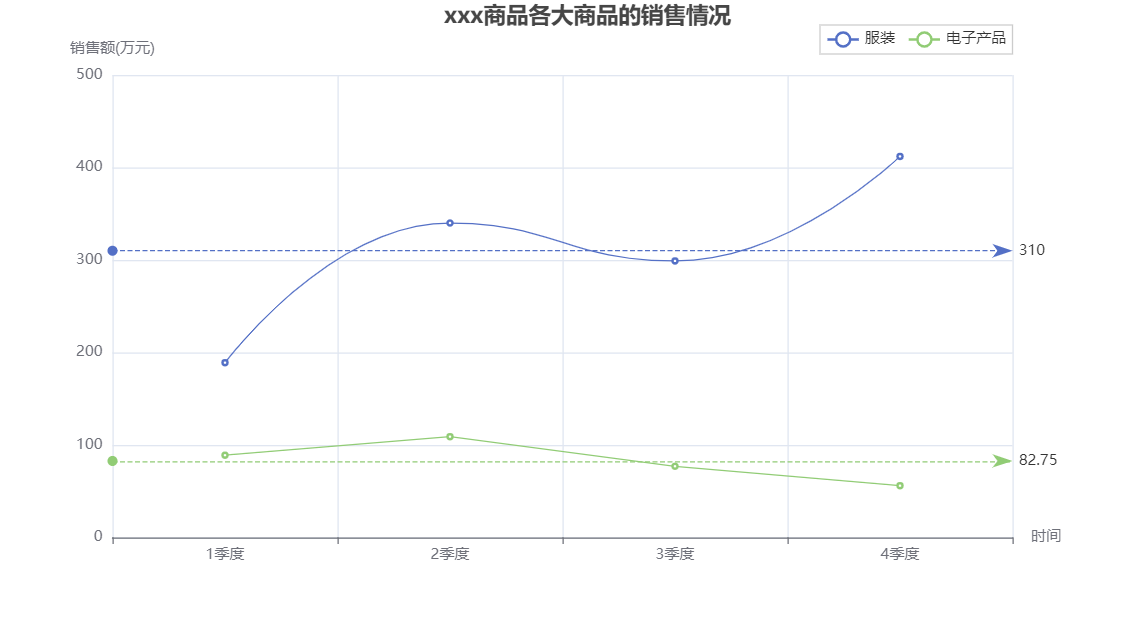
二、 折线图
from pyecharts.charts import Line
from pyecharts import options

# 1.创建折线图对象
line = Line()

# 2.添加数据
line.add_xaxis(['1季度', '2季度', '3季度', '4季度'])

line.add_yaxis('服装', [189, 340, 299, 412], is_smooth=True)
line.add_yaxis('电子产品', [89, 109, 77, 56])

# 3.图表设置
line.set_global_opts(
    title_opts=options.TitleOpts(
        title='xxx商品各大商品的销售情况',
        pos_left="350"
    ),
    legend_opts=options.LegendOpts(
        pos_right=0
    ),
    yaxis_opts=options.AxisOpts(
        name='销售额(万元)'
    ),
    xaxis_opts=options.AxisOpts(
        name='时间'
    )
)

line.set_series_opts(
    label_opts=options.LabelOpts(
        is_show=False
    ),
    markline_opts=options.MarkLineOpts(
        data=[options.MarkLineItem(type_='average', name='平均销售额')]
    )
)

# 4.渲染
line.render('files/02折线图.html')
结果展示:
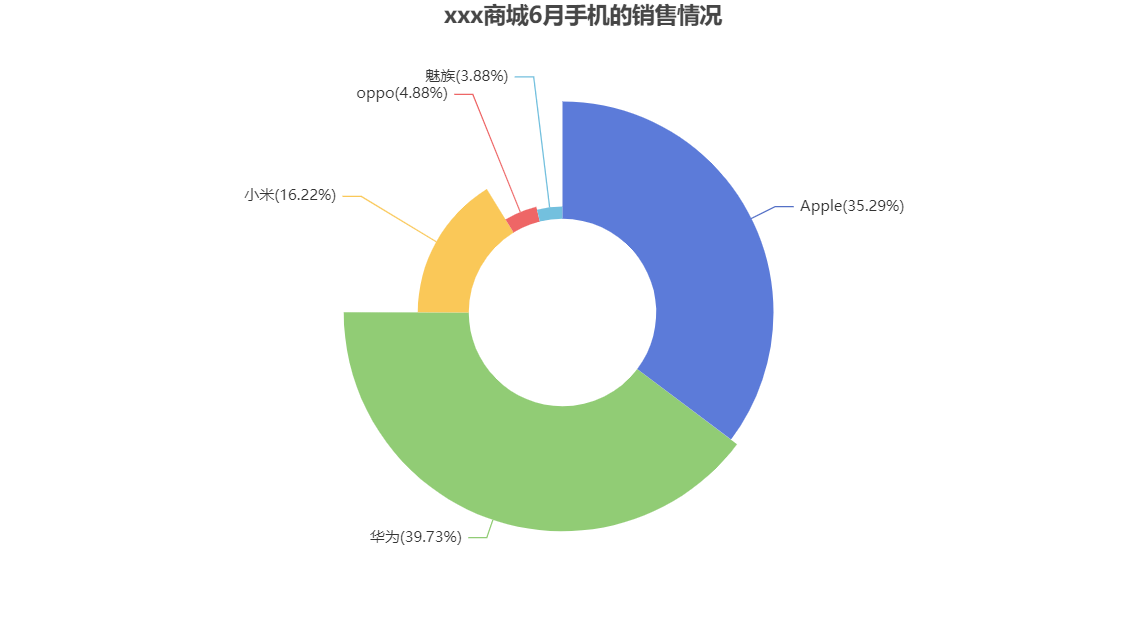
三、 饼图
from pyecharts.charts import Pie
from pyecharts import options

# 1.创建饼图对象
pie = Pie()

# 2.添加数据
pie.add(
    '手机销量',
    [('Apple', 890), ('华为', 1002), ('小米', 409), ('oppo', 123), ('魅族', 98)],
    # 分别设置圆的内圆半径和外圆半径
    radius=('30%', '70%'),
    # 让外圆环不规则
    rosetype='radius'
)

# 3.图表的设置
pie.set_global_opts(
    legend_opts=options.LegendOpts(
        is_show=False
    ),
    title_opts=options.TitleOpts(
        title='xxx商城6月手机的销售情况',
        pos_left='350'
    )
)

pie.set_series_opts(
    label_opts=options.LabelOpts(
        # {b} - 数据名称、{d} - 百分比比值
        formatter='{b}({d}%)'
    )
)

# 4.渲染图表
pie.render('files/03饼图.html')
结果展示:
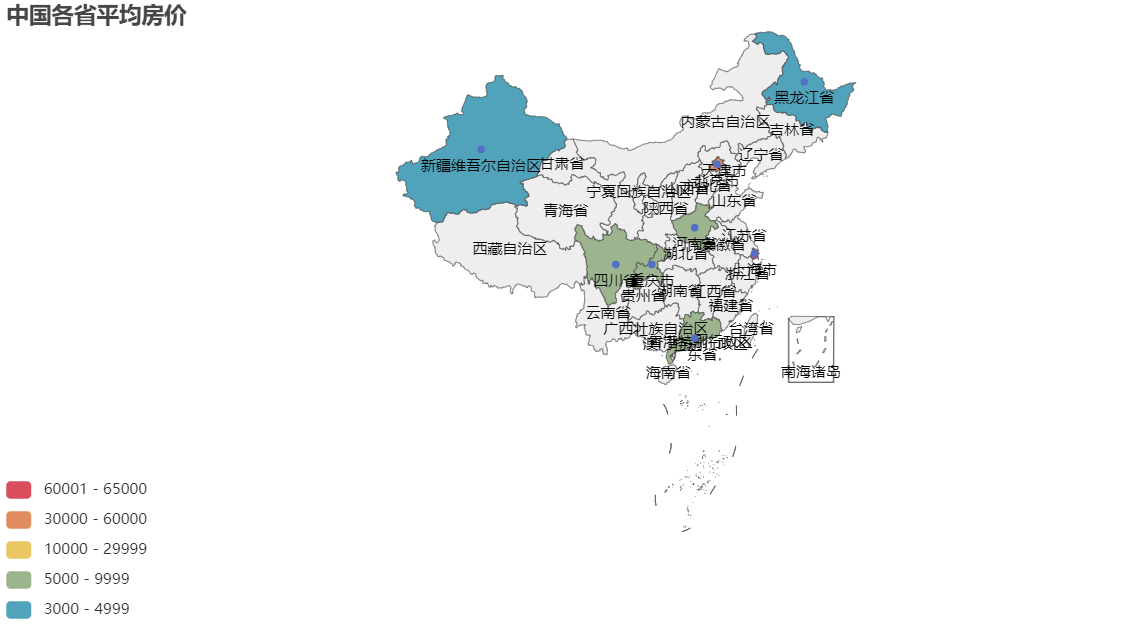
四、 地图
from pyecharts.charts import Map
from pyecharts import options

# =====================================1.中国地图=====================================
# 1. 创建地图对象
map1 = Map()

# 2.添加数据
map1.add(
    '房价',
    [('四川省', 8000), ('重庆市', 7923), ('河南省', 5672), ('北京市', 53994),
     ('上海市', 63720), ('新疆维吾尔自治区', 3982), ('广东省', 6000), ('黑龙江省', 4632)],
    zoom=1.4,
    min_scale_limit=1,
    max_scale_limit=3
)

# 3.添加配置
map1.set_global_opts(
    visualmap_opts=options.VisualMapOpts(
        is_show=True,
        min_=3000,
        max_=65000,
        # 让颜色分段
        is_piecewise=True,
        # 设置每一段的数值范围
        pieces=[
            {'min': 3000, 'max': 4999},
            {'min': 5000, 'max': 9999},
            {'min': 10000, 'max': 29999},
            {'min': 30000, 'max': 60000},
            {'min': 60001, 'max': 65000}
        ]
    ),
    legend_opts=options.LegendOpts(
        is_show=False
    ),
    title_opts=options.TitleOpts(
        title='中国各省平均房价'
    )
)

# 4.渲染
map1.render('files/04中国地图.html')

# =====================================2.四川地图=====================================
map2 = Map()

map2.add('房价', [('成都市', 12000), ('乐山市', 7000)], maptype='四川')

map2.render('files/05四川地图.html')

# =====================================3.世界地图=====================================
map3 = Map()

map3.add('房价', [('China', 1002)], maptype='world')

map3.set_series_opts(
    label_opts=options.LabelOpts(
        is_show=False
    )
)
map3.render('files/06世界地图.html')

# ========================成都市地图==============================
map4 = Map()
map4.add('房价', [('青羊区', 17000)], maptype='成都')
map4.render('files/成都地图.html')
结果展示:

五、 词云
from pyecharts.charts import WordCloud
from pyecharts import options

# 1.创建图表
wc = WordCloud()

# 2. 添加数据
wc.add(
    '',
    [('王者荣耀', 82933), ('英雄联盟', 109283), ('阴阳师', 7282), ('原神', 1928), ('和平精英', 829),
     ('开心消消乐', 8192), ('羊了个羊', 909), ('飞机大战', 109), ('蛋仔派对', 679), ('猎梦者', 302),
     ('红色警戒', 19), ('魔兽', 68922), ('刀塔', 3192), ('QQ农场', 87), ('植物大战僵尸', 891), ('地平线', 1923),
     ('神庙逃亡', 10), ('节奏大师', 2033), ('找你妹', 9), ('大富翁', 340), ('保卫萝卜', 9012)],
    # cardioid(心脏线)、diamond(钻石)、triangle(三角形)、triangle-forward、pentagon(五边形)、star(星形)
    shape='cardioid',
    # word_size_range=(15, 200)
)

# 4.渲染
wc.render('files/07词云.html')
结果展示:

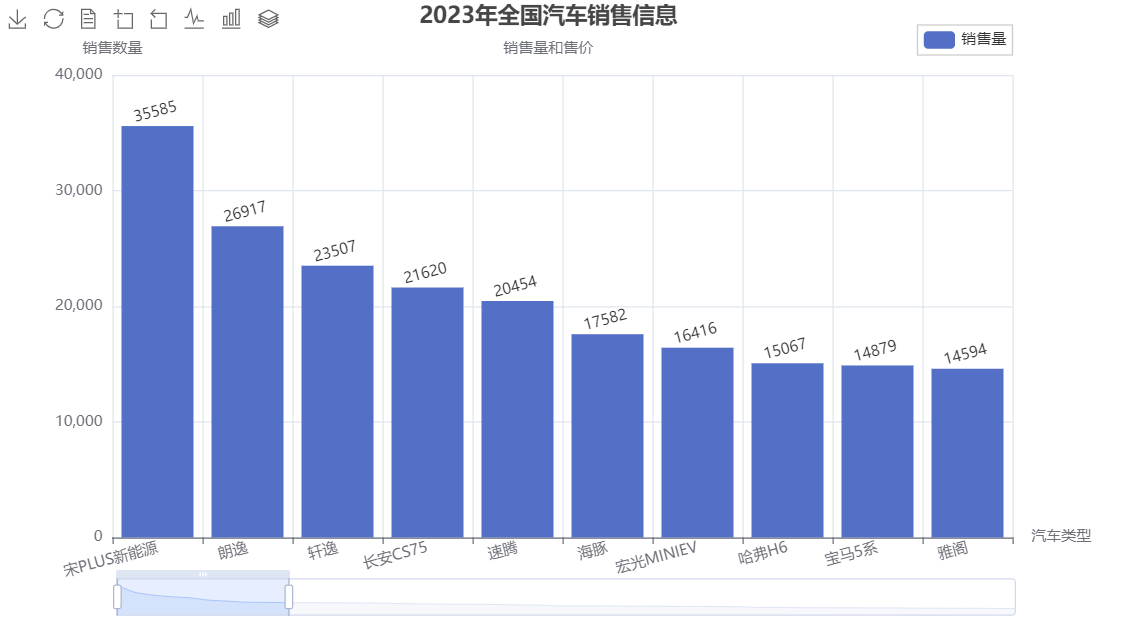
作业
"""
Author:ZouYan
Create Time:2023/2/22 16:38
"""
import openpyxl
from pyecharts.charts import Bar, Pie, Map, Line, WordCloud
from pyecharts import options
wb = openpyxl.open('files/汽车销量的数据.xlsx')
sheet = wb.active
m_r = sheet.max_row
data = {}
for r in range(2, m_r+1):
value = sheet.cell(r, 1).value
if value not in data:
data[value] = sheet.cell(r, 5).value
print(data)
# 构建柱状图的数据
x_data = []
y_data = []
for key in data:
x_data.append(key)
y_data.append(data[key])
bar = Bar()
bar.add_xaxis(x_data)
bar.add_yaxis('销售量', y_data)
bar.set_global_opts(
title_opts=options.TitleOpts(
title='2023年全国汽车销售信息',
pos_right=250,
subtitle='销售量和售价',
text_align='center'
),
legend_opts=options.LegendOpts(
is_show=True,
pos_right=90,
pos_top=20,
),
toolbox_opts=options.ToolboxOpts(
is_show=True,
pos_left=0,
pos_top=0,
),
datazoom_opts=options.DataZoomOpts(
is_show=True,
),
xaxis_opts=options.AxisOpts(
name='汽车类型',
name_rotate=0,
axislabel_opts={"rotate": 15}
),
yaxis_opts=options.AxisOpts(
name='销售数量'
),
)
bar.set_series_opts(
label_opts=options.LabelOpts(
is_show=True,
position='top',
rotate='15'
)
)
bar.render('files/汽车销量柱状图.html')
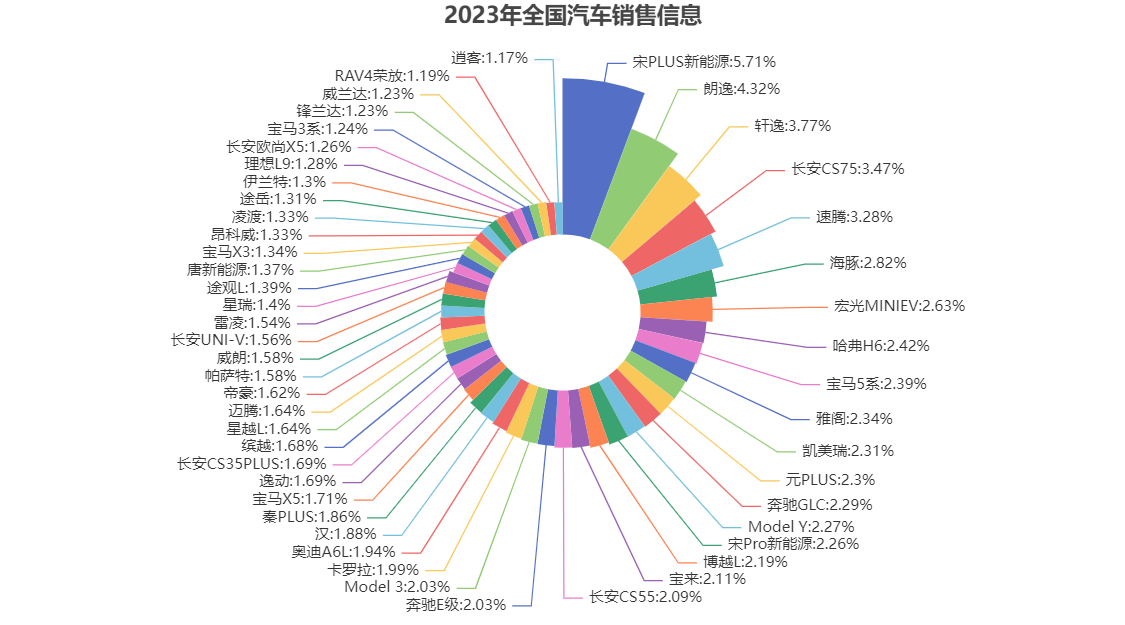
# 构建饼图数据
pie_data = []
for key in data:
pie_data.append((key, data[key]))
# print(pie_data)
pie = Pie()
pie.add(
'汽车销量',
pie_data,
radius=('25%', '75%'),
rosetype='radius'
)
# 图表的设置
pie.set_global_opts(
legend_opts=options.LegendOpts(
is_show=False
),
title_opts=options.TitleOpts(
title='2023年全国汽车销售信息',
pos_left='350'
)
)
pie.set_series_opts(
label_opts=options.LabelOpts(
formatter='{b}:{d}%'
)
)
pie.render('files/汽车销量饼图.html')
wc = WordCloud()
wc.add('', pie_data, shape='star')
wc.render('files/汽车销量词云图.html')结果展示:


 4万+
4万+

 被折叠的 条评论
为什么被折叠?
被折叠的 条评论
为什么被折叠?
 到【灌水乐园】发言


