


- 实验目的
1. 采用C4.5算法建立决策树模型
2. 将每个特征的信息增益率打印输出
3. 输出最后建立的决策树模型结构图(可以用字典结构表示,也可以用matplotlib等图形库绘制出树形图)
- 实验内容:
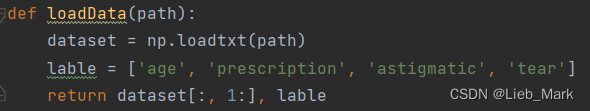
1、使用np.loadtxt把txt文件中的数据变为ndarray,第一列是编号,在实验中不需要,使用切片去除。同时根据数据集的资料,列出每个属性名。
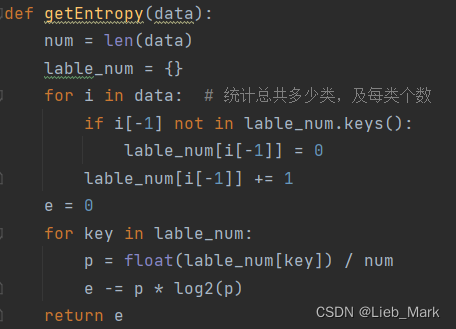
2、求信息熵。需要统计出总共有多少种类别,以及每类个数,使用字典存储查找快捷方便。按照公式进行计算即可。
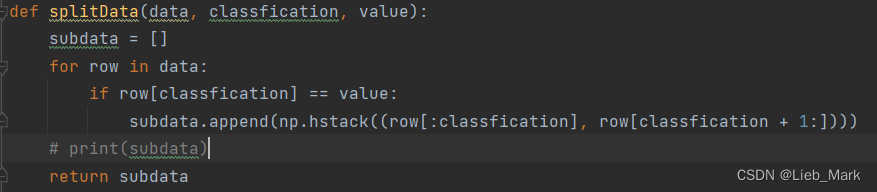
3、根据选定的属性及该属性取值value,对数据集进行筛选,只保留该属性列值为value的行,并且去除该属性列,因为后面还要递归处理,这列还保留的话,可能会在一个分支上多次使用这个属性进行划分。去除列可以使用切片,之后再用np.hstack水平方向合并。
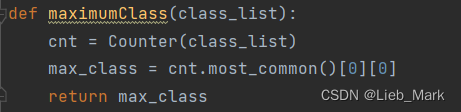
4、给出一个列表,求出其中哪个元素出现的次数最多。可以用于递归的数据只有一种属性,此时为叶节点,类别确定为出现的次数最多的类别。使用内置的collections库中的Counter进行统计并输出。
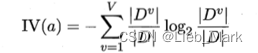
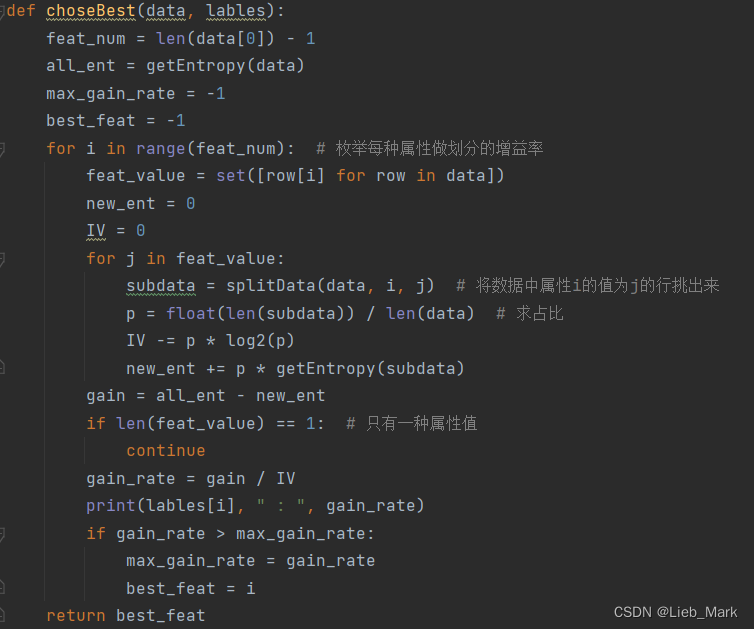
5、根据课本上的原理进行划分属性的选择,应当计算并选择增益率最大的属性。对每个属性求增益率:使用两层循环,外层枚举属性,内层统计该属性有多少种、占比、固有值。根据公式求出每个的增益率,选取增益率最大的属性作为划分属性。
![]()
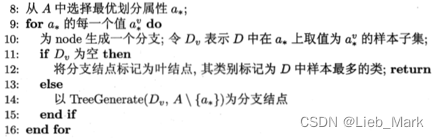
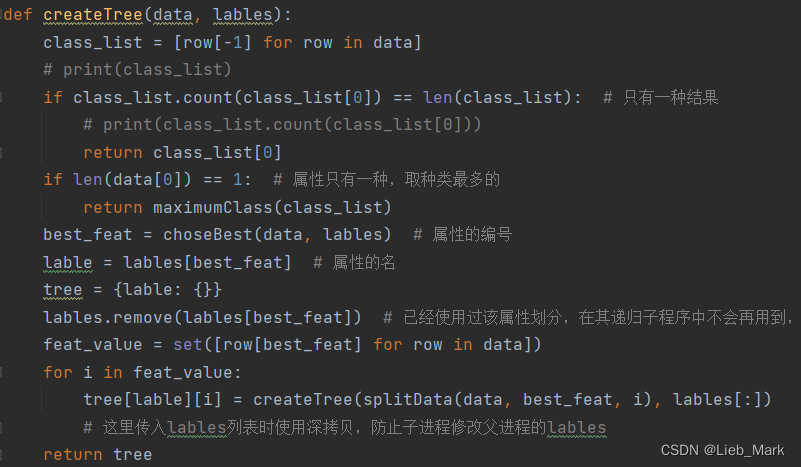
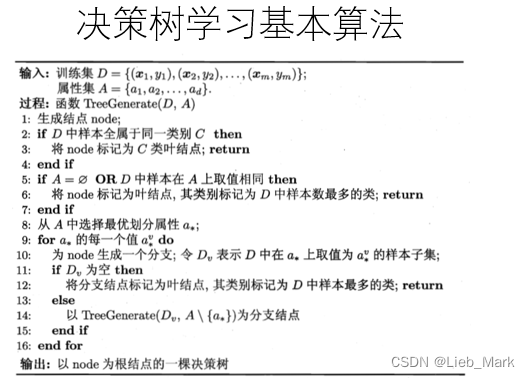
6、根据书上的伪代码创建树。首先是两种特殊情况:如果只有一种类别,那么这个分支的所有样本都属于这个类别,变为叶节点;
![]()
如果样本在A上取值相同,就选择D中样本数最多的类。
![]()
与这两种情况都不相符的话,就要从A中选取增益率最大的属性进行划分,调用上面实现的函数choseBest即可得出。然后根据该属性取值不同,生成不同分支,再递归求解其子树。
实验中遇到的问题及解决:
在建树的处理过程中,选定了某个属性需要在标签中将其去除,防止与后面的数据对应不上。在递归参数传递时,使用splitData函数选取该属性值相同的样本放在一个节点上,并去除该属性的列。lables的传递需要注意使用切片生成一个新对象或者使用deepcopy出一个新的,否则传递指针导致在子进程中修改lables,父进程出错。
实验结果:
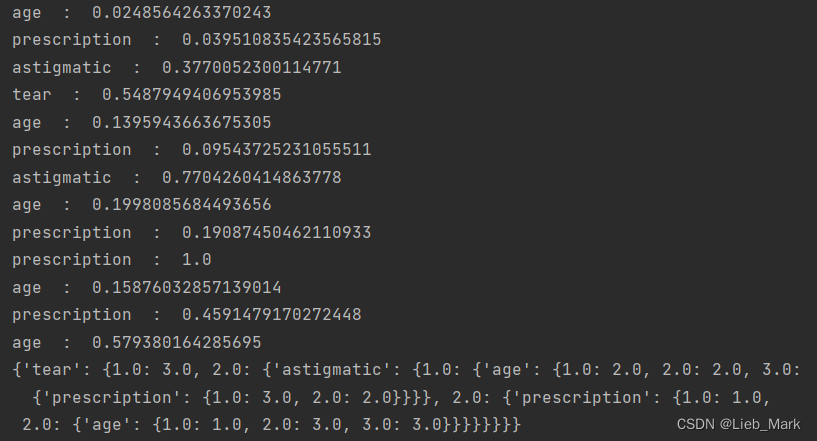
可以看到各个特征的信息增益率,由于决策树是多层的,可能在不同的分支对不同的属性信息增益率不同。但是前四行是第一次选定,可以看到tear的增益率最高,选定其作为划分依据,后面类似,与实验结果吻合。
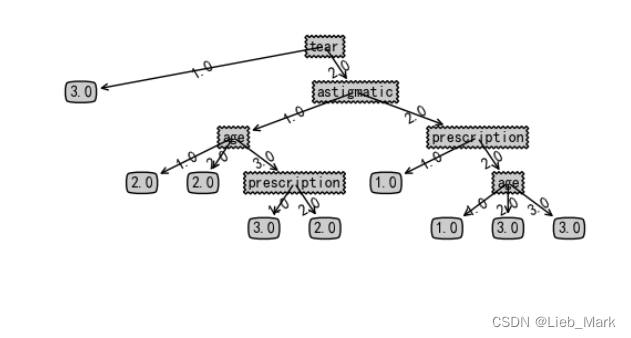
根据资料搜集,可以使用matplotlib进行决策树的绘制,这样更加清晰直观。
- 实验原理:

- 心得体会:
通过这次实验我学习了三种决策树的思想以及C4.5算法的具体实现过程,在实践中对这些算法有了更加清晰的理解和掌握。同时还熟悉了信息熵、增益率等概念和决策树具体创建和工作流程以及其合理性。这也是对python数据处理、程序设计的能力考验,有的操作调用方法就可以较快实现,如ndarray的合并、列表求出现次数最多的元素。
在实验中也遇到了因为python的函数传参机制是传递指针,造成递归的子进程修改父进程变量的问题;对于伪代码转换为可执行代码的手足无措;以及学习matplotlib实现决策树的绘制等等。为以后的学习打下坚实的基础。
import numpy as np
from math import log2
import treePlotter
from collections import Counter


def loadData(path):
    dataset = np.loadtxt(path)
    lable = ['age', 'prescription', 'astigmatic', 'tear']
    return dataset[:, 1:], lable


def getEntropy(data):
    num = len(data)
    lable_num = {}
    for i in data:  # 统计总共多少类,及每类个数
        if i[-1] not in lable_num.keys():
            lable_num[i[-1]] = 0
        lable_num[i[-1]] += 1
    e = 0
    for key in lable_num:
        p = float(lable_num[key]) / num
        e -= p * log2(p)
    return e


def splitData(data, classfication, value):
    subdata = []
    for row in data:
        if row[classfication] == value:
            subdata.append(np.hstack((row[:classfication], row[classfication + 1:])))
    # print(subdata)
    return subdata


def maximumClass(class_list):
    cnt = Counter(class_list)
    max_class = cnt.most_common()[0][0]
    return max_class


def choseBest(data, lables):
    feat_num = len(data[0]) - 1
    all_ent = getEntropy(data)
    max_gain_rate = -1
    best_feat = -1
    for i in range(feat_num):  # 枚举每种属性做划分的增益率
        feat_value = set([row[i] for row in data])
        new_ent = 0
        IV = 0
        for j in feat_value:
            subdata = splitData(data, i, j)  # 将数据中属性i的值为j的行挑出来
            p = float(len(subdata)) / len(data)  # 求占比
            IV -= p * log2(p)
            new_ent += p * getEntropy(subdata)
        gain = all_ent - new_ent
        if len(feat_value) == 1:  # 只有一种属性值
            continue
        gain_rate = gain / IV
        print(lables[i], " : ", gain_rate)
        if gain_rate > max_gain_rate:
            max_gain_rate = gain_rate
            best_feat = i
    return best_feat


def createTree(data, lables):
    class_list = [row[-1] for row in data]
    # print(class_list)
    if class_list.count(class_list[0]) == len(class_list):  # 只有一种结果
        # print(class_list.count(class_list[0]))
        return class_list[0]
    if len(data[0]) == 1:  # 属性只有一种,取种类最多的
        return maximumClass(class_list)
    best_feat = choseBest(data, lables)  # 属性的编号
    lable = lables[best_feat]  # 属性的名
    tree = {lable: {}}
    lables.remove(lables[best_feat])  # 已经使用过该属性划分,在其递归子程序中不会再用到,但是其他分支会用到
    feat_value = set([row[best_feat] for row in data])
    for i in feat_value:
        tree[lable][i] = createTree(splitData(data, best_feat, i), lables[:])
        # 这里传入lables列表时使用深拷贝,防止子进程修改父进程的lables
    return tree


if __name__ == '__main__':
    data, lables = loadData(r'D:\pythonProject\Machine_learning\test3\隐形眼镜数据集\lenses_data.txt')
    tree = createTree(data, lables)
    print(tree)
    treePlotter.createplot(tree)
import matplotlib.pyplot as plt
from pylab import *

mpl.rcParams['font.sans-serif'] = ['SimHei']

"定义文本框和箭头格式"
decisionnode = dict(boxstyle="sawtooth", fc="0.8")
leafnode = dict(boxstyle="round4", fc="0.8")
arrow_args = dict(arrowstyle="<-")

"绘制带箭头的注解"


def plotnode(nodetxt, centerpt, parentpt, nodetype):
    createplot.ax1.annotate(nodetxt,
                            xy=parentpt,
                            xycoords='axes fraction',
                            xytext=centerpt,
                            textcoords='axes fraction',
                            va='center',
                            ha='center',
                            bbox=nodetype,
                            arrowprops=arrow_args)


def createplot():
    fig = plt.figure(1, facecolor='white')  # 创建新图形
    fig.clf()  # 清空绘图区
    createplot.ax1 = plt.subplot(111, frameon=False)
    plotnode('决策节点', (0.5, 0.1), (0.1, 0.5), decisionnode)
    plotnode('叶节点', (0.8, 0.1), (0.3, 0.8), leafnode)
    plt.show()


def getnumleafs(mytree):
    numleafs = 0
    firststr = list(mytree.keys())[0]
    seconddict = mytree[firststr]
    for key in seconddict.keys():
        if type(seconddict[key]).__name__ == 'dict':
            numleafs += getnumleafs(seconddict[key])
        else:
            numleafs += 1
    return numleafs


def gettreedepth(mytree):
    maxdepth = 0
    firststr = list(mytree.keys())[0]
    seconddict = mytree[firststr]
    for key in seconddict.keys():
        if type(seconddict[key]).__name__ == 'dict':
            thisdepth = 1 + getnumleafs(seconddict[key])
        else:
            thisdepth = 1
        if thisdepth > maxdepth:
            maxdepth = thisdepth
    return maxdepth


def plotmidtext(cntrpt, parentpt, txtstring):
    xmid = (parentpt[0] - cntrpt[0]) / 2.0 + cntrpt[0]
    ymid = (parentpt[1] - cntrpt[1]) / 2.0 + cntrpt[1]
    createplot.ax1.text(xmid, ymid, txtstring, va="center", ha="center", rotation=30)


def plottree(mytree, parentpt, nodetxt):
    numleafs = getnumleafs(mytree)
    depth = gettreedepth(mytree)
    firststr = list(mytree.keys())[0]
    cntrpt = (plottree.xoff + (1.0 + float(numleafs)) / 2.0 / plottree.totalw, plottree.yoff)
    plotmidtext(cntrpt, parentpt, nodetxt)
    plotnode(firststr, cntrpt, parentpt, decisionnode)
    seconddict = mytree[firststr]
    plottree.yoff = plottree.yoff - 1.0 / plottree.totald
    for key in seconddict.keys():
        if type(seconddict[key]).__name__ == 'dict':
            plottree(seconddict[key], cntrpt, str(key))
        else:
            plottree.xoff = plottree.xoff + 1.0 / plottree.totalw
            plotnode(seconddict[key], (plottree.xoff, plottree.yoff), cntrpt, leafnode)
            plotmidtext((plottree.xoff, plottree.yoff), cntrpt, str(key))
    plottree.yoff = plottree.yoff + 1.0 / plottree.totald


def createplot(intree):
    fig = plt.figure(1, facecolor='white')
    fig.clf()
    axprops = dict(xticks=[], yticks=[])
    createplot.ax1 = plt.subplot(111, frameon=False, **axprops)
    "使用下两行代码计算树节点的摆放位置,将树绘制在水平方向和垂直方向的中心位置"
    plottree.totalw = float(getnumleafs(intree))  # 树的宽度
    plottree.totald = float(gettreedepth(intree))  # 树的高度
    plottree.xoff = -0.5 / plottree.totalw;
    plottree.yoff = 1.0  # 追踪已经绘制的节点位置,以及放置下一个节点的恰当位置
    plottree(intree, (0.5, 1.0), '')
    plt.show()


 5164
5164


 被折叠的 条评论
为什么被折叠?
被折叠的 条评论
为什么被折叠?
 到【灌水乐园】发言


