


文章目录
前言
记录一下首次接触免疫组库数据的笔记
一、免疫组库
免疫组库主要看可变区的CDR3序列
其他基础知识见:
10× Genomics单细胞免疫组库VDJ分析必知必会
单细胞免疫组库:TCR基因重排原理和TCR测序建库方法
We need a minimum of 30x coverage in order to confidently identify unique VDJ sequences as truly unique. In addition, we need to ensure that this coverage amount can be met for all samples, even though we have large variation in the concentration of T-cells within these samples. We assume that a highly diverse sample will have a correspondingly lower average read depth, but need to determine the correlation between initial T-cell concentration and read depth.
ref:T-Cell Concentration and Coverage Depth #10
二、免疫组库数据处理
1、组装得到CDR3序列
1.1、scTCR/BCR
单细胞免疫组测序比较常见的是10X Genomics平台,其他的还有Smart-Seq2等
1.1.1 10X Genomics平台
处理软件:cellRanger
cellranger vdj --id=sample_name \
                 --reference=/opt/refdata-cellranger-vdj-GRCh38-alts-ensembl-3.1.0 \
                 --fastqs=/fastq_path \
                 --sample=sample_name \
                 --localcores=8 \
                 --localmem=64
结果中会有一个检测报告,进行质控
1.1.2 其他单细胞测序平台
平台信息见:单细胞TCR-Seq技术——更高效的TCR a/b 链配对分析
处理软件:
TraCeR – reconstruction of T cell receptor sequences from single-cell RNA-seq data.
scTCR-seq – an implementation of a pipeline for Single-cell RNAseq package for recovering TCR data in python
TRAPeS – TCR Reconstruction Algorithm for Paired-End Single-cell
VDJPuzzle2 – TCR and BCR reconstruction from scRNA-seq data
Mixcr – a universal software for fast and accurate analysis of raw T- or B- cell receptor repertoire sequencing data
Immunarch – Fast and Seamless Exploration of Single-cell and Bulk T-cell/Antibody Immune Repertoires in R
1.2、bulk TCR/BCR
1.2.1 处理流程
bulk TCR/BCR的原始数据处理和RNA-seq的原始数据处理步骤一样,此处不再详细记录
1、QC
2、trimmomatic后fastqc
3、之后可用mixcr、Immunarch等得到CDR3序列
详见:Bulk VDJ测序数据处理基本方法
全网第一篇免疫组库分析教程[MiXCR+VDJtools+Python+R]
1.2.2 注意事项
fastqc后,TCR/BCR的结果和RNA-seq的有点不一样,此处记录一下
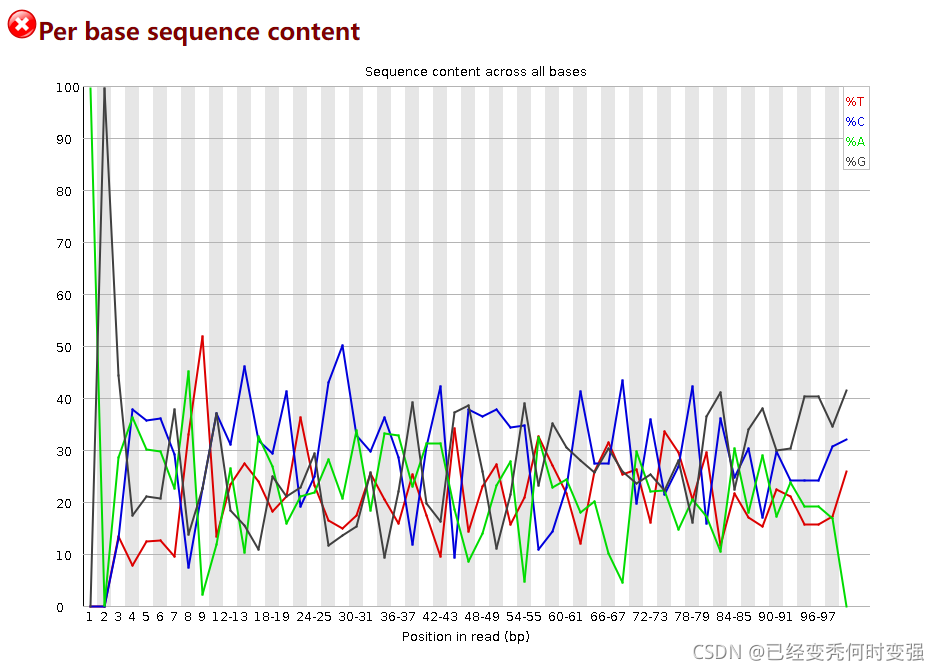
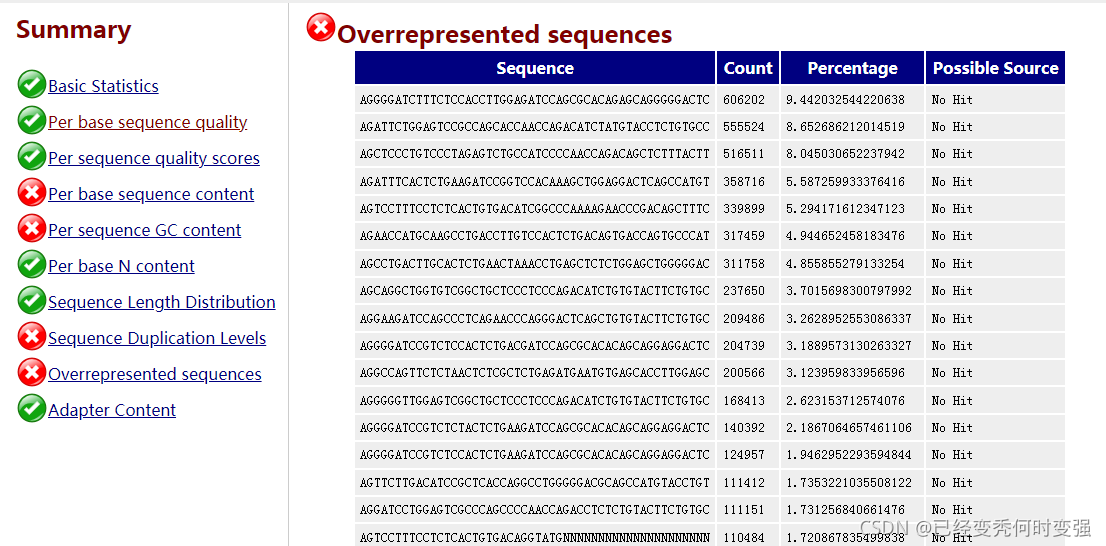
1、Per base sequence content的TCGA配对碱基含量不一致和overrepresented sequence序列过多
这是由于免疫组库是mPCR的文库不是均一的,所以TCGA含量不一致,是正常现象
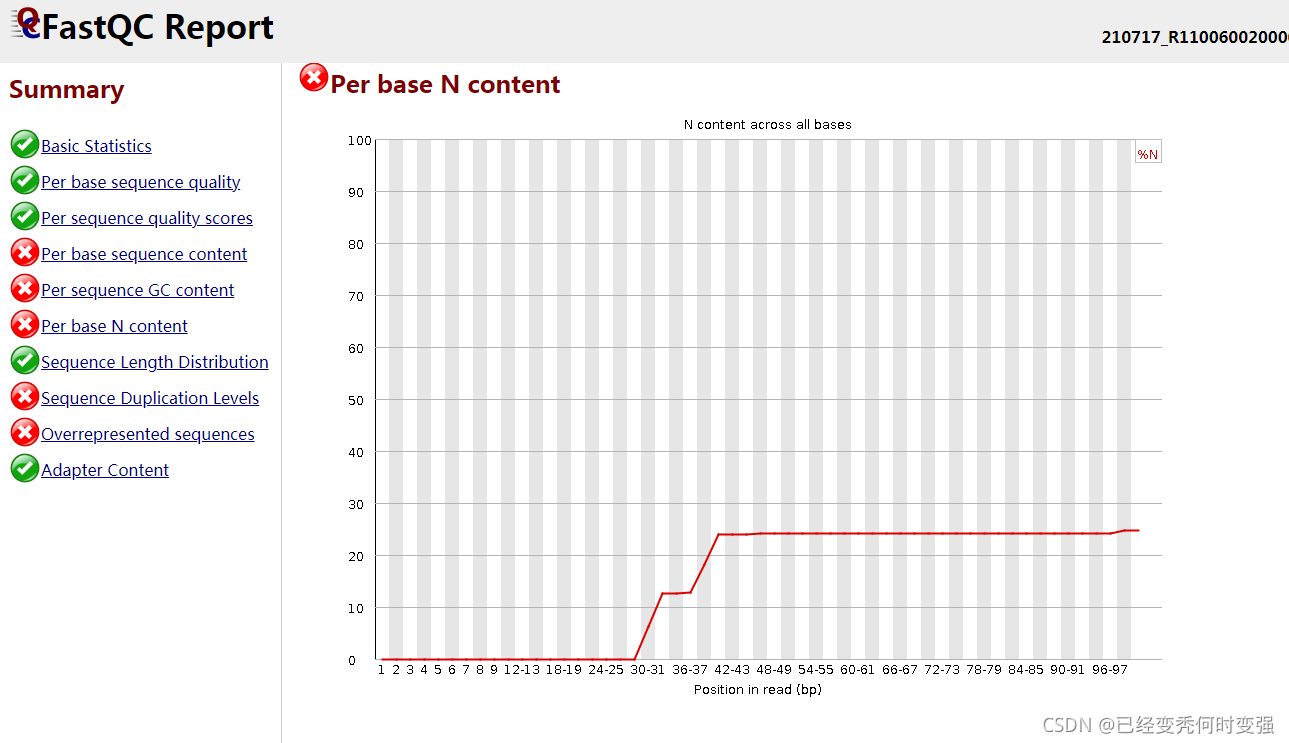
2、Per base N content含量过多
未知的碱基被标记为N,需要用trimmomatic去除N后符合fastqc的标准再进行后续分析
注:剪切过滤后会出现很多短序列
1.2.3 mixcr代码
mixcr analyze amplicon --species hs \
        --adapters no-adapters \
        --starting-material dna \
        --5-end v-primers \
        --3-end j-primers \
        --receptor-type tcr \
        --productive \
/home/zy/TCR/example_A_1_val_1.fq.gz /home/zy/TCR/example_A_2_val_2.fq.gz analysis
#有些用的J-primers有些用的c-primers,不知如何选择,试了之后发现两者跑出来的结果一致
# 问过师兄后说是直接不写5-end和3-end参数也可以
2、筛选functional的CDR3序列
通常使用的过滤条件:
1、序列为productive
2、核酸序列为3的倍数,氨基酸序列大于4
其他的过滤条件
例如:expression abundance(TPM):
已看到几篇文章在使用,alpha chain TPM < 10 or beta chain TPM < 15, 但不确定是公认标准还是个人经验设置
结果部分:In total, we detected full TCR sequences for 94% (3,792/4,032) T cells, with at least one paired productive TCR a-b chain for subsequent analyses (Table S5). While most cells expressed unique TCR a and b alleles, nonunique a and/or b could be detected in a fraction of T cells. After
eliminating non-productive alleles (e.g., out-of-frame transcripts) or low-abundance TCRs (Figure S6A), we found that 84% (3,174/3,792) contained unique and productive a chains and 94% (3,559/3,792) unique and productive b chains (Figure S6B), in agreement with previous reports
方法部分:
TCR analysis
The TCR sequences for each single T cell were assembled by the TraCeR method from single cell RNA-Seq data, leading to the identification of the CDR3 sequence, the rearranged TCR genes, and their expression abundance (transcripts per million, TPM). First, we discard those cells with no obvious TCR forms. Then we arrange TCR alpha and beta chain respectively with the following steps. The first TCR alpha (beta) chain was defined as follows: 1) keep all single T cells in which only one productive TCR alpha and beta chain was present. 2) if more than one TCR alpha or beta chain were identified in one T cell, we kept only the cells in which a dominant form of alpha and beta was detected. Often, one alpha/beta chain was productive and the other chain was non-productive, or the expression level of one was far higher than the alternative allele, and the productive or dominant form was identified. Next, we filtered out the second TCR alpha chains with TPM less than 10 and beta chains with TPM less than 15 to eliminate the biological and bioinformatics error based on the histogram analysis for the expression distribution (Figure S6A). From a total 4032 cells with successfully assembled TCR sequences, we identified the TCR alpha/beta pairs for 3792 cells.
cite: Zheng C, Zheng L, Yoo JK, et al. Landscape of Infiltrating T Cells in Liver Cancer Revealed by Single-Cell Sequencing. Cell. 2017;169(7):1342-1356.e16. doi:10.1016/j.cell.2017.05.035
TCR analysis
To reduce false positive assembly, we filtered out TCR assemblies with alpha chain TPM < 10 or beta chain TPM < 15…Only productive (that is, in frame) TCR alpha–beta pairs were considered to define the dominant TCR of a single cell.
cite: Guo, Xinyi et al. “Global characterization of T cells in non-small-cell lung cancer by single-cell sequencing.” Nature medicine vol. 24,7 (2018): 978-985. doi:10.1038/s41591-018-0045-3


 4138
4138

 被折叠的 条评论
为什么被折叠?
被折叠的 条评论
为什么被折叠?
 到【灌水乐园】发言


