


本篇介绍ggplot2绘图系统的位置调整函数。
library(ggplot2)
library(patchwork)
ggplot2绘图系统的几何图形函数都有一个position参数,默认值为identity:
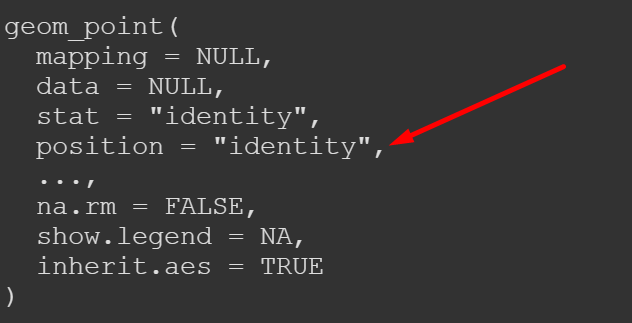
统计变换类函数也包含该参数:
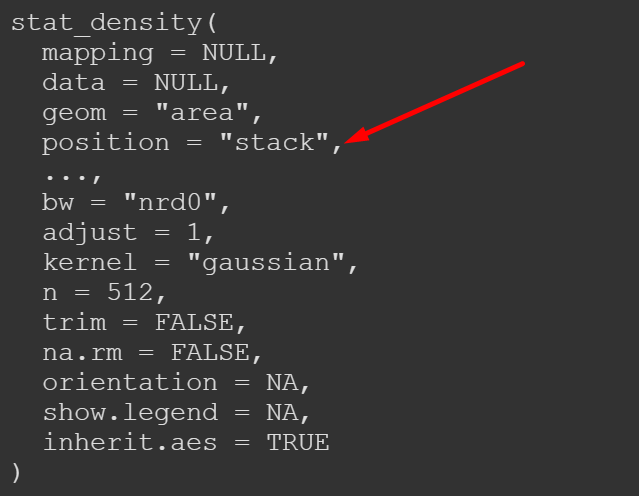
以几何图形函数为例,它们在绘制图形时,图形要素的位置是由映射变量控制的。position参数的作用是通过调用位置调整函数来调整图形要素的实际位置。position_identity()函数表示不进行任何调整。
position_identity()
ggplot2工具包的位置调整函数及其功能如下:
| 参数 | 含义及格式 |
|---|---|
| position_identity | 不调整 |
| position_dodge | 并排 |
| position_dodge2 | 并排 |
| position_stack | 堆积且高度不恒定 |
| position_fill | 堆积且高度恒定 |
| position_nudge | 平移 |
| position_jitter | 抖动 |
| position_jitterdodge | 分组抖动 |
1 并排(Dodge)
并排位置调整函数是position_dodge()和position_dodge2()函数,后者是前者的升级版。语法结构如下:
position_dodge(
  width = NULL,
  preserve = c("total", "single"))

position_dodge2(
  width = NULL,
  preserve = c("total", "single"),
  padding = 0.1,
  reverse = FALSE
)
width:组内不重合的宽度;见下文示例;
preserve:见下文示例;
padding:组内间距;默认值为0.1;
reverse:逻辑型参数;组内是否倒序排列,默认值为FALSE。
并排位置调整函数主要用于具有分组特征的柱形、矩形、箱形、垂线等图形,它使得组内图形并排排列,并通过
width和padding两个参数控制间距。
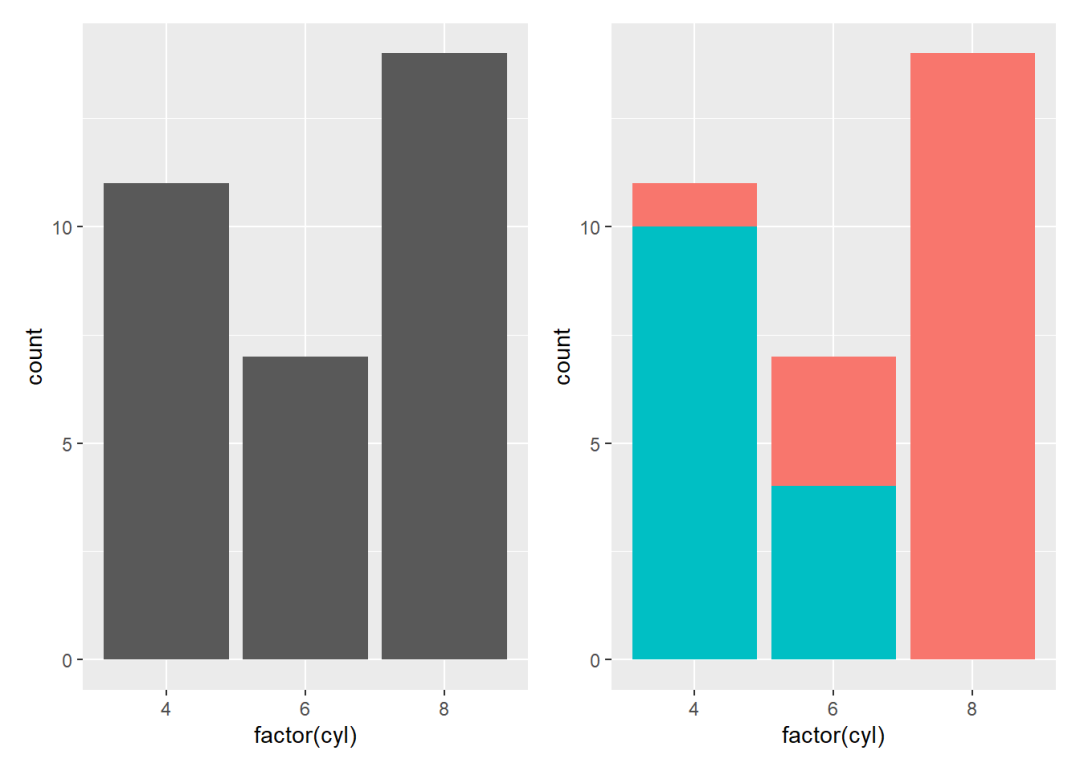
先绘制如下柱形图:
p11 <- ggplot(mtcars, aes(x = factor(cyl))) +
  geom_bar()
p12 <- ggplot(mtcars, aes(x = factor(cyl))) +
  geom_bar(aes(fill = factor(vs))) +
  guides(fill = F)

p11 + p12
通过调用并排位置函数可以将组内堆积的柱形图转换成组内并排的柱形图。以下分别是position_dodge()和position_dodge2()函数的默认效果:
p13 <- ggplot(mtcars, aes(x = factor(cyl))) +
  geom_bar(aes(fill = factor(vs)),
           position = position_dodge()) +
  guides(fill = F)
p14 <- ggplot(mtcars, aes(x = factor(cyl))) +
  geom_bar(aes(fill = factor(vs)),
           position = position_dodge2()) +
  guides(fill = F)

p13 + p14
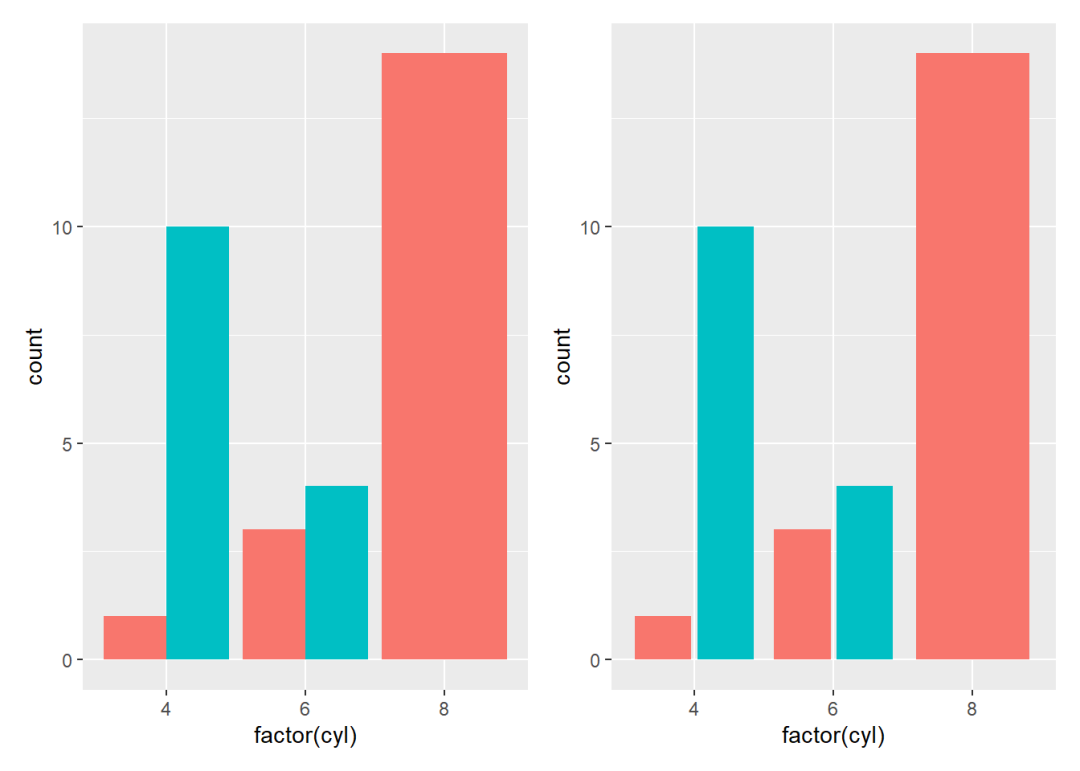
从上图可以看出,两图的主要区别在于右图组内存在间距。
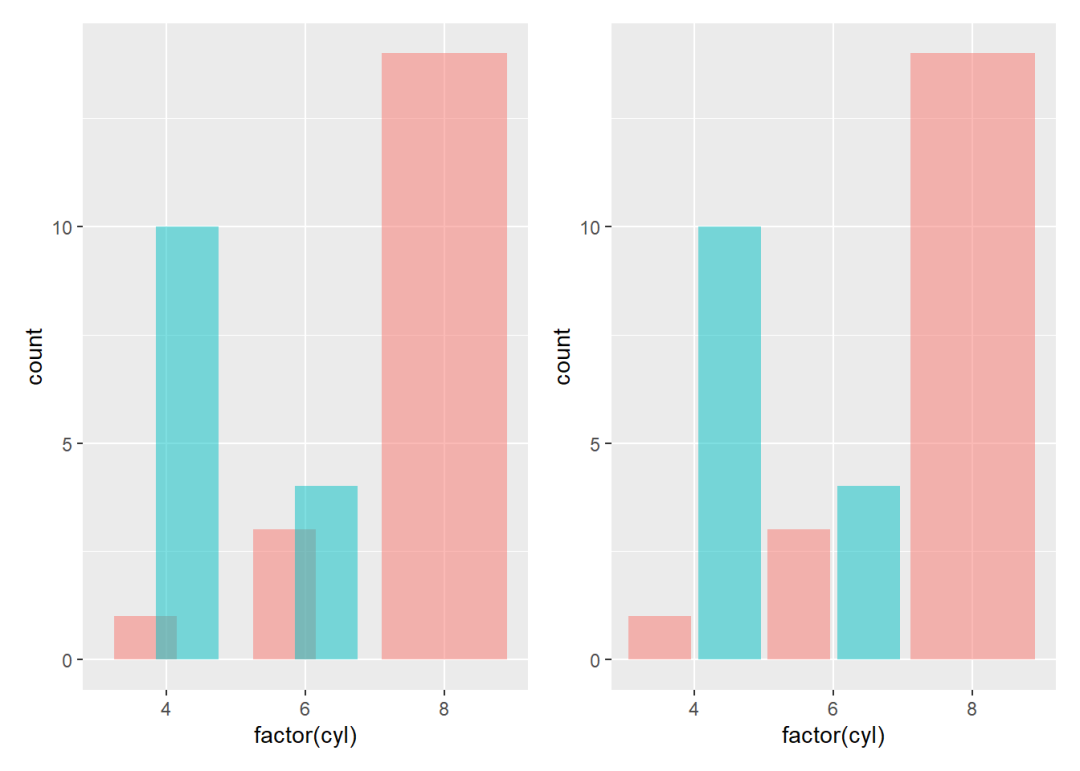
position_dodge()函数只能通过width调整间距:当width = 0时完全重叠;当width = 0.9时刚好相邻不重叠,也是默认值;当width > 0.9时,组内存在间距,数值越大,间距越大。
p15 <- ggplot(mtcars, aes(x = factor(cyl))) +
  geom_bar(aes(fill = factor(vs)),
           position = position_dodge(width = 0.6),
           alpha = 0.5) +
  guides(fill = F)

p16 <- ggplot(mtcars, aes(x = factor(cyl))) +
  geom_bar(aes(fill = factor(vs)),
           position = position_dodge(width = 1),
           alpha = 0.5) +
  guides(fill = F)

p15 + p16
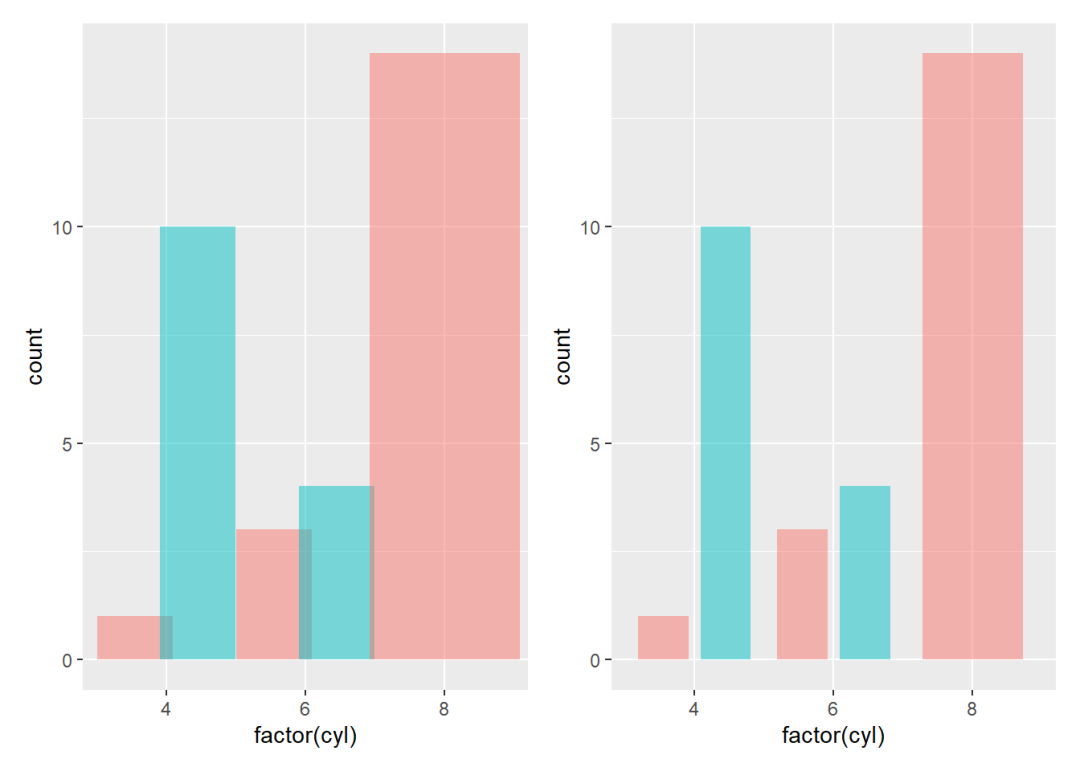
position_dodge2()函数也可以通过width参数调整间距,但通过padding参数调整更为方便和更易理解:padding = 0表示刚好相邻不重叠;负值表示有重叠,绝对值越大重叠部分越大;1表示能允许的最大间距;默认值为0.1。
p17 <- ggplot(mtcars, aes(x = factor(cyl))) +
  geom_bar(aes(fill = factor(vs)),
           position = position_dodge2(padding = -0.2),
           alpha = 0.5) +
  guides(fill = F)

p18 <- ggplot(mtcars, aes(x = factor(cyl))) +
  geom_bar(aes(fill = factor(vs)),
           position = position_dodge2(padding = 0.2),
           alpha = 0.5) +
  guides(fill = F)

p17 + p18
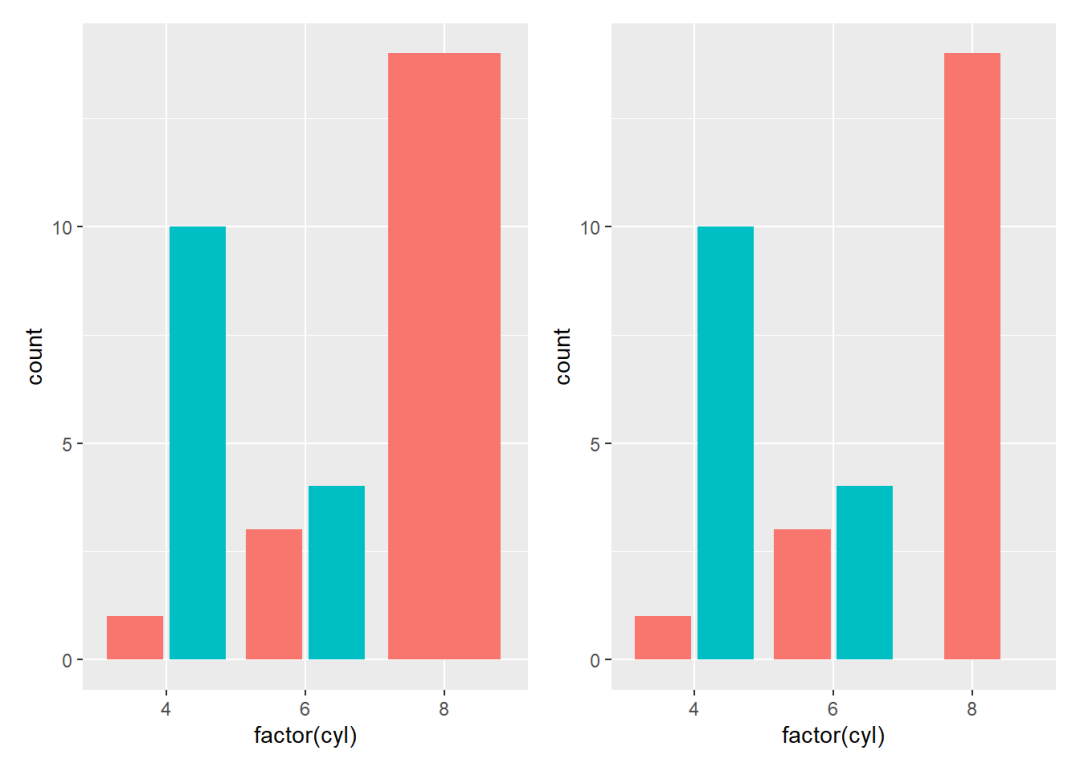
preserve参数可以控制并排后组间的宽度:preserve = "total"表示各组的图形要素总宽度相等;preserve = "single"表示组间各单个图形要素的宽度相等。
p19 <- ggplot(mtcars, aes(x = factor(cyl))) +
  geom_bar(aes(fill = factor(vs)),
           position = position_dodge2(preserve = "total")) +
  guides(fill = F)

p110 <- ggplot(mtcars, aes(x = factor(cyl))) +
  geom_bar(aes(fill = factor(vs)),
           position = position_dodge2(preserve = "single")) +
  guides(fill = F)

p19 + p110
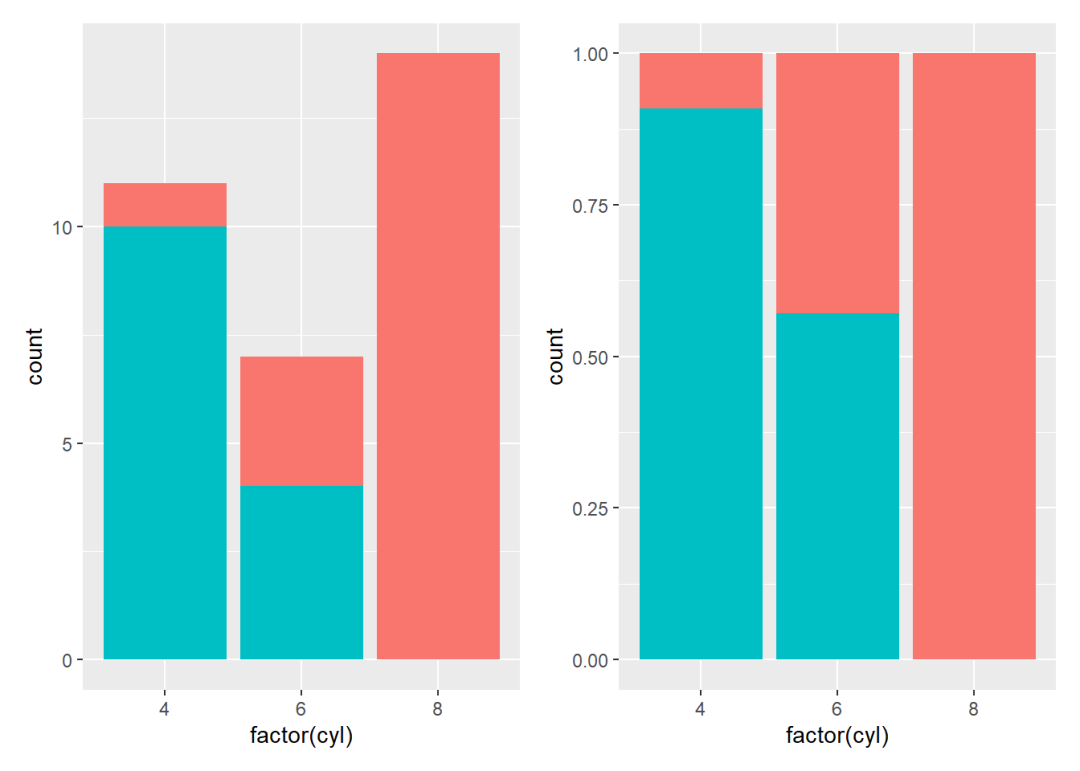
2 堆积(Stack)
堆积位置调整函数也有两个:position_stack()函数采用的是绝对值堆积;position_fill()函数采用的是相对值堆积,因此总高度恒为1。语法结构如下:
position_stack(vjust = 1, reverse = FALSE)

position_fill(vjust = 1, reverse = FALSE)
示例如下:
p21 <- ggplot(mtcars, aes(x = factor(cyl))) +
  geom_bar(aes(fill = factor(vs)),
           position = position_stack()) +
  guides(fill = F)

p22 <- ggplot(mtcars, aes(x = factor(cyl))) +
  geom_bar(aes(fill = factor(vs)),
           position = position_fill()) +
  guides(fill = F)

p21 + p22
t
3 平移(Nudge)
平移位置调整函数的语法结构如下:
position_nudge(x = 0, y = 0)
x、y:横坐标、纵坐标平移单位。
示例如下:
ggplot(mtcars, aes(mpg, drat)) +
  geom_point() +
  geom_point(col = "red",
             position = position_nudge(x = 0.5, y = 0.1))
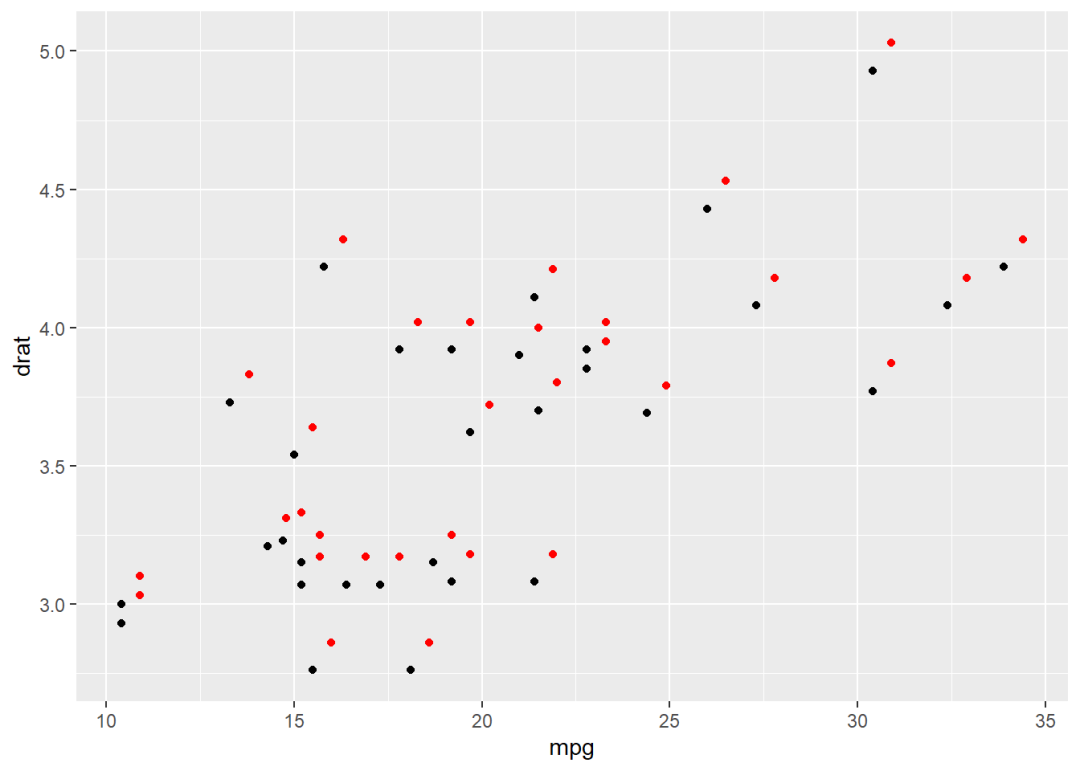
黑点表示原始点;
红点表示平移后的点。
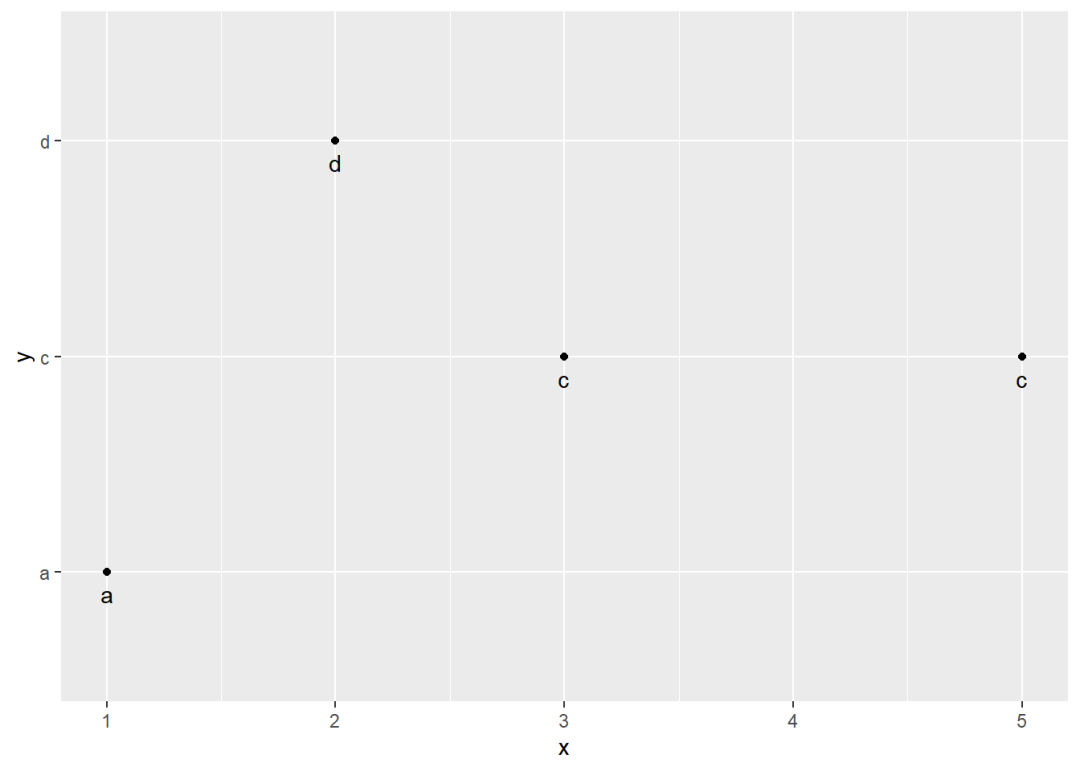
position_nudge()函数常用于文本函数,用于避免文本与图形要素重叠。以下示例来自官方帮助文档:
df <- data.frame(
  x = c(1,3,2,5),
  y = c("a","c","d","c")
)

ggplot(df, aes(x, y)) +
  geom_point() +
  geom_text(aes(label = y),
            position = position_nudge(y = -0.1))
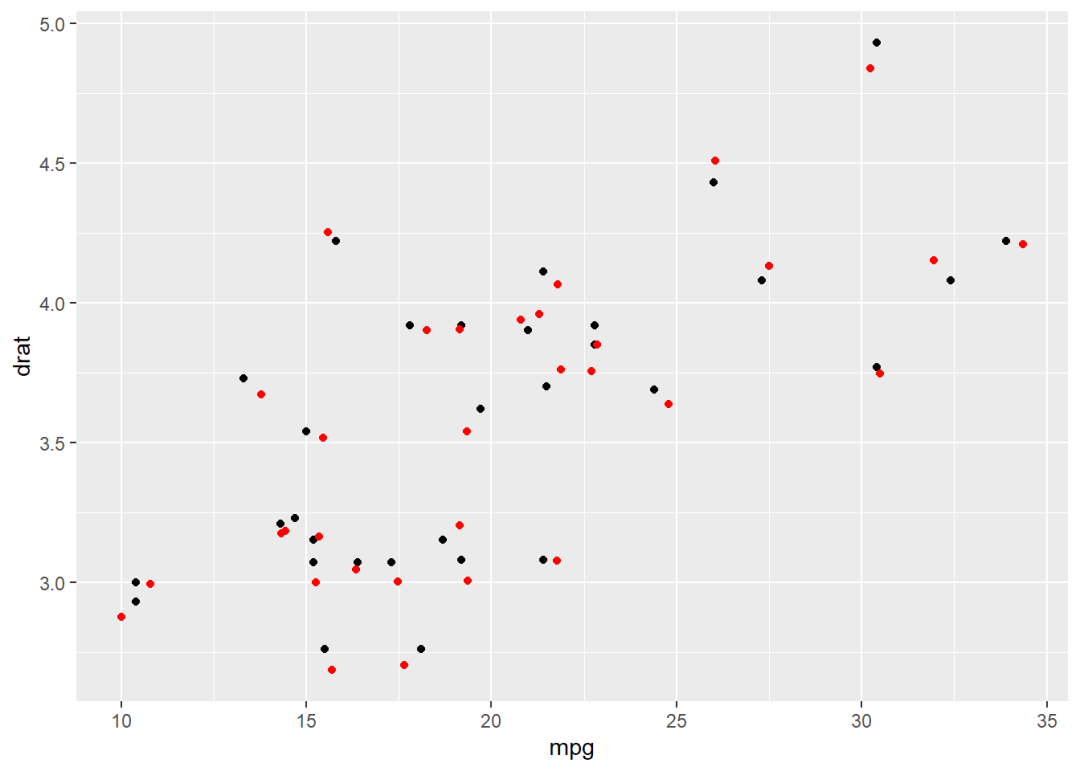
4 抖动(Jitter)
抖动位置调整是一种不定向的随机平移过程,对应的位置函数语法结构如下:
position_jitter(width = NULL, height = NULL, seed = NA)
width、height:横向、纵向抖动的最大幅度;单位与对应坐标轴的刻度相同;
seed:随机数种子;设置后可重复抖动过程。
示例如下:
ggplot(mtcars, aes(mpg, drat)) +
  geom_point() +
  geom_point(col = "red",
             position = position_jitter(width = 0.5, height = 0.1,
                                        seed = 123))
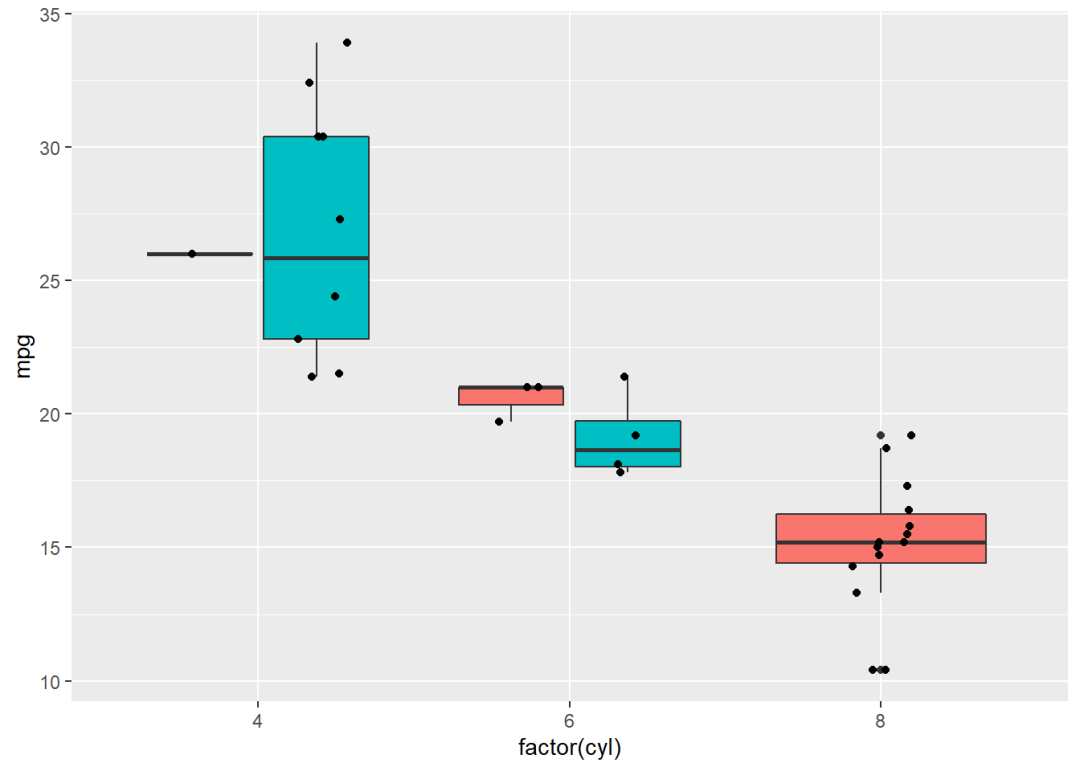
此外,position_jitterdodge()函数可实现分组并排后再进行抖动。语法结构如下:
position_jitterdodge(
  jitter.width = NULL,
  jitter.height = 0,
  dodge.width = 0.75,
  seed = NA
)
示例如下:
ggplot(mtcars, aes(x = factor(cyl), y = mpg,
                   fill = factor(vs))) +
  geom_boxplot() +
  geom_point(position = position_jitterdodge()) +
  guides(fill = F)


 817
817

 被折叠的 条评论
为什么被折叠?
被折叠的 条评论
为什么被折叠?
 到【灌水乐园】发言


