


pandas 是基于NumPy 的一种工具,该工具是为解决数据分析任务而创建的。Pandas 纳入了大量库和一些标准的数据模型,提供了高效地操作大型数据集所需的工具。pandas提供了大量能使我们快速便捷地处理数据的函数和方法。
1.Series
import numpy as np
import pandas as pd
Series类似于一维数组的对象, 由一组数据以及一组与之相关的数据标签(即索引)组成, 即index和values两部分,可以通过索引的方式选取Series中的单个或一组值。 默认index从0开始 NumPy 数组通过隐式定义的整数索引获取数值, 而Pandas的Series对象用一种显式定义的索引与数值关联。
pd.Series([1,3,6,np.nan,33,1])
0 1.0
1 3.0
2 6.0
3 NaN
4 33.0
5 1.0
dtype: float64
score_dict = {'zhangan': 80, 'lisi': 62, 'wangwu': 97}
score= pd.Series(score_dict)
score
zhangan 80
lisi 62
wangwu 97
dtype: int64
score.index
Index([‘zhangan’, ‘lisi’, ‘wangwu’], dtype=‘object’)
score.values
array([80, 62, 97], dtype=int64)
2.DataFrame
2.1 DataFrame的简单运用
DataFrame 是一个表格型的数据类型,每列值类型可以不同 DataFrame既有行索引也有列索引,它可以被看做由Series组成的字典(共用同一个索引)。
pd.DataFrame([{'name': 'zhangsan', 'score': 80,'city':'chengdu'}, {'name': 'lisi', 'score': 87,'sex':'male',}])
name score city sex
0 zhangsan 80 chengdu NaN
1 lisi 87 NaN male
dates = pd.date_range('2020-08-19',periods=6)
dates
DatetimeIndex([‘2020-08-19’, ‘2020-08-20’, ‘2020-08-21’, ‘2020-08-22’,
‘2020-08-23’, ‘2020-08-24’],
dtype=‘datetime64[ns]’, freq=‘D’)
# dates = pd.date_range('2020-08-19','2020-08-24') # 起始、结束  与上述等价
# numpy.random.randn(d0, d1, …, dn)是从标准正态分布中返回一个或多个样本值。
df=pd.DataFrame(np.random.randn(6,4),index=dates,columns=['col1','col2','col3','col4'])
df
col1 col2 col3 col4
2020-08-19 -0.472738 0.608360 -0.768871 0.153302
2020-08-20 -0.855040 -0.191934 -0.053564 0.415958
2020-08-21 0.745352 0.512216 0.827354 1.533849
2020-08-22 -0.868897 -0.535029 -0.753466 -1.338100
2020-08-23 1.925336 -0.557660 0.920783 1.000471
2020-08-24 -1.700017 -0.232212 1.032795 -0.590229
# 取出一列的值
df['col3']
# 取出某个单元格的值
df['col3']['2020-08-22']
-0.7534658565068821
# 未指定行标签和列标签的数据,从0开始
pd.DataFrame(np.arange(12).reshape(3,4))
0 1 2 3
0 0 1 2 3
1 4 5 6 7
2 8 9 10 11
# 根据列构造DF
df2=pd.DataFrame({
    'A': [1,2,3,4],
    'B': pd.Timestamp('20210606'),
    'C': pd.Series([1,6,9,10],dtype='float32'),
    'D': np.array([3] * 4,dtype='int32'),
    'E': pd.Categorical(['test','train','test','train']),
    'F': 'foo'
})
df2
A B C D E F
0 1 2021-06-06 1.0 3 test foo
1 2 2021-06-06 6.0 3 train foo
2 3 2021-06-06 9.0 3 test foo
3 4 2021-06-06 10.0 3 train foo
#索引
df2.index
RangeIndex(start=0, stop=4, step=1)
# 显示所有列名称
df2.columns
Index([‘A’, ‘B’, ‘C’, ‘D’, ‘E’, ‘F’], dtype=‘object’)
# 显示所有的值
df2.values
array([[1, Timestamp(‘2021-06-06 00:00:00’), 1.0, 3, ‘test’, ‘foo’],
[2, Timestamp(‘2021-06-06 00:00:00’), 6.0, 3, ‘train’, ‘foo’],
[3, Timestamp(‘2021-06-06 00:00:00’), 9.0, 3, ‘test’, ‘foo’],
[4, Timestamp(‘2021-06-06 00:00:00’), 10.0, 3, ‘train’, ‘foo’]],
dtype=object)
# 数据总结
df2.describe()
A C D
count 4.000000 4.000000 4.0
mean 2.500000 6.500000 3.0
std 1.290994 4.041452 0.0
min 1.000000 1.000000 3.0
25% 1.750000 4.750000 3.0
50% 2.500000 7.500000 3.0
75% 3.250000 9.250000 3.0
max 4.000000 10.000000 3.0
# 数据转置
# np.transpose(df2)
df2.T
0 1 2 3
A 1 2 3 4
B 2021-06-06 00:00:00 2021-06-06 00:00:00 2021-06-06 00:00:00 2021-06-06 00:00:00
C 1.0 6.0 9.0 10.0
D 3 3 3 3
E test train test train
F foo foo foo foo
axis=1表示行 axis=0表示列 默认ascending(升序)为True ascending=True表示升序,ascending=False表示降序 按照行的升序
df2.sort_index(axis=1,ascending=True)
A B C D E F
0 1 2021-06-06 1.0 3 test foo
1 2 2021-06-06 6.0 3 train foo
2 3 2021-06-06 9.0 3 test foo
3 4 2021-06-06 10.0 3 train foo
# 按照行降序
df2.sort_index(axis=1,ascending=False)
F E D C B A
0 foo test 3 1.0 2021-06-06 1
1 foo train 3 6.0 2021-06-06 2
2 foo test 3 9.0 2021-06-06 3
3 foo train 3 10.0 2021-06-06 4
# 表示按列降序与按列升序
df2.sort_index(axis=0,ascending=False)
A B C D E F
3 4 2021-06-06 10.0 3 train foo
2 3 2021-06-06 9.0 3 test foo
1 2 2021-06-06 6.0 3 train foo
0 1 2021-06-06 1.0 3 test foo
df2.sort_index(axis=0,ascending=True)
A B C D E F
0 1 2021-06-06 1.0 3 test foo
1 2 2021-06-06 6.0 3 train foo
2 3 2021-06-06 9.0 3 test foo
3 4 2021-06-06 10.0 3 train foo
# 对特定列数值排列,表示对C列降序排列
df2.sort_values(by='C',ascending=False)
A B C D E F
3 4 2021-06-06 10.0 3 train foo
2 3 2021-06-06 9.0 3 test foo
1 2 2021-06-06 6.0 3 train foo
0 1 2021-06-06 1.0 3 test foo
3.pandas选择数据
3.1 筛选
dates = pd.date_range('20200819', periods=6)
df = pd.DataFrame(np.arange(24).reshape((6,4)),index=dates, columns=['A','B','C','D'])
df
A B C D
2020-08-19 0 1 2 3
2020-08-20 4 5 6 7
2020-08-21 8 9 10 11
2020-08-22 12 13 14 15
2020-08-23 16 17 18 19
2020-08-24 20 21 22 23
# 检索A列
df['A']
2020-08-19 0
2020-08-20 4
2020-08-21 8
2020-08-22 12
2020-08-23 16
2020-08-24 20
Freq: D, Name: A, dtype: int32
df.A
2020-08-19 0
2020-08-20 4
2020-08-21 8
2020-08-22 12
2020-08-23 16
2020-08-24 20
Freq: D, Name: A, dtype: int32
# 选择跨越多行或多列
# 选取前3行
df[1:3]
A B C D
2020-08-20 4 5 6 7
2020-08-21 8 9 10 11
df['2020-08-19':'2020-08-21']
A B C D
2020-08-19 0 1 2 3
2020-08-20 4 5 6 7
2020-08-21 8 9 10 11
# 根据标签选择数据
# 获取特定行或列
# 指定行数据
df.loc['20200819']
A 0
B 1
C 2
D 3
Name: 2020-08-19 00:00:00, dtype: int32
# 指定列
# 两种方式
df.loc[:,'A':'B']
A B
2020-08-19 0 1
2020-08-20 4 5
2020-08-21 8 9
2020-08-22 12 13
2020-08-23 16 17
2020-08-24 20 21
df.loc[:,['A','B']]
A B
2020-08-19 0 1
2020-08-20 4 5
2020-08-21 8 9
2020-08-22 12 13
2020-08-23 16 17
2020-08-24 20 21
# 行与列同时检索
df.loc['20200819',['A','B']]
A 0
B 1
Name: 2020-08-19 00:00:00, dtype: int32
# 根据序列iloc
# 获取特定位置的值
df
A B C D
2020-08-19 0 1 2 3
2020-08-20 4 5 6 7
2020-08-21 8 9 10 11
2020-08-22 12 13 14 15
2020-08-23 16 17 18 19
2020-08-24 20 21 22 23
df.iloc[3,1]
13
# 不包含5或3,同列表切片
df.iloc[3:5,1:3]
B C
2020-08-22 13 14
2020-08-23 17 18
# 跨行操作
df.iloc[[1,3,5],1:3]
B C
2020-08-20 5 6
2020-08-22 13 14
2020-08-24 21 22
print(df.iloc[:3,[0,2]]) # 结果同上
A C
2020-08-19 0 2
2020-08-20 4 6
2020-08-21 8 10
# 通过判断的筛选
df[df.A>8]
A B C D
2020-08-22 12 13 14 15
2020-08-23 16 17 18 19
2020-08-24 20 21 22 23
# 通过判断的筛选
df.loc[df.A>8]
A B C D
2020-08-22 12 13 14 15
2020-08-23 16 17 18 19
2020-08-24 20 21 22 23
df.loc['20200819','A':'B']
A 0
B 1
Name: 2020-08-19 00:00:00, dtype: int32
df.iloc[0,0:2]
A 0
B 1
Name: 2020-08-19 00:00:00, dtype: int32
4.Pandas设置值
4.1 创建数据
# 创建数据
dates = pd.date_range('20200820',periods=6)
df = pd.DataFrame(np.arange(24).reshape(6,4), index=dates, columns=['A','B','C','D'])
df
A B C D
2020-08-20 0 1 2 3
2020-08-21 4 5 6 7
2020-08-22 8 9 10 11
2020-08-23 12 13 14 15
2020-08-24 16 17 18 19
2020-08-25 20 21 22 23
4.2 根据位置设置loc和iloc
# 根据位置设置loc和iloc
df.iloc[2,2] = 111
df.loc['20200820','B'] = 2222
df
A B C D
2020-08-20 0 2222 2 3
2020-08-21 4 5 6 7
2020-08-22 8 9 111 11
2020-08-23 12 13 14 15
2020-08-24 16 17 18 19
2020-08-25 20 21 22 23
4.3 根据条件设置
# 根据条件设置
# 更改B中的数,而更改的位置取决于4的位置,并设相应位置的数为0
df.B[df.A>4] = 0
df
A B C D
2020-08-20 0 2222 2 3
2020-08-21 4 5 6 7
2020-08-22 8 0 111 11
2020-08-23 12 0 14 15
2020-08-24 16 0 18 19
2020-08-25 20 0 22 23
df.B.loc[df.A>4] = 0
df
A B C D
2020-08-20 0 2222 2 3
2020-08-21 4 5 6 7
2020-08-22 8 0 111 11
2020-08-23 12 0 14 15
2020-08-24 16 0 18 19
2020-08-25 20 0 22 23
4.4 按行或列设置
# 按行或列设置
# 列批处理,F列全改为NaN
df['F'] = np.nan
df
A B C D F
2020-08-20 0 2222 2 3 NaN
2020-08-21 4 5 6 7 NaN
2020-08-22 8 0 111 11 NaN
2020-08-23 12 0 14 15 NaN
2020-08-24 16 0 18 19 NaN
2020-08-25 20 0 22 23 NaN
4.5 添加Series序列(长度必须对齐)
ser=pd.Series([1,2,3,4,5,6], index=pd.date_range('20200820',periods=6))
ser
2020-08-20 1
2020-08-21 2
2020-08-22 3
2020-08-23 4
2020-08-24 5
2020-08-25 6
Freq: D, dtype: int64
df['E']=ser
df
A B C D F E
2020-08-20 0 2222 2 3 NaN 1
2020-08-21 4 5 6 7 NaN 2
2020-08-22 8 0 111 11 NaN 3
2020-08-23 12 0 14 15 NaN 4
2020-08-24 16 0 18 19 NaN 5
2020-08-25 20 0 22 23 NaN 6
df.loc['20200820','A'] = 67
df
A B C D F E
2020-08-20 67 2222 2 3 NaN 1
2020-08-21 4 5 6 7 NaN 2
2020-08-22 8 0 111 11 NaN 3
2020-08-23 12 0 14 15 NaN 4
2020-08-24 16 0 18 19 NaN 5
2020-08-25 20 0 22 23 NaN 6
df.iloc[0,0] = 76
df
A B C D F E
2020-08-20 76 2222 2 3 NaN 1
2020-08-21 4 5 6 7 NaN 2
2020-08-22 8 0 111 11 NaN 3
2020-08-23 12 0 14 15 NaN 4
2020-08-24 16 0 18 19 NaN 5
2020-08-25 20 0 22 23 NaN 6
4.6 修改一整行数据
# 修改一整行数据
df.iloc[1] = np.nan # df.iloc[1,:]=np.nan
df
A B C D F E
2020-08-20 76.0 2222.0 2.0 3.0 NaN 1.0
2020-08-21 NaN NaN NaN NaN NaN NaN
2020-08-22 8.0 0.0 111.0 11.0 NaN 3.0
2020-08-23 12.0 0.0 14.0 15.0 NaN 4.0
2020-08-24 16.0 0.0 18.0 19.0 NaN 5.0
2020-08-25 20.0 0.0 22.0 23.0 NaN 6.0
df.loc['20200820'] = np.nan # df.loc['20180820,:']=np.nan
df
A B C D F E
2020-08-20 NaN NaN NaN NaN NaN NaN
2020-08-21 NaN NaN NaN NaN NaN NaN
2020-08-22 8.0 0.0 111.0 11.0 NaN 3.0
2020-08-23 12.0 0.0 14.0 15.0 NaN 4.0
2020-08-24 16.0 0.0 18.0 19.0 NaN 5.0
2020-08-25 20.0 0.0 22.0 23.0 NaN 6.0
5.Pandas处理丢失数据
5.1 创建含NaN的矩阵
# Pandas处理丢失数据
# 创建含NaN的矩阵
# 如何填充和删除NaN数据?
dates = pd.date_range('20200820',periods=6)
df = pd.DataFrame(np.arange(24).reshape((6,4)),index=dates,columns=['A','B','C','D'])
df
A B C D
2020-08-20 0 1 2 3
2020-08-21 4 5 6 7
2020-08-22 8 9 10 11
2020-08-23 12 13 14 15
2020-08-24 16 17 18 19
2020-08-25 20 21 22 23
# a.reshape(6,4)等价于a.reshape((6,4))
df.iloc[0,1] = np.nan
df.iloc[1,2] = np.nan
df
A B C D
2020-08-20 0 NaN 2.0 3
2020-08-21 4 5.0 NaN 7
2020-08-22 8 9.0 10.0 11
2020-08-23 12 13.0 14.0 15
2020-08-24 16 17.0 18.0 19
2020-08-25 20 21.0 22.0 23
5.2 删除掉有NaN的行或列
# 删除掉有NaN的行或列
df.dropna() # 默认是删除掉含有NaN的行
A B C D
2020-08-22 8 9.0 10.0 11
2020-08-23 12 13.0 14.0 15
2020-08-24 16 17.0 18.0 19
2020-08-25 20 21.0 22.0 23
df.dropna(
axis=0, # 0对行进行操作;1对列进行操作
how=‘any’ # ‘any’:只要存在NaN就drop掉;‘all’:必须全部是NaN才drop )
A B C D
2020-08-22 8 9.0 10.0 11
2020-08-23 12 13.0 14.0 15
2020-08-24 16 17.0 18.0 19
2020-08-25 20 21.0 22.0 23
# 删除掉所有含有NaN的列
df.dropna(
    axis=1,
    how='any'
)
A D
2020-08-20 0 3
2020-08-21 4 7
2020-08-22 8 11
2020-08-23 12 15
2020-08-24 16 19
2020-08-25 20 23
5.3 替换NaN值为0或者其他
# 替换NaN值为0或者其他
df.fillna(value=0)
A B C D
2020-08-20 0 0.0 2.0 3
2020-08-21 4 5.0 0.0 7
2020-08-22 8 9.0 10.0 11
2020-08-23 12 13.0 14.0 15
2020-08-24 16 17.0 18.0 19
2020-08-25 20 21.0 22.0 23
5.4 是否有缺失数据NaN
# 是否有缺失数据NaN
# 是否为空
df.isnull()
A B C D
2020-08-20 False True False False
2020-08-21 False False True False
2020-08-22 False False False False
2020-08-23 False False False False
2020-08-24 False False False False
2020-08-25 False False False False
# 是否为NaN
df.isna()
A B C D
2020-08-20 False True False False
2020-08-21 False False True False
2020-08-22 False False False False
2020-08-23 False False False False
2020-08-24 False False False False
2020-08-25 False False False False
# 检测某列是否有缺失数据NaN
df.isnull().any()
A False
B True
C True
D False
dtype: bool
# 检测数据中是否存在NaN,如果存在就返回True
np.any(df.isnull())==True
True
6.Pandas导入导出
6.1 导入数据
# 读取csv
data = pd.read_csv('student.csv')
# 打印出data
data
Student ID name age gender
0 1100 Kelly 22 Female
1 1101 Clo 21 Female
2 1102 Tilly 22 Female
3 1103 Tony 24 Male
4 1104 David 20 Male
5 1105 Catty 22 Female
6 1106 M 3 Female
7 1107 N 43 Male
8 1108 A 13 Male
9 1109 S 12 Male
10 1110 David 33 Male
11 1111 Dw 3 Female
12 1112 Q 23 Male
13 1113 W 21 Female
# 前三行
data.head(3)
Student ID name age gender
0 1100 Kelly 22 Female
1 1101 Clo 21 Female
2 1102 Tilly 22 Female
# 后三行
data.tail(3)
Student ID name age gender
11 1111 Dw 3 Female
12 1112 Q 23 Male
13 1113 W 21 Female
6.2 导出数据
# 将资料存取成pickle,pickle模块实现了用于序列化和反序列化Python对象结构的二进制协议
data.to_pickle('student.pickle')
# 读取pickle文件并打印
print(pd.read_pickle(‘student.pickle’))
Student ID name age gender
0 1100 Kelly 22 Female
1 1101 Clo 21 Female
2 1102 Tilly 22 Female
3 1103 Tony 24 Male
4 1104 David 20 Male
5 1105 Catty 22 Female
6 1106 M 3 Female
7 1107 N 43 Male
8 1108 A 13 Male
9 1109 S 12 Male
10 1110 David 33 Male
11 1111 Dw 3 Female
12 1112 Q 23 Male
13 1113 W 21 Female
7.Pandas合并操作
7.1 Pandas合并concat
# 定义资料集
df1 = pd.DataFrame(np.ones((3,4))*0, columns=['a','b','c','d'])
df2 = pd.DataFrame(np.ones((3,4))*1, columns=['a','b','c','d'])
df3 = pd.DataFrame(np.ones((3,4))*2, columns=['a','b','c','d'])
df1
a b c d
0 0.0 0.0 0.0 0.0
1 0.0 0.0 0.0 0.0
2 0.0 0.0 0.0 0.0
df2
a b c d
0 1.0 1.0 1.0 1.0
1 1.0 1.0 1.0 1.0
2 1.0 1.0 1.0 1.0
df3
a b c d
0 2.0 2.0 2.0 2.0
1 2.0 2.0 2.0 2.0
2 2.0 2.0 2.0 2.0
# concat纵向合并
pd.concat([df1,df2,df3],axis=0)
a b c d
0 0.0 0.0 0.0 0.0
1 0.0 0.0 0.0 0.0
2 0.0 0.0 0.0 0.0
0 1.0 1.0 1.0 1.0
1 1.0 1.0 1.0 1.0
2 1.0 1.0 1.0 1.0
0 2.0 2.0 2.0 2.0
1 2.0 2.0 2.0 2.0
2 2.0 2.0 2.0 2.0
# 上述合并过程中,index重复,下面给出重置index方法
# 只需要将index_ignore设定为True即可
pd.concat([df1,df2,df3],axis=0,ignore_index=True)
a b c d
0 0.0 0.0 0.0 0.0
1 0.0 0.0 0.0 0.0
2 0.0 0.0 0.0 0.0
3 1.0 1.0 1.0 1.0
4 1.0 1.0 1.0 1.0
5 1.0 1.0 1.0 1.0
6 2.0 2.0 2.0 2.0
7 2.0 2.0 2.0 2.0
8 2.0 2.0 2.0 2.0
# join 合并方式
#定义资料集
df1 = pd.DataFrame(np.ones((3,4))*0, columns=['a','b','c','d'], index=[1,2,3])
df2 = pd.DataFrame(np.ones((3,4))*1, columns=['b','c','d','e'], index=[2,3,4])
df1
a b c d
1 0.0 0.0 0.0 0.0
2 0.0 0.0 0.0 0.0
3 0.0 0.0 0.0 0.0
df2
b c d e
2 1.0 1.0 1.0 1.0
3 1.0 1.0 1.0 1.0
4 1.0 1.0 1.0 1.0
'''
join='outer',函数默认为join='outer'。此方法是依照column来做纵向合并,有相同的column上下合并在一起,
其他独自的column各自成列,原来没有值的位置皆为NaN填充。
'''
# 纵向"外"合并df1与df2
pd.concat([df1,df2],axis=0,join='outer',sort=False)
a b c d e
1 0.0 0.0 0.0 0.0 NaN
2 0.0 0.0 0.0 0.0 NaN
3 0.0 0.0 0.0 0.0 NaN
2 NaN 1.0 1.0 1.0 1.0
3 NaN 1.0 1.0 1.0 1.0
4 NaN 1.0 1.0 1.0 1.0
# 修改index
pd.concat([df1,df2],axis=0,join='outer',ignore_index=True,sort=True)
a b c d e
0 0.0 0.0 0.0 0.0 NaN
1 0.0 0.0 0.0 0.0 NaN
2 0.0 0.0 0.0 0.0 NaN
3 NaN 1.0 1.0 1.0 1.0
4 NaN 1.0 1.0 1.0 1.0
5 NaN 1.0 1.0 1.0 1.0
# join='inner'合并相同的字段
# 纵向"内"合并df1与df2
pd.concat([df1,df2],axis=0,join='inner')
b c d
1 0.0 0.0 0.0
2 0.0 0.0 0.0
3 0.0 0.0 0.0
2 1.0 1.0 1.0
3 1.0 1.0 1.0
4 1.0 1.0 1.0
# join_axes(依照axes合并)
#定义资料集
df1 = pd.DataFrame(np.ones((3,4))*0, columns=['a','b','c','d'], index=[1,2,3])
df2 = pd.DataFrame(np.ones((3,4))*1, columns=['b','c','d','e'], index=[2,3,4])
df1
a b c d
1 0.0 0.0 0.0 0.0
2 0.0 0.0 0.0 0.0
3 0.0 0.0 0.0 0.0
df2
b c d e
2 1.0 1.0 1.0 1.0
3 1.0 1.0 1.0 1.0
4 1.0 1.0 1.0 1.0
# 依照df1.index进行横向合并
pd.concat([df1,df2],axis=1,join_axes=[df1.index])
a b c d b c d e
1 0.0 0.0 0.0 0.0 NaN NaN NaN NaN
2 0.0 0.0 0.0 0.0 1.0 1.0 1.0 1.0
3 0.0 0.0 0.0 0.0 1.0 1.0 1.0 1.0
# 移除join_axes参数,打印结果
pd.concat([df1,df2],axis=1)
a b c d b c d e
1 0.0 0.0 0.0 0.0 NaN NaN NaN NaN
2 0.0 0.0 0.0 0.0 1.0 1.0 1.0 1.0
3 0.0 0.0 0.0 0.0 1.0 1.0 1.0 1.0
4 NaN NaN NaN NaN 1.0 1.0 1.0 1.0
# append(添加数据)
# append只有纵向合并,没有横向合并
#定义资料集
df1 = pd.DataFrame(np.ones((3,4))*0, columns=['a','b','c','d'])
df2 = pd.DataFrame(np.ones((3,4))*1, columns=['a','b','c','d'])
df3 = pd.DataFrame(np.ones((3,4))*2, columns=['a','b','c','d'])
s1 = pd.Series([1,2,3,4], index=['a','b','c','d'])
# 将df2合并到df1下面,以及重置index,并打印出结果
df1.append(df2,ignore_index=True)
a b c d
0 0.0 0.0 0.0 0.0
1 0.0 0.0 0.0 0.0
2 0.0 0.0 0.0 0.0
3 1.0 1.0 1.0 1.0
4 1.0 1.0 1.0 1.0
5 1.0 1.0 1.0 1.0
# 合并多个df,将df2与df3合并至df1的下面,以及重置index,并打印出结果
df1.append([df2,df3], ignore_index=True)
a b c d
0 0.0 0.0 0.0 0.0
1 0.0 0.0 0.0 0.0
2 0.0 0.0 0.0 0.0
3 1.0 1.0 1.0 1.0
4 1.0 1.0 1.0 1.0
5 1.0 1.0 1.0 1.0
6 2.0 2.0 2.0 2.0
7 2.0 2.0 2.0 2.0
8 2.0 2.0 2.0 2.0
# 合并series,将s1合并至df1,以及重置index,并打印结果 df1.append(s1,ignore_index=True)
a b c d
0 0.0 0.0 0.0 0.0
1 0.0 0.0 0.0 0.0
2 0.0 0.0 0.0 0.0
3 1.0 2.0 3.0 4.0
# 总结:两种常用合并方式
pd.concat([df1, df2, df3], axis=0, ignore_index=True)
df1.append([df2, df3], ignore_index=True)
7.2.Pandas 合并 merge
7.2.1 定义资料集并打印出
# 依据一组key合并
# 定义资料集并打印出
left = pd.DataFrame({'key' : ['K0','K1','K2','K3'],
'A' : ['A0','A1','A2','A3'],
'B' : ['B0','B1','B2','B3']})
right = pd.DataFrame({'key': ['K0', 'K1', 'K2', 'K3'],
'C' : ['C0', 'C1', 'C2', 'C3'],
'D' : ['D0', 'D1', 'D2', 'D3']})
left
key A B
0 K0 A0 B0
1 K1 A1 B1
2 K2 A2 B2
3 K3 A3 B3
right
key C D
0 K0 C0 D0
1 K1 C1 D1
2 K2 C2 D2
3 K3 C3 D3
7.2.2 依据key column合并,并打印
# 依据key column合并,并打印
# select left_table.key,left_table.A,right_table.B from left_table left join right_table on left_table.key=right_table.key
pd.merge(left,right,on='key')
key A B C D
0 K0 A0 B0 C0 D0
1 K1 A1 B1 C1 D1
2 K2 A2 B2 C2 D2
3 K3 A3 B3 C3 D3
#  依据两组key合并
#定义资料集并打印出
left = pd.DataFrame({'key1': ['K0', 'K0', 'K1', 'K2'],
                      'key2': ['K0', 'K1', 'K0', 'K1'],
                      'A': ['A0', 'A1', 'A2', 'A3'],
                      'B': ['B0', 'B1', 'B2', 'B3']})
right = pd.DataFrame({'key1': ['K0', 'K1', 'K1', 'K2'],
                       'key2': ['K0', 'K0', 'K0', 'K0'],
                       'C': ['C0', 'C1', 'C2', 'C3'],
                       'D': ['D0', 'D1', 'D2', 'D3']})
left
key1 key2 A B
0 K0 K0 A0 B0
1 K0 K1 A1 B1
2 K1 K0 A2 B2
3 K2 K1 A3 B3
right
key1 key2 C D
0 K0 K0 C0 D0
1 K1 K0 C1 D1
2 K1 K0 C2 D2
3 K2 K0 C3 D3
7.2.3 两列合并
# 依据key1与key2 columns进行合并,并打印出四种结果['left', 'right', 'outer', 'inner']
pd.merge(left, right, on=['key1', 'key2'], how='inner')
key1 key2 A B C D
0 K0 K0 A0 B0 C0 D0
1 K1 K0 A2 B2 C1 D1
2 K1 K0 A2 B2 C2 D2
pd.merge(left, right, on=['key1', 'key2'], how='outer')
key1 key2 A B C D
0 K0 K0 A0 B0 C0 D0
1 K0 K1 A1 B1 NaN NaN
2 K1 K0 A2 B2 C1 D1
3 K1 K0 A2 B2 C2 D2
4 K2 K1 A3 B3 NaN NaN
5 K2 K0 NaN NaN C3 D3
pd.merge(left, right, on=['key1', 'key2'], how='left')
key1 key2 A B C D
0 K0 K0 A0 B0 C0 D0
1 K0 K1 A1 B1 NaN NaN
2 K1 K0 A2 B2 C1 D1
3 K1 K0 A2 B2 C2 D2
4 K2 K1 A3 B3 NaN NaN
pd.merge(left, right, on=['key1', 'key2'], how='right')
key1 key2 A B C D
0 K0 K0 A0 B0 C0 D0
1 K1 K0 A2 B2 C1 D1
2 K1 K0 A2 B2 C2 D2
3 K2 K0 NaN NaN C3 D3
7.2.4 Indicator设置合并列名称
# Indicator
df1 = pd.DataFrame({'col1':[0,1],'col_left':['a','b']})
df2 = pd.DataFrame({'col1':[1,2,2],'col_right':[2,2,2]})
df1
df2
# 依据col1进行合并,并启用indicator=True,最后打印
#  indicator=True会将合并的记录放在新的一列
pd.merge(df1,df2,on='col1',how='outer',indicator=True)
# pd.merge(df1,df2,on='col1',how='outer',indicator=False)
# 自定义indicator column的名称,并打印出
pd.merge(df1,df2,on='col1',how='outer',indicator='indicator_column')
7.2.5 依据index合并
# 依据index合并
#定义资料集并打印出
left = pd.DataFrame({'A': ['A0', 'A1', 'A2'],
                     'B': ['B0', 'B1', 'B2']},
                     index=['K0', 'K1', 'K2'])
right = pd.DataFrame({'C': ['C0', 'C2', 'C3'],
                      'D': ['D0', 'D2', 'D3']},
                     index=['K0', 'K2', 'K3'])
left
right
# 依据左右资料集的index进行合并,how='outer',并打印
# inner(默认);outer、left、right
pd.merge(left,right,left_index=True,right_index=True,how='outer')
# 依据左右资料集的index进行合并,how='inner',并打印
pd.merge(left,right,left_index=True,right_index=True,how='inner')
7.2.6 解决overlapping的问题
# 解决overlapping 重叠 的问题
#
boys = pd.DataFrame({'k': ['K0', 'K1', 'K2'], 'age': [1, 2, 3]})
girls = pd.DataFrame({'k': ['K0', 'K0', 'K3'], 'age': [4, 5, 6]})
boys
k age
0 K0 1
1 K1 2
2 K2 3
girls
k age
0 K0 4
1 K0 5
2 K3 6
# 使用suffixes解决overlapping的问题
# age重复了,可通过suffixes设置,以此保证不重复,不同名
pd.merge(boys,girls,on='k',suffixes=['_boy','_girl'],how='inner')
k age_boy age_girl
0 K0 1 4
1 K0 1 5
8.Pandas plot出图
import pandas as pd
import numpy as np
import matplotlib.pyplot as plt
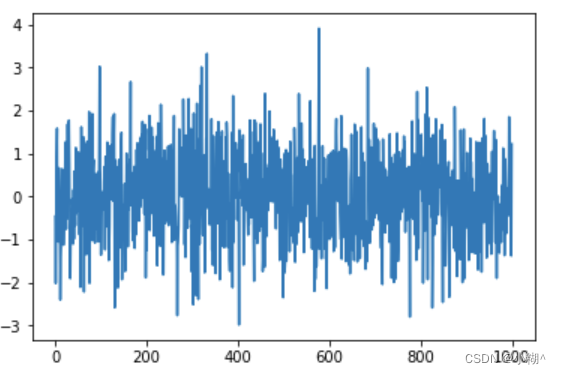
data = pd.Series(np.random.randn(1000), index=np.arange(1000))
print(data)
0 -0.461117
1 -2.019119
2 -0.251923
3 0.931013
4 1.583553
5 -0.927663
6 -0.362239
7 -1.052629
8 0.662661
9 -0.724862
10 -0.853286
11 -2.402047
12 -1.419982
13 -1.078347
14 0.041732
15 0.640257
16 -0.137735
17 -0.325901
18 -1.127756
19 -0.764165
20 -0.319490
21 0.203766
22 1.262629
23 -0.309204
24 -0.758442
25 0.246270
26 -0.513875
27 1.678369
28 0.005369
29 1.632477
…
970 -1.267151
971 -1.271673
972 -1.311423
973 -0.269347
974 -0.455573
975 -0.164193
976 -1.063824
977 0.255307
978 -0.740675
979 -0.772340
980 1.122225
981 -0.249794
982 0.746799
983 -1.370446
984 -0.420165
985 0.870373
986 0.280082
987 -0.858651
988 0.199332
989 -0.172466
990 -0.456013
991 -0.128147
992 -0.068127
993 1.849299
994 0.783293
995 1.200140
996 0.873499
997 -0.721079
998 -1.378469
999 1.220762
Length: 1000, dtype: float64
print(data.cumsum())
# data本来就是一个数据,所以我们可以直接plot
data.plot()
plt.show()
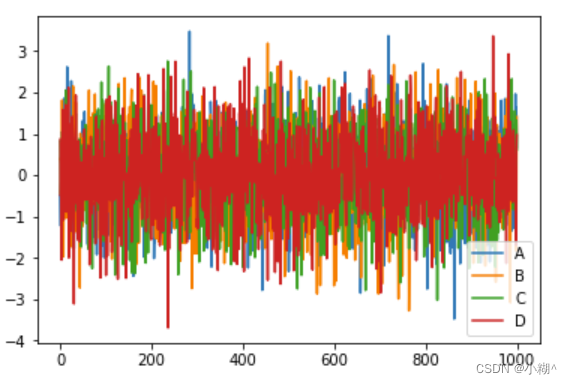
# np.random.randn(1000,4) 随机生成1000行4列数据
# list("ABCD")会变为['A','B','C','D']
data = pd.DataFrame(
    np.random.randn(1000,4),
    index=np.arange(1000),
    columns=list("ABCD")
)
data.cumsum()
data.plot()
plt.show()
ax = data.plot.scatter(x='A',y='B',color='DarkBlue',label='Class1')
# 将之下这个 data 画在上一个 ax 上面
data.plot.scatter(x='A',y='C',color='LightGreen',label='Class2',ax=ax)
plt.show()
索引对齐
rng = np.random.RandomState(42)
ser = pd.Series(rng.randint(0, 10, 4))
ser
df = pd.DataFrame(rng.randint(0, 10, (3, 4)),
columns=['A', 'B', 'C', 'D'])
df
# 以自然常数e为底的指数函数
np.exp(ser)
np.sin(df * np.pi / 4)
当在两个 Series 或 DataFrame 对象上进行二元计算时,Pandas 会在 计算过程中对齐两个对象的索引 对于缺失位置的数据,Pandas 会用 NaN 填充,表示“此处无数”。
#美国州面积
area = pd.Series({'Alaska': 1723337, 'Texas': 695662,
'California': 423967}, name='area')
#美国人口
population = pd.Series({'California': 38332521, 'Texas': 26448193,
'New York': 19651127}, name='population')
#
population / area

a = pd.Series([2, 4, 6], index=[0, 1, 2])
b = pd.Series([1, 3, 5], index=[1, 2, 3])
#a+b
a.add(b, fill_value=0)
rng = np.random.RandomState(0)
a = pd.DataFrame(rng.randint(0, 20, (2, 2)),
columns=list('ab'))
a
b = pd.DataFrame(rng.randint(0, 10, (3, 3)),
columns=list('bac'))
b
a+b
DataFrame 和 Series 的运算规则,与NumPy 中二维数组与一维数组的运算规则是一样
a = rng.randint(10, size=(3, 4))
a
a-a[0]
rng = np.random.RandomState(42)
ser = pd.Series(rng.rand(5))
ser
ser.sum()
ser.mean()
df = pd.DataFrame({'A': rng.rand(5),
'B': rng.rand(5)})
df
count()数量
first()、last() 第一项与最后一项
mean()、median() 均值与中位数
min()、max() 最小值与最大值
std()、var() 标准差与方差
mad() 均值绝对偏差(mean absolute deviation)
prod() 所有项乘积
sum() 所有项求和
df.mean()
df.mean(axis=1)
df = pd.DataFrame({'key': ['A', 'B', 'C', 'A', 'B', 'C'],
'data': range(6)}, columns=['key', 'data'])
df
"""
返回值不是一个 DataFrame 对象,而是一个 DataFrameGroupBy 对象。
“延迟计算”(lazy evaluation)
"""
df2=df.groupby('key')
df2
df2.sum()
rng = np.random.RandomState(0)
df = pd.DataFrame({'key': ['A', 'B', 'C', 'A', 'B', 'C'],
'data1': range(6),
'data2': rng.randint(0, 10, 6)},
columns = ['key', 'data1', 'data2'])
df
aggregate() 可以支持更复杂的操作,比如字符串、函数或者函数列表,并且能一次性计算所
有累计值
df2=df.groupby("key")
df2
df2.min()
df2.aggregate(['min', np.median, max])
df.groupby('key').aggregate({'data1': 'min','data2': 'max'})
# 过滤函数 返回True,保留数据,返回False过滤掉数据
def filter_func(x):
    return x['data2'].max() < 7
def filter_func2(x):
    return True
df.groupby('key').filter(filter_func2)
转换操作会返回一个新的全量数据。数据经过转换之后,其形状与原来的输入数据是一样的
df.groupby('key').transform(lambda x: x - x.mean())
df.groupby('key').transform(lambda x: x - x.mean())


 947
947


 被折叠的 条评论
为什么被折叠?
被折叠的 条评论
为什么被折叠?
 到【灌水乐园】发言


