


一、prometues部署
下载安装
- prometues官网:https://prometheus.io/download/
wget https://github.com/prometheus/prometheus/releases/download/v2.28.0/prometheus-2.28.0.linux-amd64.tar.gz
tar xf /usr/local/prometheus-2.28.0.linux-amd64/ -C /usr/local/
mv /usr/local/prometheus-2.28.0.linux-amd64.tar.gz/ /usr/local/prometheus

启动:
   cd /usr/local/prometheus/
   ./prometheus
   ./prometheus &    #放后台启动
prometues配置启动脚本
cat >> /usr/lib/systemd/system/prometheus.service <<EOF
[Service]
ExecStart=/usr/local/prometheus/prometheus --config.file=/usr/local/prometheus/prometheus.yml

[Install]
WantedBy=multi-user.target

[Unit]
Description=prometheus
EOF


## 启动
systemctl start  prometheus.service
systemctl enable prometheus.service

访问:
    http://ip:9090
常用语法:
| 名称 | 描述 | 示例 |
|---|---|---|
| label_values(label) | 返回Promthues所有监控指标中,标签名为label的所有可选值 | label_values(rainbow_color_stone_errorinfo{}, cmd) label_values(rainbow_color_stone_errorinfo{cmd=~"${cmd}"}, instance) |
使用 :
sum(rainbow_color_stone_errorinfo{RESULT="0",instance=~"${instance}",cmd=~"${cmd}"})
| 名称 | 描述 | 示例 |
|---|---|---|
| count() | 找出当前或者历史数据中某个key的数值大于或小于某个值的统计 | count(node_netstat_Tcp_CurrEstab >50) |
| irate函数 | irate(v range-vector)计算范围向量中时间序列的每秒即时增长率。这基于最后两个数据点。单调性中断 | (例如由于目标重启而导致的计数器重置)会自动调整 irate(http_requests_total{job=“linux-01”}[5m]) |
| sum |
|---|
| sum(…) by(instance) (increase()) 以instance分组然后相加by(instance) |
| sum(…) without(instance) 去除instance,以剩下的标签分组然后相加 |
| increase(…[1m]) 一分钟内的值 |
| rate(…[1m]) 一分钟内的值除以60秒,如果是2m, 就除以120 |
| topk(3,…) 取最大的3个值 |
| ceil 对数值四舍五入 |
| delta 计算一个范围向量v的第一个元素和最后一个元素之间的差值, delta(cpu_temp_celsius{host=“zeus”}[2h]), 过去两小时的差值,前一个值减去最后一个值 |
二、prometues的插件安装与使用
插件下载
插件官网:https://prometheus.io/download/
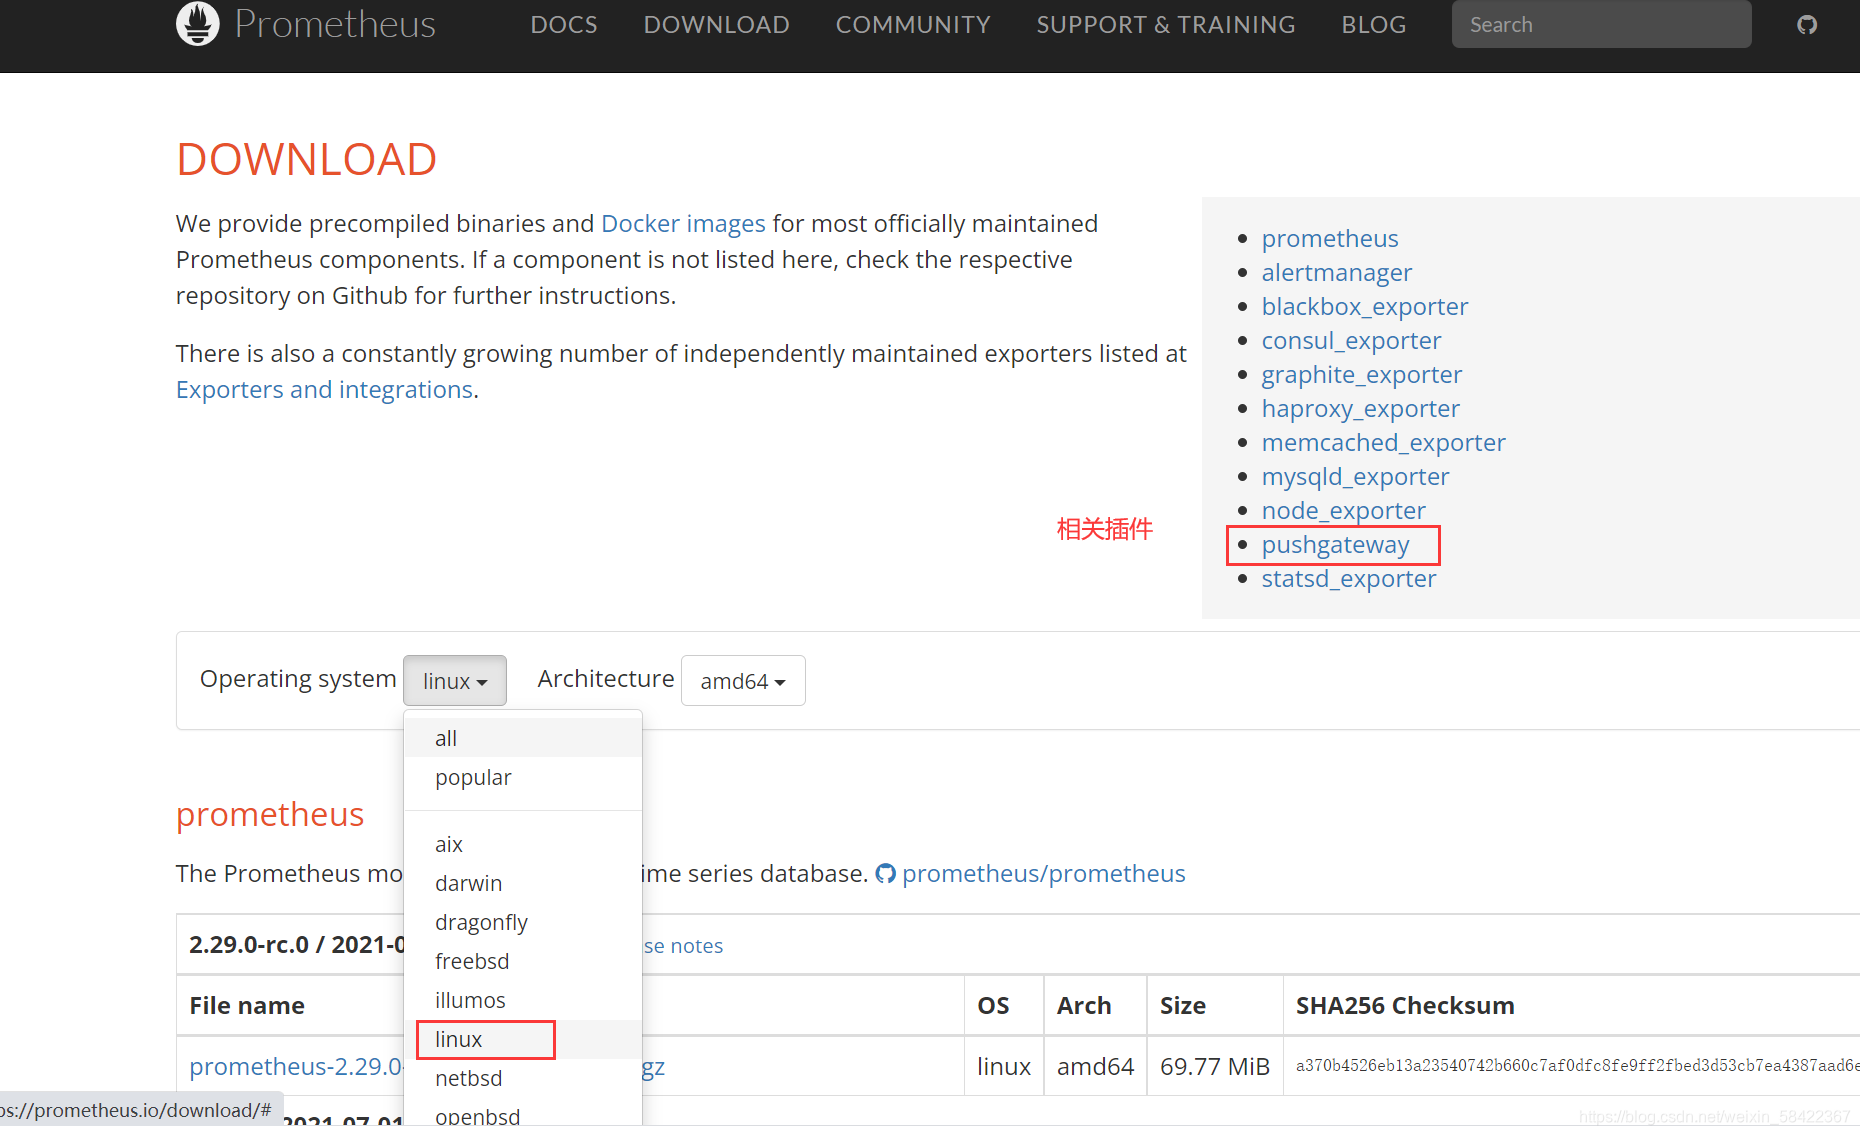
1. prometues的插件之pushgateway
pushgateway主要用于采集自定义信息
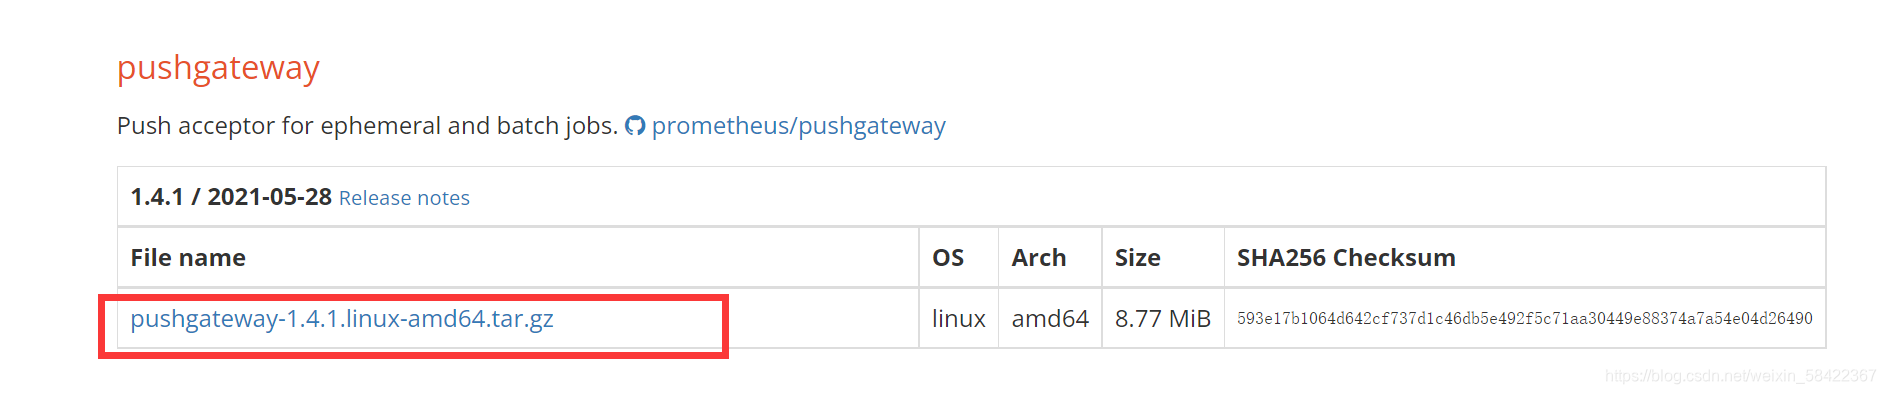
1.1 下载安装
wget https://github.com/prometheus/pushgateway/releases/download/v1.4.1/pushgateway-1.4.1.linux-amd64.tar.gz
tar xf pushgateway-1.4.1.linux-amd64.tar.gz -C /usr/local/
mv /usr/local/pushgateway-1.4.1.linux-amd64/ /usr/local/pushgateway/
1.2 pushgateway设置启动脚本
cat >> /usr/lib/systemd/system/pushgateway.service <<EOF
[Service]
ExecStart=/usr/local/pushgateway/pushgateway

[Install]
WantedBy=multi-user.target

[Unit]
Description=pushgateway
EOF


启动:
systemctl start pushgateway.service
systemctl enable pushgateway.service
1.3 配置和使用
将以下信息添加到Prometheus的配置文件中(主节点IP为ech0的IP,其他集群可以填公网IP)
[root@VM-7-201-centos ~]# vim /usr/local/prometheus/prometheus.yml

  - job_name: 'pushgateway'
    honor_labels: true
    static_configs:
    - targets:
      - ${ip}:9091
      - ${ip}:9091
      labels:
        instance: pushgateway

重启:
systemctl restart prometheus.service

访问:
>1. 浏览器:http://${ip}:9091/metrics  (公网IP)
>2. 本地:curl http://${ip}:9091/metrics  (内网IP)
在集群中推送 和 访问都是公网IP,但在主metrics监控自己的时候,推送也是内网IP的9091端
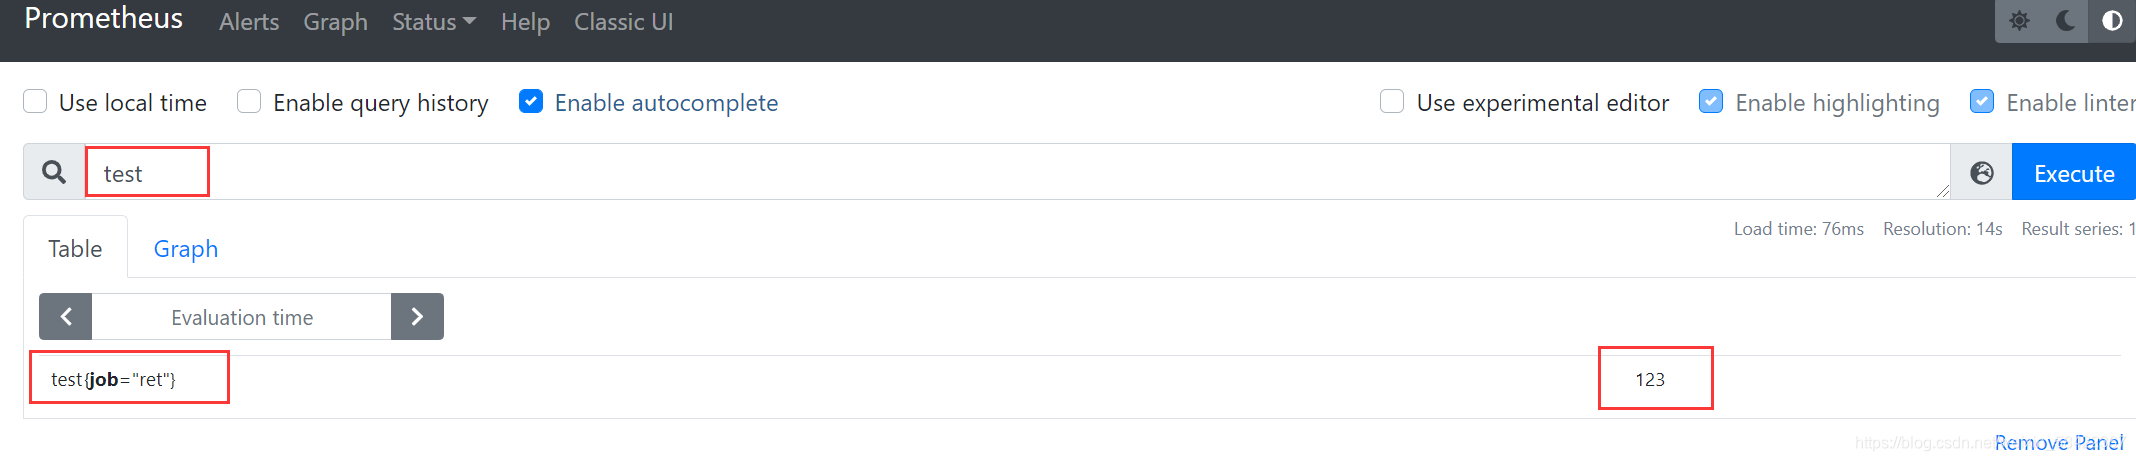
使用方法:
# 采集的信息发生到pushgateway,通过Prometheus搜索rainbow_color_stone_errorinfo1可看到发送的指数
echo "rainbow_color_stone_errorinfo1 123" |curl --data-binary @- http://${server_IP}:9091/metrics/job/ret

# 删除指标
curl -X DELETE http://${server_IP}:9091/metrics/job/ret
1.4 示例
在本机推送是推送到内网IP的9091端

在prometues的web查看
2. node_exporter
下载
wget https://github.com/prometheus/node_exporter/releases/download/v1.2.0/node_exporter-1.2.0.linux-amd64.tar.gz
tar xf node_exporter-1.2.0.linux-amd64.tar.gz -C /usr/local/
mv /usr/local/node_exporter-1.2.0.linux-amd64 /usr/local/node_exporter
配置启动脚本
vim /lib/systemd/system/node_exporter.service
cat >> /usr/lib/systemd/system/node_exporter.service <<EOF
[Unit]
Description=node_exporter
After=network.service

[Service]
Type=simple
ExecStart=/usr/local/node_exporter/node_exporter
Restart=always
RestartSec=10
PrivateTmp=true

[Install]
WantedBy=multi-user.target
EOF


启动:
systemctl start node_exporter.service
systemctl enable node_exporter.service
添加到prometues
将以下信息添加到Prometheus的配置文件中(主节点IP为ech0的IP,其他集群可以填公网IP)
[root@VM-7-201-centos ~]# vim /usr/local/prometheus/prometheus.yml

    # all node
  - job_name: 'nodes'
    static_configs:
    - targets:
      - ${ip}:9100


重启
systemctl restart promethues.service
访问:
- 浏览器:http://${ip}:9100/metrics (公网IP)
- 本地:curl http://${ip}:9100/metrics (内网IP)
3. prometheus-nginxlog-exporter日志监控
下载
https://github.com/martin-helmich/prometheus-nginxlog-exporter
https://www.martin-helmich.de/en/blog/monitoring-nginx.html
wget https://github.com/martin-helmich/prometheus-nginxlog-exporter/releases/download/v1.9.0/prometheus-nginxlog-exporter_1.9.0_linux_amd64.rpm
rpm -ivh prometheus-nginxlog-exporter_1.9.0_linux_amd64.rpm
配置文件
[root@VM-7-201-centos ~]# cat  /etc/prometheus-nginxlog-exporter.hcl

listen {
  port = 4040
}

enable_experimental = true

namespace "nginx1" {
  source = {
    files = [
      "/data/rail/entry/nginx/logs/access.log"
    ]
  }

  format = "{\"time_local\":\"$time_local\",\"@timestamp\":\"$time_iso8601\",\"server_name\":\"$server_name\",\"server_addr\":\"$server_addr\",\"server_port\":\"$server_port\",\"http_host\":\"$http_host\",\"http_user_agent\":\"$http_user_agent\",\"http_cookie\":\"$http_cookie\",\"http_referer\":\"$http_referer\",\"proxy_add_x_forwarded_for\":\"$proxy_add_x_forwarded_for\",\"remote_addr\":\"$remote_addr\",\"remote_port\":\"$remote_port\",\"tcpinfo_rtt\":$tcpinfo_rtt,\"connection\":\"$connection\",\"connection_requests\":\"$connection_requests\",\"ssl_protocol\":\"$ssl_protocol\",\"ssl_server_name\":\"$ssl_server_name\",\"ssl_session_id\":\"$ssl_session_id\",\"ssl_session_reused\":\"$ssl_session_reused\",\"ssl_cipher\":\"$ssl_cipher\",\"status\":$status,\"request\":\"$request\",\"request_uri\":\"$request_uri\",\"request_time\":\"$request_time\",\"http_content_length\":\"$http_content_length\",\"request_length\":$request_length,\"bytes_sent\":$bytes_sent,\"body_bytes_sent\":$body_bytes_sent,\"upstream_addr\":\"$upstream_addr\",\"upstream_connect_time\":\"$upstream_connect_time\",\"upstream_header_time\":\"$upstream_header_time\",\"upstream_status\":\"$upstream_status\",\"upstream_response_time\":\"$upstream_response_time\",\"upstream_cache_status\":\"$upstream_cache_status\",\"geoip_city_country_code\":\"$geoip_city_country_code\",\"scheme\":\"$scheme\",\"http_x_client_proto\":\"$http_x_client_proto\"}"

  labels {
    app = "dd1-entry"
  }

  relabel "request_uri" {
    from = "request_uri"
  }
}
namespace定义指标名,format是日志格式,如"{“time_local”:"$time_local"}将要取的值用变量引用起来
添加到prometues
将以下信息添加到Prometheus的配置文件中(主节点IP为ech0的IP,其他集群可以填公网IP)
[root@VM-7-201-centos ~]# vim /usr/local/prometheus/prometheus.yml

  - job_name: 'nginxlog'
    static_configs:
    - targets:
      - ${ip}:4040

重启
systemctl restart prometues.service

>访问:
>1. 浏览器:http://${ip}:4040/metrics  (公网IP)
>2. 本地:curl http://${ip}:4040/metrics  (内网IP)
4. process-exporter进程监控
由于我们常用的node_exporter并不能覆盖所有监控项,这里我们使用Process-exporter 对进程进行监控。
下载按装
wget https://github.com/ncabatoff/process-exporter/releases/download/v0.4.0/process-exporter-0.4.0.linux-amd64.tar.gz
tar -xvf  process-exporter-0.4.0.linux-amd64.tar.gz -C /usr/local/
创建配置文件
Process-exporter 可以进程名字匹配进程,获取进程信息。匹配规则由name对应的模板变量决定
- 监控进程名字为nginx 与 grafana的进程状态
vim process-name.yaml

process_names:
  - name: "{{.Matches}}"
    cmdline:
    - 'nginx'

  - name: "{{.Matches}}"
    cmdline:
    - 'grafana'
- 定义全部进程监控
vim conf.yaml

process_names:
  - name: "{{.Comm}}"
    cmdline:
    - '.+'
配置启动脚本
cat >> /usr/lib/systemd/system/process.service <<EOF
[Service]
ExecStart=/usr/local/process-exporter/process-exporter -config.path /usr/local/process-exporter/process-name.yaml

[Install]
WantedBy=multi-user.target

[Unit]
Description=process
EOF


启动:
systemctl start process.service
systemctl enable process.service
添加到prometues
将以下信息添加到Prometheus的配置文件中(主节点IP为ech0的IP,其他集群可以填公网IP)
[root@VM-7-201-centos ~]# vim /usr/local/prometheus/prometheus.yml

  - job_name: 'process-exporter'
    static_configs:
    - targets:
      - ${ip}:9256

重启
systemctl restart prometues.service

>访问:
>1. 浏览器:http://${ip}:9256/metrics  (公网IP)
>2. 本地:curl http://${ip}:9256/metrics  (内网IP)
使用扩充
- 查看所有监控项
curl http://localhost:9256/metrics
- 总进程数
sum(namedprocess_namegroup_states)
- 总僵尸进程数
sum(namedprocess_namegroup_states{state="nginx"})
5. mtail
下载安装
下载地址:https://github.com/google/mtail/releases
mtail是谷歌开发的一款日志收集工具,用于从应用程序日志中提取白盒监视数据以收集在时间序列数据库中。此版本是可执行二进制文件,解压移动至/usr/local/sbin下即可使用
wget https://github.com/google/mtail/releases/download/v3.0.0-rc47/mtail_3.0.0-rc47_Linux_x86_64.tar.gz
tar xf mtail_3.0.0-rc47_Linux_x86_64.tar.gz -C /usr/local/sbin

mtail -version
mtail后台启动:
nohup mtail -port 3903 -logtostderr -progs /root/chuangmi.mtail -logs /home/ubuntu/video_server_for_ai/media_server.log &
使用:
如error_count.mtail
下面这个文件的意思是:error_count变量值统计了日志中包含ERROR字串的行数
counter error_count

/ERROR/ {
  error_count++
}
运行
mtail -logtostderr -progs ~/mtail/prog/error_count.mtail -logs ~/mtail/prog/php.log
-progs参数需要以.mtail结尾,脚本内容为需要从日志中提取的指标
- mtail支持的类型:
mtail中的counter、gauge、histogram三种类型与prometheus类型中描述的作用一致。
counter:
counter 类型的数据是单调递增的指标,即只增不减。如,你可以使用 counter 类型的指标来表示服务的请求数、成功任务数、失败的任务数等。gauge:
gauge类型的数据是指可以任意变化的指标,可增可减。如,可以提取正则匹配到的数据,直接赋值给指标变量返回,或者计算后返回。histogram
histogram(直方图)将数据分段统计,引用prometheus中对histogram的描述:
添加到prometues
[root@VM-7-201-centos ~]# vim /usr/local/prometheus/prometheus.yml

  - job_name: 'phplogmtail'
    static_configs:
    - targets:
      - ${ip}:3903

重启
systemctl restart prometues.service

>访问:
>1. 浏览器:http://${ip}:9256/metrics  (公网IP)
>2. 本地:curl http://${ip}:9256/metrics  (内网IP)
6. blackexporter黑盒监控
下载安装
docker安装方法以及下载地址:
https://github.com/prometheus/blackbox_exporter
二进制安装:
wget https://github.com/prometheus/blackbox_exporter/releases/download/v0.19.0/blackbox_exporter-0.19.0.linux-amd64.tar.gz
tar xf blackbox_exporter-0.19.0.linux-amd64.tar.gz -C /usr/local/
mv /usr/local/blackbox_exporter-0.19.0.linux-amd64 /usr/local/blackbox_exporter
启动命令:
cd /usr/local/blackbox_exporter
./blackbox_exporter &    # 加&放后台执行
配置启动脚本:
vim /lib/systemd/system/blackexporter.service
[Service]
ExecStart=/usr/local/blackbox_exporter/blackbox_exporte --web.listen-address=:9115 --config.file=/usr/local/blackbox_exporter/blackbox.yml

[Install]
WantedBy=multi-user.target

[Unit]
Description=blackexporter
使用
通用占位符定义如下:
<boolean>: 一个布尔值,可以取值true或false
<int>: 一个正整数
<duration>: 匹配正则表达式的持续时间 [0-9]+(ms|[smhdwy])
<filename>: 当前工作目录中的有效路径
<string>: 普通字符串
<secret>:作为秘密的常规字符串,例如密码
<regex>: 正则表达式
其他占位符是单独指定的。
模块
  #进行探测的协议(http、tcp、dns、icmp)。
  prober : <prober_string>

  #探针在放弃之前将等待多长时间。
  [ timeout : <duration> ]

  #特定的探针配置 - 最多应指定其中之一。
  [ http : <http_probe> ]
  [ tcp : <tcp_probe> ]
  [ dns : <dns_probe> ]
  [ icmp : <icmp_probe> ]
配置文件
vim /usr/local/prometheus/prometheus.yml
# 网站监控
  - job_name: 'http_status'
    metrics_path: /probe
    params:
      module: [http_2xx]
    static_configs:
      - targets: ['http://xxx.com', 'xxx.com']
        labels:
          instance: http_status
          group: web
    relabel_configs:
      - source_labels: [__address__]
        target_label: __param_target
      - target_label: __address__
        replacement: ip:9115

# ping 检测
  - job_name: 'ping_status'
    metrics_path: /probe
    params:
      module: [icmp]
    static_configs:
      - targets: ['ip']
        labels:
          instance: 'ping_status'
          group: 'icmp'
    relabel_configs:
      - source_labels: [__address__]
        target_label: __param_target
      - target_label: __address__
        replacement: ip:9115

# 端口监控
  - job_name: 'port_status'
    metrics_path: /probe
    params:
      module: [tcp_connect]
    static_configs:
      - targets: ['ip:80', 'ip:9000', 'ip:8080']
        labels:
          instance: 'port_status'
          group: 'port'
    relabel_configs:
      - source_labels: [__address__]
        target_label: __param_target
      - target_label: __address__
        replacement: ip:9115
其他参考:https://blog.frognew.com/2018/02/prometheus-blackbox-exporter.html


 101
101

 被折叠的 条评论
为什么被折叠?
被折叠的 条评论
为什么被折叠?
 到【灌水乐园】发言


