R语言实现地理探测器详细教程及结果解读(一)——EXCEL离散数据![]() http://mp.weixin.qq.com/s?__biz=MzU5MDI4MDkwOQ==&mid=2247483835&idx=1&sn=6edad662789e2d39929b4254b6763d38&chksm=fdc1e019cab6690f08ec993531ca707d76a76ba3fc2971b82c45b2d68bc1f7813be006960d7c&scene=21#wechat_redirect上一篇介绍了用R语言使用EXCEL离散数据进行地理探测器分析的方法,本篇主要介绍使用栅格数据进行地理探测器分析。
http://mp.weixin.qq.com/s?__biz=MzU5MDI4MDkwOQ==&mid=2247483835&idx=1&sn=6edad662789e2d39929b4254b6763d38&chksm=fdc1e019cab6690f08ec993531ca707d76a76ba3fc2971b82c45b2d68bc1f7813be006960d7c&scene=21#wechat_redirect上一篇介绍了用R语言使用EXCEL离散数据进行地理探测器分析的方法,本篇主要介绍使用栅格数据进行地理探测器分析。
1.GD和raster包的下载和导入
install.packages("GD")##下载GD包install.packages("raster")##下载raster包library(GD)##载入GD包library(raster)##载入raster包
2.数据处理
在R中使用栅格数据进行地理探测器分析时,要求所有栅格数据的行列号必须保持一致,因此需要用研究区进行掩膜/裁剪工作,可以使用ArcGIS、R、python进行。本文使用了ArcGIS,【Spatial Analyst 工具】-【提取分析】-【按掩膜提取】-【右键】-【批处理】建议将所有栅格图像保存在一个文件夹内。
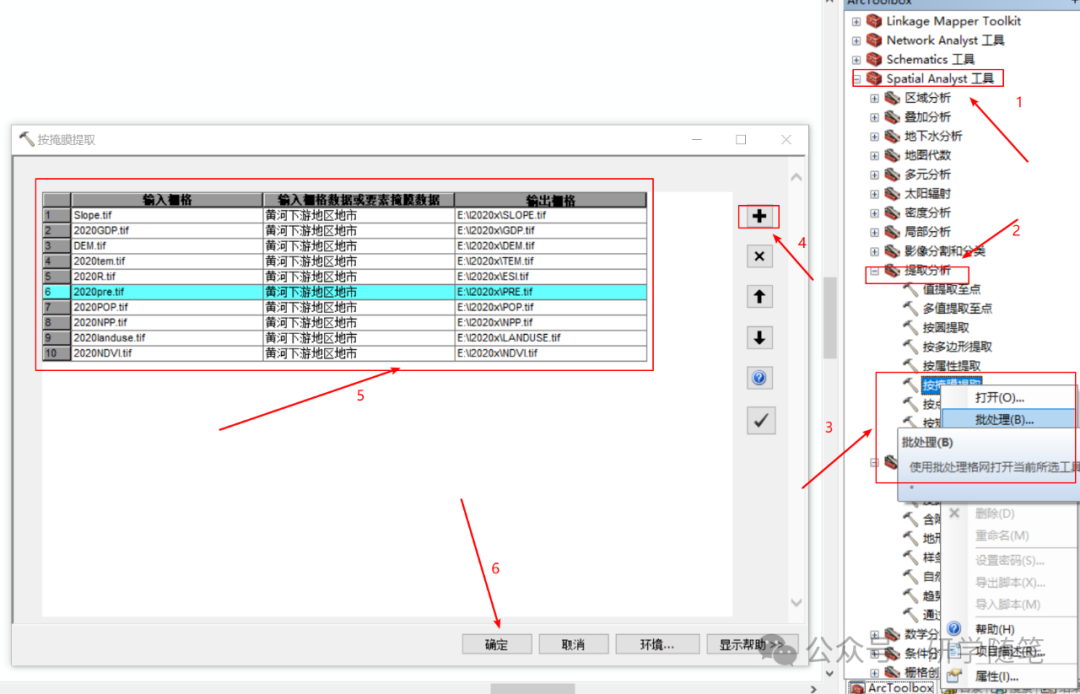
在r中对裁剪之后的图像进行行列号的统一工作。首先选择一张tif图像作为参考图像。
# 定义参考文件路径ref_file <- "E:/l2020x/DEM.tif" #参考影像# 获取所有 .tif 文件的完整路径tif_files <- list.files("E:/l2020x", pattern = "\\.tif$", full.names = TRUE, ignore.case = TRUE)# 读取参考文件ref_raster <- raster(ref_file)ref_extent <- extent(ref_raster)# 创建输出目录output_dir <- "E:/l2020xR"dir.create(output_dir, showWarnings = FALSE)# 定义函数来调整范围并保存文件adjust_extent <- function(file_path, ref_extent, output_dir) {ras <- raster(file_path)ras_adjusted <- projectRaster(ras, ref_raster, method = "ngb") # 使用最近邻法调整# 构造新的文件路径,保存到指定目录下file_name <- tools::file_path_sans_ext(basename(file_path))file_path_new <- file.path(output_dir, paste0(file_name, ".tif"))# 写入新文件writeRaster(ras_adjusted, file_path_new, overwrite = TRUE)}# 对所有 .tif 文件调用函数进行调整,并保存到指定目录lapply(tif_files, adjust_extent, ref_extent, output_dir)
3.栅格图像转换
上一步对栅格图像的行列号进行统一,接下来将栅格图像读取成表格数据,并去除控制。
tif_file_path <- list.files(r"(E:/l2020xR)", pattern = ".tif$", full.names = TRUE, ignore.case = TRUE)tif_file_pathtif_file_all <- stack(tif_file_path)tif_file_allplot(tif_file_all)tif_file_all_matrix <- getValues(tif_file_all)tif_matrix = na.omit(tif_file_all_matrix)# 去除空值View(tif_matrix)head(tif_matrix)[1:3,]
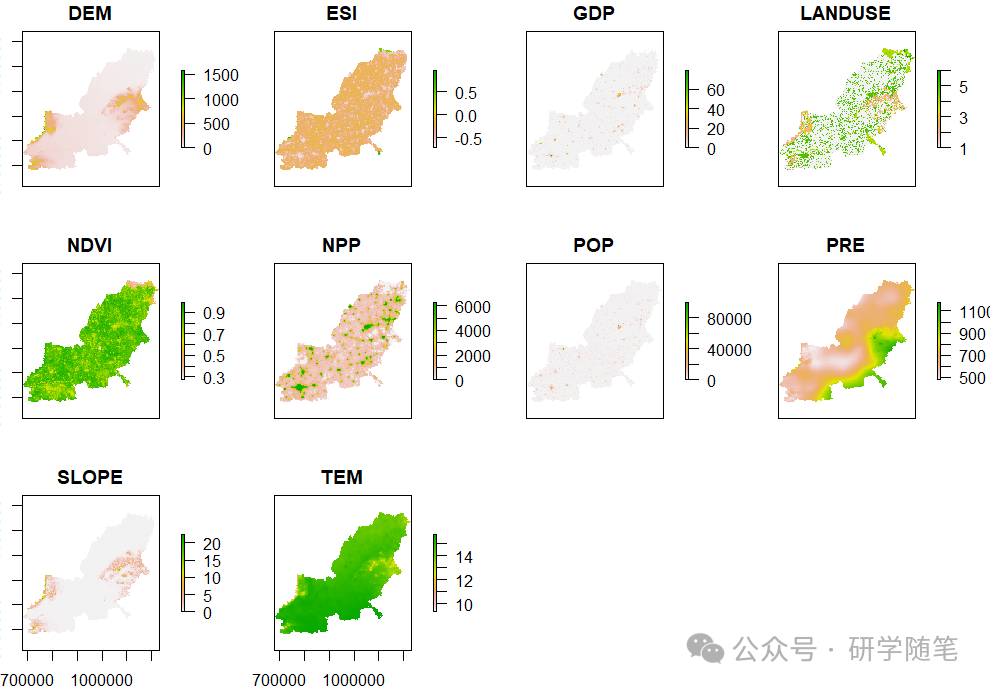
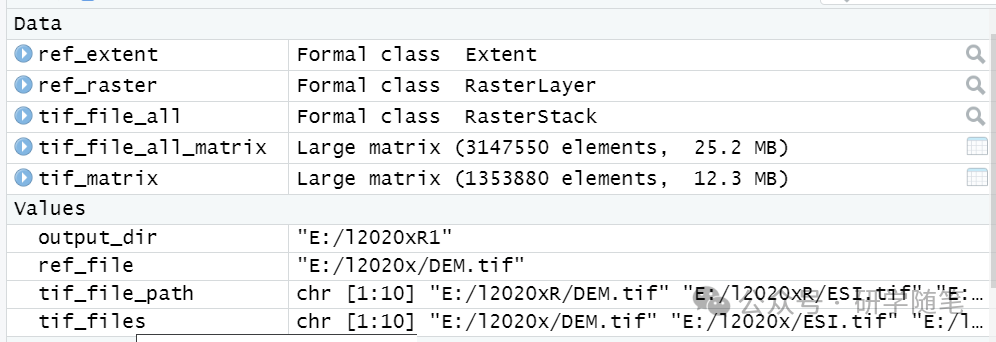
4.地理探测器分析
discmethod <-c("equal","natural","quantile","geometric","sd")##离散化方式选择为这5种方法discitv <-c(4:6)##分成5~10类,毕竟我们要看那种q值最大datagdm <- gdm(ESI ~ DEM + GDP + LANDUSE + NDVI + NPP + POP + SLOPE + TEM + PRE,##第一个放为我们的因变量Y,其他的就是我们的自变量continuous_variable =c("DEM", "GDP","NDVI","NPP","POP","SLOPE","TEM","PRE"),##这里把我们的连续变量输入在这里,类型变量就不输入data = tif_matrix,discmethod = discmethod,discitv= discitv)datagdmplot(datagdm)
5.完成代码
install.packages("GD")##下载GD包install.packages("raster")##下载raster包library(GD)##载入GD包library(raster)##载入raster包# 定义参考文件路径ref_file <- "E:/l2020x/DEM.tif" #这是参考影像!!!!!# 获取所有 .tif 文件的完整路径tif_files <- list.files("E:/l2020x", pattern = "\\.tif$", full.names = TRUE, ignore.case = TRUE)# 读取参考文件ref_raster <- raster(ref_file)ref_extent <- extent(ref_raster)# 创建输出目录output_dir <- "E:/l2020xR"dir.create(output_dir, showWarnings = FALSE)# 定义函数来调整范围并保存文件adjust_extent <- function(file_path, ref_extent, output_dir) {ras <- raster(file_path)ras_adjusted <- projectRaster(ras, ref_raster, method = "ngb") # 使用最近邻法调整# 构造新的文件路径,保存到指定目录下file_name <- tools::file_path_sans_ext(basename(file_path))file_path_new <- file.path(output_dir, paste0(file_name, ".tif"))# 写入新文件writeRaster(ras_adjusted, file_path_new, overwrite = TRUE)}# 对所有 .tif 文件调用函数进行调整,并保存到指定目录lapply(tif_files, adjust_extent, ref_extent, output_dir)tif_file_path <- list.files(r"(E:/l2020xR)", pattern = ".tif$", full.names = TRUE, ignore.case = TRUE)tif_file_pathtif_file_all <- stack(tif_file_path)tif_file_allplot(tif_file_all)tif_file_all_matrix <- getValues(tif_file_all)tif_matrix = na.omit(tif_file_all_matrix)# 去除空值View(tif_matrix)head(tif_matrix)[1:3,]discmethod <-c("equal","natural","quantile","geometric","sd")##离散化方式选择为这5中方法discitv <-c(4:6)##分成5~10类,毕竟我们要看那种q值最大datagdm <- gdm(ESI ~ DEM + GDP + LANDUSE + NDVI + NPP + POP + SLOPE + TEM + PRE,##ESI是因变量Y,其他的就是我们的自变量continuous_variable =c("DEM", "GDP","NDVI","NPP","POP","SLOPE","TEM","PRE"),##这里把我们的连续变量输入在这里,类型变量就不输入data = tif_matrix,discmethod = discmethod,discitv= discitv)datagdmplot(datagdm)
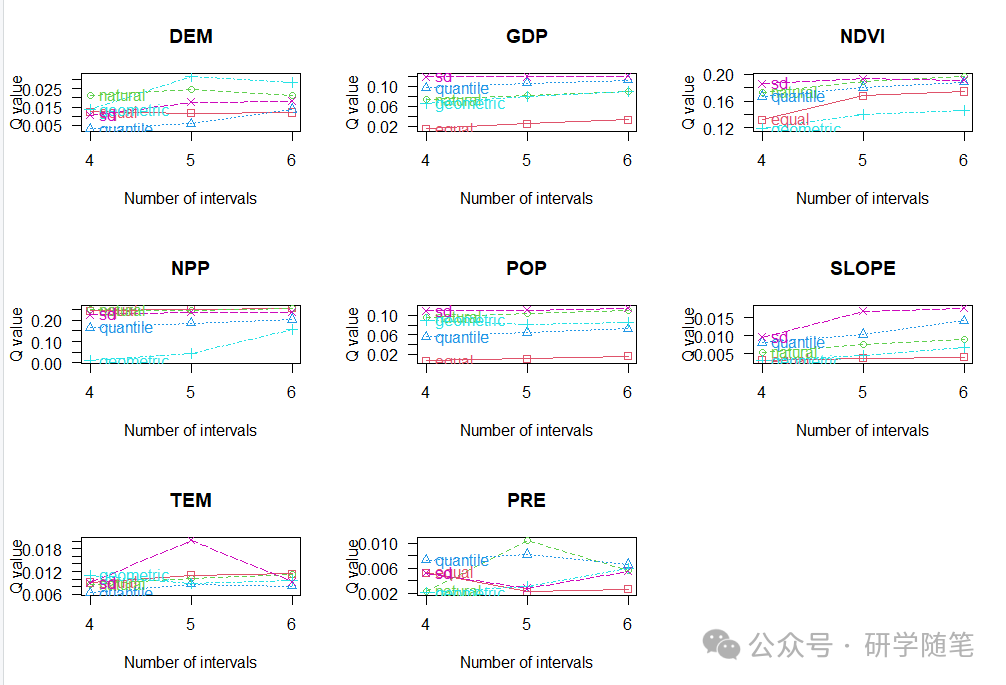
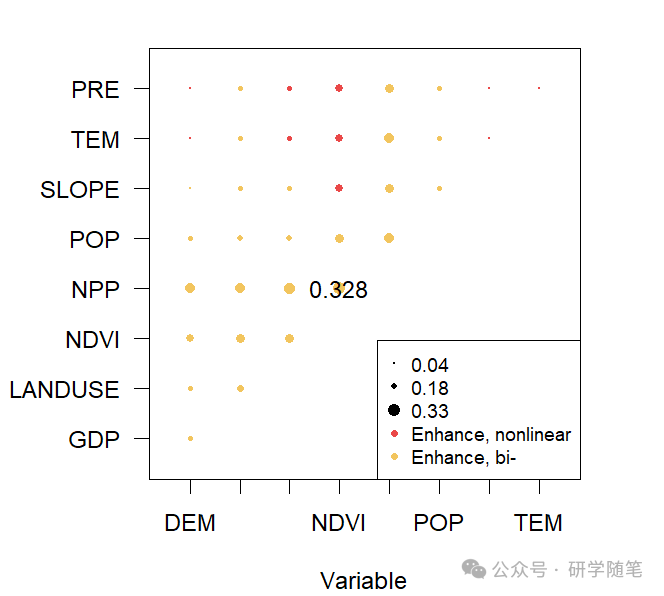
结果解读参考R语言实现地理探测器详细教程及结果解读(一)——EXCEL离散数据


 5139
5139

 被折叠的 条评论
为什么被折叠?


