


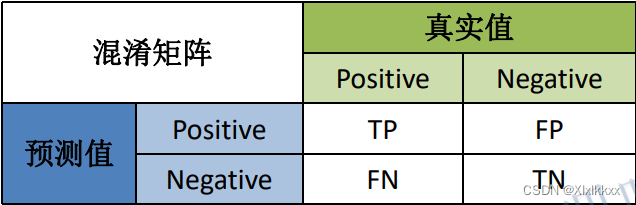
判断是否是猫:
T F 理解为预测对了还是预测错了; P N理解为预测的是猫还是不是猫
准确率(ACC): TP+TN / TP+TN+FP+FN
模型正确分类样本数占总样本数比例(所有类别)
精确率(PPV): TP / TP+FP 分母是预测的猫数量===查准率
模型预测的所有positive中,预测正确的比例
召回率(TPR): TP / TP+FN 分母是真实的猫数量===查全率
所有真实positive中,模型预测正确的positive比例
特异度(TNR): TN / TN+FP 分母是真实的不是猫数量
所有真实negative中,模型预测正确的negative比例
class ConfusionMatrix(object):
    """
    注意,如果显示的图像不全,是matplotlib版本问题
    本例程使用matplotlib-3.2.1(windows and ubuntu)绘制正常
    需要额外安装prettytable库
    """
    def __init__(self, num_classes: int, labels: list):
        self.matrix = np.zeros((num_classes, num_classes))
        self.num_classes = num_classes
        self.labels = labels

    def update(self, preds, labels):
        for p, t in zip(preds, labels):
            self.matrix[p, t] += 1

    def summary(self):
        # calculate accuracy
        sum_TP = 0
        for i in range(self.num_classes):
            sum_TP += self.matrix[i, i]
        acc = sum_TP / np.sum(self.matrix)
        print("the model accuracy is ", acc)

        # precision, recall, specificity
        table = PrettyTable()
        table.field_names = ["", "Precision", "Recall", "Specificity"]
        for i in range(self.num_classes):
            TP = self.matrix[i, i]
            FP = np.sum(self.matrix[i, :]) - TP
            FN = np.sum(self.matrix[:, i]) - TP
            TN = np.sum(self.matrix) - TP - FP - FN
            Precision = round(TP / (TP + FP), 3) if TP + FP != 0 else 0.
            Recall = round(TP / (TP + FN), 3) if TP + FN != 0 else 0.
            Specificity = round(TN / (TN + FP), 3) if TN + FP != 0 else 0.
            table.add_row([self.labels[i], Precision, Recall, Specificity])
        print(table)

    def plot(self):
        matrix = self.matrix
        print(matrix)
        plt.imshow(matrix, cmap=plt.cm.Blues)

        # 设置x轴坐标label
        plt.xticks(range(self.num_classes), self.labels, rotation=45)
        # 设置y轴坐标label
        plt.yticks(range(self.num_classes), self.labels)
        # 显示colorbar
        plt.colorbar()
        plt.xlabel('True Labels')
        plt.ylabel('Predicted Labels')
        plt.title('Confusion matrix')

        # 在图中标注数量/概率信息
        thresh = matrix.max() / 2
        for x in range(self.num_classes):
            for y in range(self.num_classes):
                # 注意这里的matrix[y, x]不是matrix[x, y]
                info = int(matrix[y, x])
                plt.text(x, y, info,
                         verticalalignment='center',
                         horizontalalignment='center',
                         color="white" if info > thresh else "black")
        plt.tight_layout()
        plt.show()
代码使用:
### 分类问题

confusion = ConfusionMatrix(num_classes=args.num_classes, labels=labels)

model.eval()
with torch.no_grad():
    for val_data in tqdm(val_loader, file=sys.stdout):
        val_images, val_labels = val_data     #真实类别
        outputs = model(val_images.to(device))
        outputs = torch.softmax(outputs, dim=1)
        outputs = torch.argmax(outputs, dim=1) # 预测类别
        confusion.update(outputs.to("cpu").numpy(), val_labels.to("cpu").numpy())

confusion.plot()
confusion.summary()


 813
813


 被折叠的 条评论
为什么被折叠?
被折叠的 条评论
为什么被折叠?
 到【灌水乐园】发言


