


这次我们尝试使用第三方库originpro绘图
具体如下
"""此代码用于自动读取文件并绘制晶体结构能带图"""
import originpro as op
import csv
import sys
import os
# Very useful, especially during development, when you are
# liable to have a few uncaught exceptions.
# Ensures that the Origin instance gets shut down properly.
# Note: only applicable to external Python.
def origin_shutdown_exception_hook(exctype, value, traceback):
'''Ensures Origin gets shut down if an uncaught exception'''
op.exit()
sys.__excepthook__(exctype, value, traceback)
if op and op.oext:
sys.excepthook = origin_shutdown_exception_hook
# Set Origin instance visibility.
# Important for only external Python.
# Should not be used with embedded Python.
"""if op.oext:
op.set_show(True)
"""
data = [] # 文件夹下的子文件名
def path_read(file):
for root, dirs, files in os.walk(file):
for file in files:
# 打开文件
ft = os.path.join(root, file)
data.append(ft)
print(ft)
return data
def pc(path_r, cpath, a, b):
if not os.path.exists(cpath):
os.makedirs(cpath)
er = [] # 差值
new_lst = [] # 将数值转换为一维列表
rv = [] # 特定区间值
rvm = [] # 清洗掉空字符串''
rvmp = [] # 导入绘画的值
with open(path_r, 'r') as csvfile:
reader = csv.reader(csvfile)
lx = [row[0] for row in reader] # 这将获取第一列的所有数据
with open(path_r, 'r') as csvfile:
reader = csv.reader(csvfile)
ly = [row[1] for row in reader] # 这将获取第二列的所有数据
n = 0
for i in lx:
new_lst.append([i])
new_lst[n].append(ly[n])
n += 1
for i in new_lst:
if '' not in i:
rvm.append(i)
for i in rvm:
if a < eval(i[1]) < b:
rv.append(i)
ax = []
ay = []
num = 0
for i in range(len(rv)-1):
ax.append(rv[i][0])
ay.append(rv[i][1])
er.append(eval(rv[num+1][1])-eval(rv[num][1])) # 计算两个相邻y值的差
num += 1
ay1 = []
ay2 = []
for i in range(len(rv)-1):
if str(eval(rv[i+1][1])-eval(rv[i][1])) == str(max(er)):
tmaxy = rv[i+1][1]
tminy = rv[i][1]
maxy = min(ay[ay.index(tmaxy):ay.index(tmaxy)+50])
miny = max(i for i in ay[ay.index(tmaxy)-50:ay.index(tmaxy)])
for i in rv:
ay1.append(maxy)
ay2.append(miny)
a, b = rvm.index(rv[0]), rvm.index(rv[-1])
for i in rvm[a:b]:
rvmp.append(i)
x = [i[0] for i in rvmp]
y = [i[1] for i in rvmp]
ay = [i[1] for i in rv]
y1 = ay1
y2 = ay2
# 假设 y 是一个包含可以转换为浮点数的字符串的列表
y_floats = [float(item) for item in ay] # 将字符串转换为浮点数
min_y = min(y_floats) # 找到最小值
# 向下取整到最接近的整数,如果已经是整数则保持不变
min_y_int = int(min_y) if min_y.is_integer() else int(min_y - 1)
# 要稍微低于这个整数值,可以再减去一个数(如0.5)
min_y_adjusted = min_y_int - 0.5
max_y = max(y_floats) # 找到最小值
# 向下取整到最接近的整数,如果已经是整数则保持不变
max_y_int = int(max_y) if max_y.is_integer() else int(max_y - 1)
file_name = path_r.split("/")[-1][:-4].split('\\')[-1]
# 要稍微高于这个整数值,可以再加上一个数(如0.5)
max_y_adjusted = max_y_int + 0.5
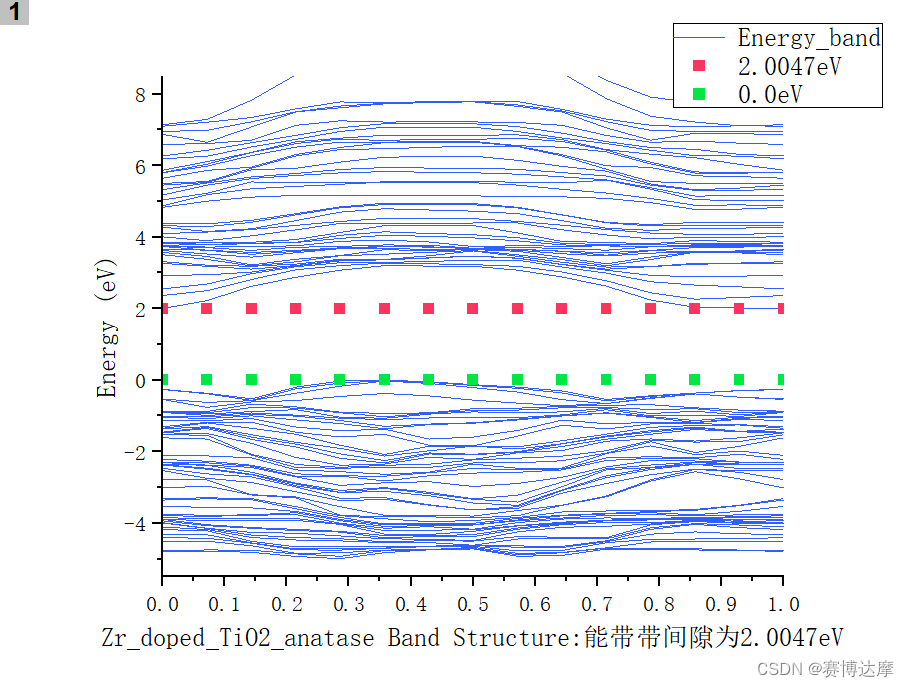
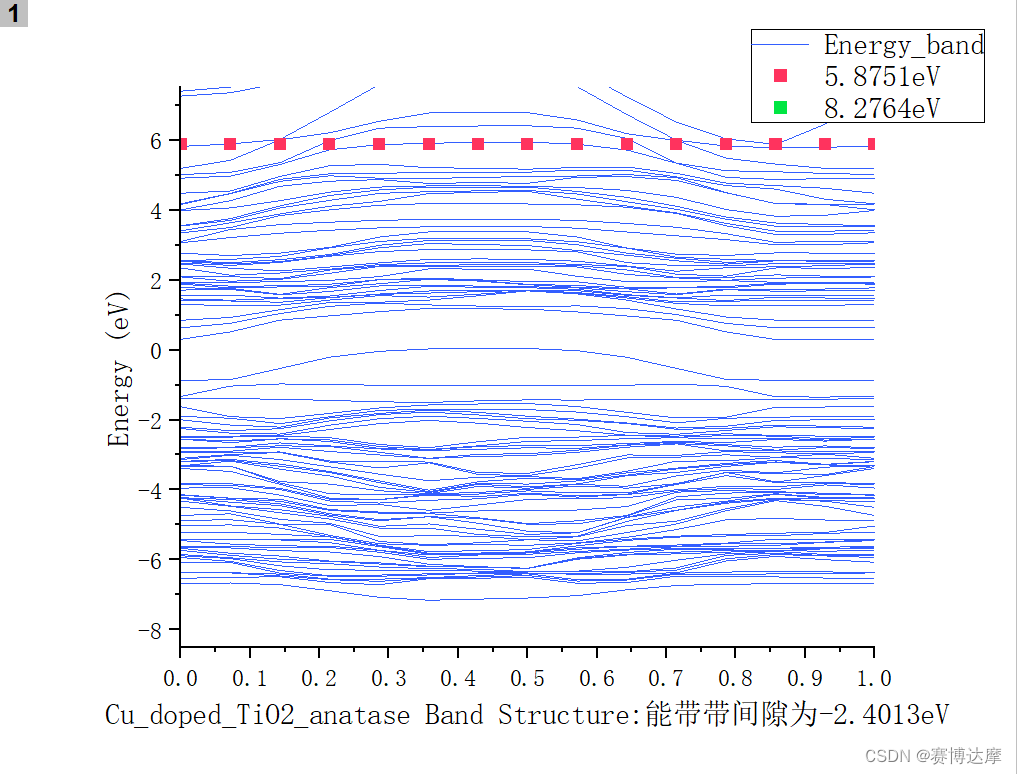
print(f"---绘制csv文件:{file_name}---")
print(f'Energy范围为区间[{min_y_adjusted},{max_y_adjusted}]eV')
print(f'能带间隙是{round(eval(maxy) - eval(miny), 4)}eV\n')
"""开始绘图"""
op.set_show()
wks = op.new_sheet('w')
wks.from_list(0, x, lname=f'{file_name}:能带带间隙为{round(eval(maxy)-eval(miny),4)}eV', units='', comments = "", axis = 'X')
wks.from_list(1, y, lname='Energy', units='(eV)', comments='')
wks.set_label(1, 'Energy_band', 'C')
wks.from_list(2, y1, f'{round(float(maxy), 4)}eV')
wks.from_list(3, y2, f'{round(float(miny), 4)}eV')
gp = op.new_graph()
gl = gp[0]
ax = gl.axis('x')
ax.limits = (0, 1, 0.1)
gl.xlim = (0, 1)
gl.ylim = (min_y_adjusted, max_y_adjusted)
pl = gl.add_plot(wks, 1, 0)
wks.from_list(2, y1)
wks.from_list(3, y2)
pl1 = gl.add_plot(wks, 2, type=201)
pl2 = gl.add_plot(wks, 3, type=201)
pl1.color = "#ff335e" # 设置颜色
pl2.color = "#00e642"
pl.color = "#335eff"
path = op.path('u')
gp.save_fig(path)
gp.save_fig(f'{cpath}/{file_name}.jpg', replace=True, width=2000) # 保存图片的参数
"""if op.oext:
op.exit()""" # 执行完成后退出程序
if __name__ == "__main__":
path = input('输入文件路径:').strip('"')
fl = path.split('\\')
path_r = '/'.join(fl)
a, b = -9, 9
cpath = '/'.join(path_r.split("/")[:-1]) + '/figure band'
path_read(path_r) # 读取文件夹中的子文件名
print(path_r)
for i in data: # 遍历文件夹开始绘图
pc(i, cpath, a, b)
print('运行完毕')这个代码并不完美,有些晶体的能带间隙会出现误判,关于originpro这个库的教程也不多,作者经过一些尝试,仅是设置了x,y轴的范围,和传入列表数据,和简单绘图,关于线条的宽度、类型设置、和添加复杂的标注没有涉及。感兴趣的朋友可参考origin官方网址。


 1957
1957


 被折叠的 条评论
为什么被折叠?
被折叠的 条评论
为什么被折叠?
 到【灌水乐园】发言


