


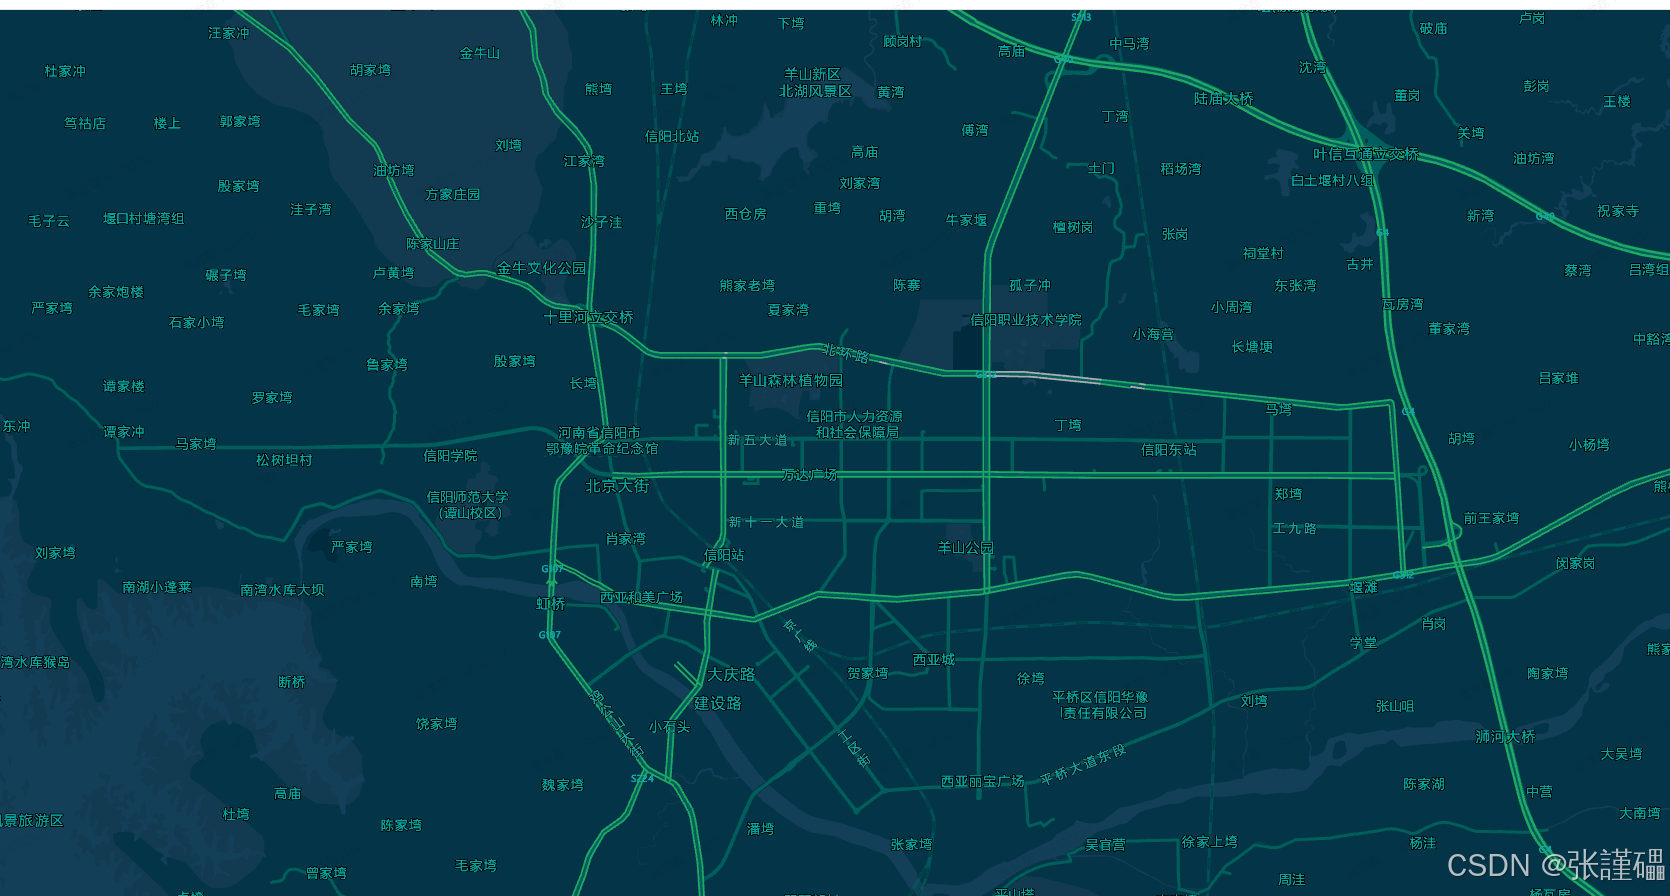
基于高德地图 JavaScript API v2.0 创建的网页,功能是展示地图并实现实时路况图层的显示与隐藏切换
1. HTML 部分
<!doctype html>
<html>
<head>
    <meta charset="utf-8">
    <meta http-equiv="X-UA-Compatible" content="IE=edge">
    <meta name="viewport" content="initial-scale=1.0, user-scalable=no, width=device-width">
    <title>实时路况图层</title>
    <link rel="stylesheet" href="https://a.amap.com/jsapi_demos/static/demo-center/css/demo-center.css"/>
    <style>
        html,
        body,
        #container {
            margin: 0;
            padding: 0;
            width: 100%;
            height: 100%;
        }
    </style>
</head>
<body>
<div id="container"></div>
<div class="input-card" style="width: auto;">
    <div class="input-item">
        <button class="btn" id="btn">显示/隐藏实时路况</button>
    </div>
</div>
<script src="https://webapi.amap.com/maps?v=2.0&key=1e31659e58fa7666fe0d08f4487ec5c2"></script>
<script src="script.js"></script>
</body>
</html>
- 元数据和标题:
meta charset="utf-8"设置字符编码为 UTF - 8。meta http-equiv="X-UA-Compatible" content="IE=edge"确保网页在 IE 浏览器中以最高版本渲染。meta name="viewport" content="initial-scale=1.0, user-scalable=no, width=device-width"设置视口,初始缩放比例为 1.0,禁止用户缩放,宽度等于设备宽度。<title>实时路况图层</title>设置网页标题。
- 样式引入和自定义样式:
- 引入了高德地图官方示例中心的 CSS 样式表
https://a.amap.com/jsapi_demos/static/demo-center/css/demo-center.css。 - 自定义样式设置
html、body和#container的宽度和高度为 100%,并清除内外边距,确保地图能铺满整个页面。
- 引入了高德地图官方示例中心的 CSS 样式表
- 页面结构:
<div id="container"></div>是地图容器,地图将渲染在此处。<div class="input-card">及其内部的<button>创建了一个按钮,用于切换实时路况图层的显示与隐藏。按钮的 ID 为btn,类名为btn,文本为 “显示 / 隐藏实时路况”。
- 脚本引入:
- 引入高德地图 JavaScript API v2.0,
key是用于访问 API 的密钥。 - 引入自定义的 JavaScript 脚本
script.js(假设该脚本包含地图初始化和交互逻辑,在原代码中这部分逻辑直接写在 HTML 中,这里分开只是为了更好的结构说明)。
- 引入高德地图 JavaScript API v2.0,
2. JavaScript 部分(原代码中直接在 HTML 中,这里提取出来分析)
var map = new AMap.Map('container', {
    center: [114.091058,32.148624],
    zoom: 13
});
map.setMapStyle('amap://styles/blue');
//实时路况图层
var trafficLayer = new AMap.TileLayer.Traffic({
    zIndex: 10,
    zooms: [7, 22],
});

trafficLayer.setMap(map);

var isVisible = true;
function toggle() {
    if (isVisible) {
        trafficLayer.hide();
        isVisible = false;
    } else {
        trafficLayer.show();
        isVisible = true;
    }
}

document.getElementById('btn').addEventListener('click', toggle);
- 地图初始化:
- 使用
new AMap.Map('container', {...})创建一个地图实例,将其渲染在 ID 为container的 DOM 元素上。 center属性设置地图的中心坐标为[114.091058, 32.148624]。zoom属性设置地图的初始缩放级别为 13。map.setMapStyle('amap://styles/blue')设置地图的样式为蓝色风格。
- 使用
- 实时路况图层创建:
var trafficLayer = new AMap.TileLayer.Traffic({...})创建一个实时路况图层实例。zIndex属性设置图层的堆叠顺序为 10。zooms属性设置该图层在地图缩放级别 7 到 22 之间可见。trafficLayer.setMap(map)将实时路况图层添加到地图上。
- 显示与隐藏切换逻辑:
- 定义变量
isVisible用于记录实时路况图层的当前可见状态,初始为true。 toggle函数实现了切换实时路况图层显示与隐藏的逻辑。如果isVisible为true,则调用trafficLayer.hide()隐藏图层,并将isVisible设置为false;否则,调用trafficLayer.show()显示图层,并将isVisible设置为true。- 通过
document.getElementById('btn').addEventListener('click', toggle)为按钮添加点击事件监听器,当按钮被点击时,调用toggle函数。
- 定义变量
3.可能的改进点
- 错误处理:在加载高德地图 API 和使用 API 密钥时,应添加错误处理机制,以处理可能的加载失败或密钥无效等问题。
- 样式优化:可以进一步优化按钮的样式,使其在不同屏幕尺寸下有更好的显示效果。
- 代码结构:将 JavaScript 代码分离到单独的文件中,以提高代码的可维护性和复用性,就像上述分析中提到的将 HTML 中的 JavaScript 部分提取到
script.js文件。
完整代码展示:
<!doctype html>
<html>
<head>
    <meta charset="utf-8">
    <meta http-equiv="X-UA-Compatible" content="IE=edge">
    <meta name="viewport" content="initial-scale=1.0, user-scalable=no, width=device-width">
    <title>实时路况图层</title>
    <link rel="stylesheet" href="https://a.amap.com/jsapi_demos/static/demo-center/css/demo-center.css"/>
    <style>
        html,
        body,
        #container {
            margin: 0;
            padding: 0;
            width: 100%;
            height: 100%;
        }
    </style>
</head>
<body>
<div id="container"></div>
<div class="input-card" style="width: auto;">
    <div class="input-item">
        <button class="btn" id="btn">显示/隐藏实时路况</button>
    </div>
</div>
<script src="https://webapi.amap.com/maps?v=2.0&key=1e31659e58fa7666fe0d08f4487ec5c2"></script>
<script>
    var map = new AMap.Map('container', {
        center: [114.091058,32.148624],
        zoom: 13
    });
    map.setMapStyle('amap://styles/blue');
    //实时路况图层
    var trafficLayer = new AMap.TileLayer.Traffic({
        zIndex: 10,
        zooms: [7, 22],
    });

    trafficLayer.setMap(map);

    var isVisible = true;
    function toggle() {
        if (isVisible) {
            trafficLayer.hide();
            isVisible = false;
        } else {
            trafficLayer.show();
            isVisible = true;
        }
    }

  	document.getElementById('btn').addEventListener('click', toggle);
</script>
</body>
</html>
截图:
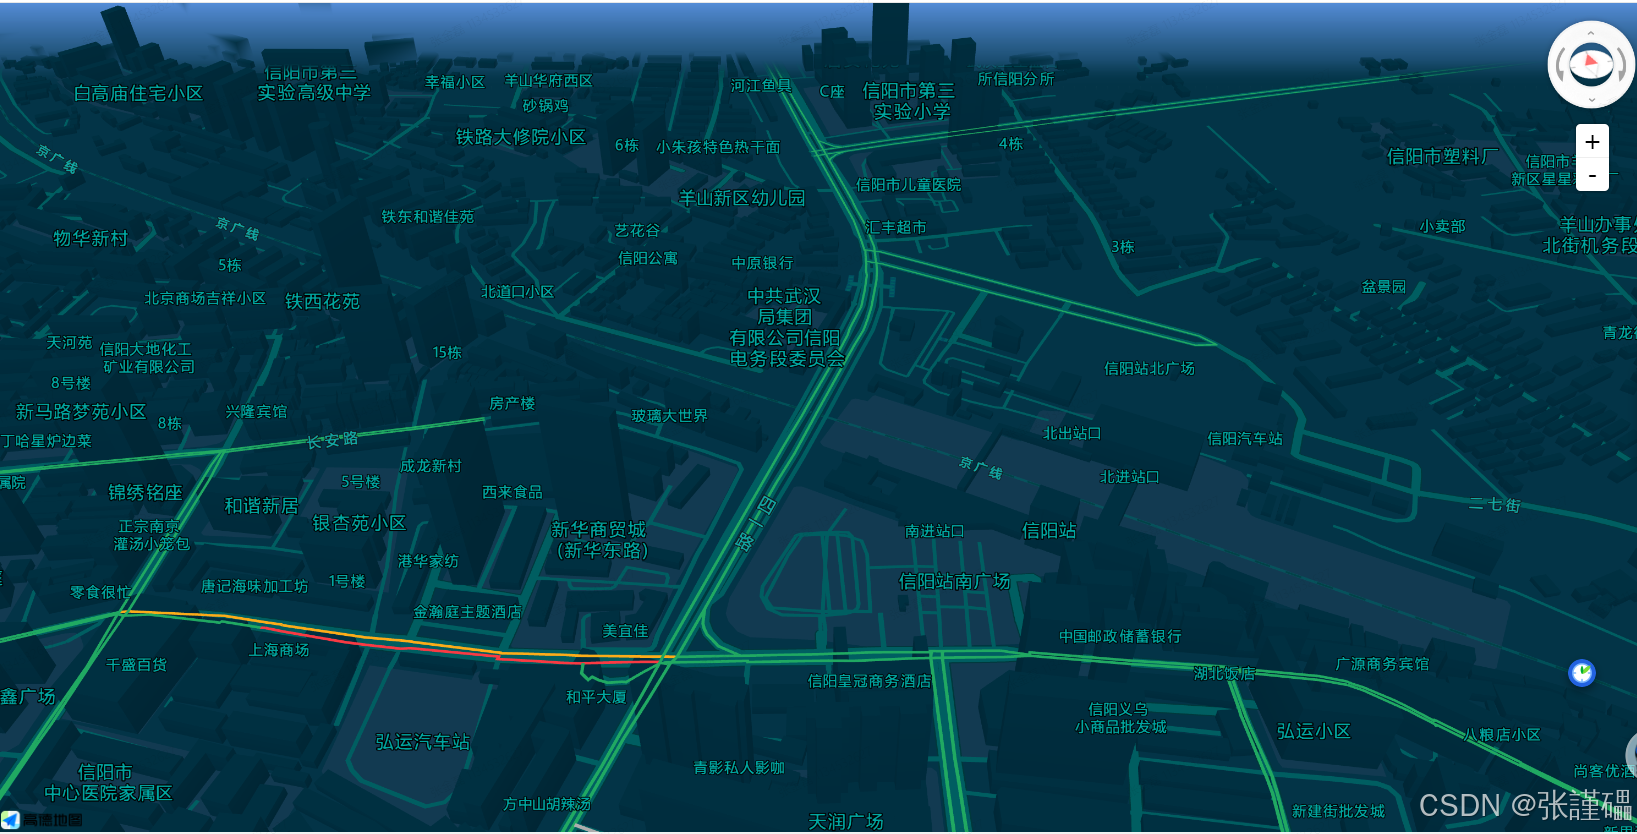
4.3D可视化交通展示
1. HTML 结构
<!DOCTYPE HTML>
<html>
<head>
    <meta name="viewport" content="width=device-width initial-scale=1.0 maximum-scale=1.0 user-scalable=0">
    <meta http-equiv="Content-Type" content="text/html; charset=utf-8">
    <title>3D地图</title>
    <style>
        body,html{ margin:0;padding:0;font:12px/16px Verdana,Helvetica,Arial,sans-serif;width: 100%;height: 100%}
       .container{
            height: 100%
        }
    </style>
    <script language="javascript" src="//webapi.amap.com/maps?v=2.0&key=1e31659e58fa7666fe0d08f4487ec5c2&plugin=AMap.ControlBar,AMap.ToolBar"></script>
</head>
<body >
    <div id="container" style="width:100%; height:100%;resize:both;"></div>
    <script language="javascript">
        // 代码主体
    </script>
</body>
</html>
- 文档类型声明:
<!DOCTYPE HTML>声明文档类型为 HTML5。 - 元数据:
meta name="viewport"设置了页面的视口,确保页面在移动设备上正确显示,禁止用户缩放。meta http-equiv="Content-Type"设置页面的字符编码为 UTF - 8。
- 标题:
<title>3D地图</title>设置页面标题为 “3D 地图”。 - 样式:设置了
html和body元素的默认样式,使其占据整个视口,并为.container类设置了高度为 100%。 - 脚本引入:通过
<script>标签引入高德地图 Web API,指定版本为 2.0,并提供了 API 密钥1e31659e58fa7666fe0d08f4487ec5c2,同时加载了ControlBar和ToolBar插件。 - 地图容器:在
<body>中创建了一个div元素,id为container,用于承载地图,设置其宽度和高度为 100%,并允许用户调整大小。
2. JavaScript 代码
var map;
function mapInit(){
    map = new AMap.Map('container', {
        rotateEnable:true,
        pitchEnable:true,
        zoom: 17,
        pitch: 50,
        rotation: -15,
        viewMode:'3D', //开启3D视图,默认为关闭
        zooms:[2,20],
        center:[114.081428,32.130259]
    });

    var controlBar = new AMap.ControlBar({
        position:{
            right:'10px',
            top:'10px'
        }
    });
    controlBar.addTo(map);

    var toolBar = new AMap.ToolBar({
        position:{
            right:'40px',
            top:'110px'
        }
    });
    toolBar.addTo(map);

    map.setMapStyle('amap://styles/blue');
    //实时路况图层
    var trafficLayer = new AMap.TileLayer.Traffic({
        zIndex: 10,
        zooms: [7, 22],
    });

    trafficLayer.setMap(map);
}
mapInit()
- 全局变量:声明了一个全局变量
map,用于存储地图实例。 mapInit函数:- 创建地图实例:使用
new AMap.Map创建地图实例,指定地图容器为id为container的元素,并设置了一系列地图属性,包括旋转、俯仰、缩放级别、视角倾斜度、旋转角度、视图模式、缩放范围以及地图中心坐标。 - 添加控制栏:创建
ControlBar实例并添加到地图上,设置其位置在右上角。 - 添加工具栏:创建
ToolBar实例并添加到地图上,设置其位置在右上角稍下方。 - 设置地图样式:使用
map.setMapStyle方法将地图样式设置为蓝色主题。 - 添加实时路况图层:创建
TileLayer.Traffic实例,设置其层级和可见缩放范围,并将其添加到地图上。
- 创建地图实例:使用
- 调用函数:最后调用
mapInit函数来初始化地图
完整代码:
<!DOCTYPE HTML>
<html>
<head>
<meta name="viewport" content="width=device-width initial-scale=1.0 maximum-scale=1.0 user-scalable=0">
<meta http-equiv="Content-Type" content="text/html; charset=utf-8">
<title>3D地图</title>
<style>
body,html{ margin:0;padding:0;font:12px/16px Verdana,Helvetica,Arial,sans-serif;width: 100%;height: 100%}
.container{
  height: 100%
}
</style>
<script language="javascript" src="//webapi.amap.com/maps?v=2.0&key=1e31659e58fa7666fe0d08f4487ec5c2&plugin=AMap.ControlBar,AMap.ToolBar"></script>
</head>
<body >
<div id="container" style="width:100%; height:100%;resize:both;"></div>
<script language="javascript">
var map;
function mapInit(){
  map = new AMap.Map('container', {
    rotateEnable:true,
    pitchEnable:true,
    zoom: 17,
    pitch: 50,
    rotation: -15,
    viewMode:'3D', //开启3D视图,默认为关闭
    zooms:[2,20],
    center:[114.081428,32.130259]
  });

  var controlBar = new AMap.ControlBar({
    position:{
      right:'10px',
      top:'10px'
    }
  });
  controlBar.addTo(map);

  var toolBar = new AMap.ToolBar({
    position:{
      right:'40px',
      top:'110px'
    }
  });
  toolBar.addTo(map);

   map.setMapStyle('amap://styles/blue');
    //实时路况图层
    var trafficLayer = new AMap.TileLayer.Traffic({
        zIndex: 10,
        zooms: [7, 22],
    });

    trafficLayer.setMap(map);
}
mapInit()
</script>
</body>
</html>


<template>
  <div id="container" class="map-container"></div>
</template>

<script>
export default {
  data() {
    return {
      map: null
    };
  },
  mounted() {
    this.mapInit();
  },
  methods: {
    mapInit() {
      // 引入高德地图API脚本
      const script = document.createElement('script');
      script.src = `//webapi.amap.com/maps?v=2.0&key=1e31659e58fa7666fe0d08f4487ec5c2&plugin=AMap.ControlBar,AMap.ToolBar`;
      script.async = true;
      script.onload = () => {
        this.initMap();
      };
      document.head.appendChild(script);
    },
    initMap() {
      this.map = new AMap.Map('container', {
        rotateEnable: true,
        pitchEnable: true,
        zoom: 17,
        pitch: 50,
        rotation: -15,
        viewMode: '3D',
        zooms: [2, 20],
        center: [114.081428, 32.130259]
      });

      const controlBar = new AMap.ControlBar({
        position: {
          right: '10px',
          top: '10px'
        }
      });
      controlBar.addTo(this.map);

      const toolBar = new AMap.ToolBar({
        position: {
          right: '40px',
          top: '110px'
        }
      });
      toolBar.addTo(this.map);

      this.map.setMapStyle('amap://styles/blue');

      const trafficLayer = new AMap.TileLayer.Traffic({
        zIndex: 10,
        zooms: [7, 22]
      });
      trafficLayer.setMap(this.map);
    }
  }
};
</script>

<style scoped>
.map-container {
  width: 100%;
  height: 100vh;
}
</style>
截图展示:


 6767
6767

 被折叠的 条评论
为什么被折叠?
被折叠的 条评论
为什么被折叠?
 到【灌水乐园】发言


