


项目里面有个需求,要求传入一堆坐标点,返回一张折线图(特别要求了不让使用echarts,就只返回一个折线图),因此为了项目需要做了下面的组件
第一个版本
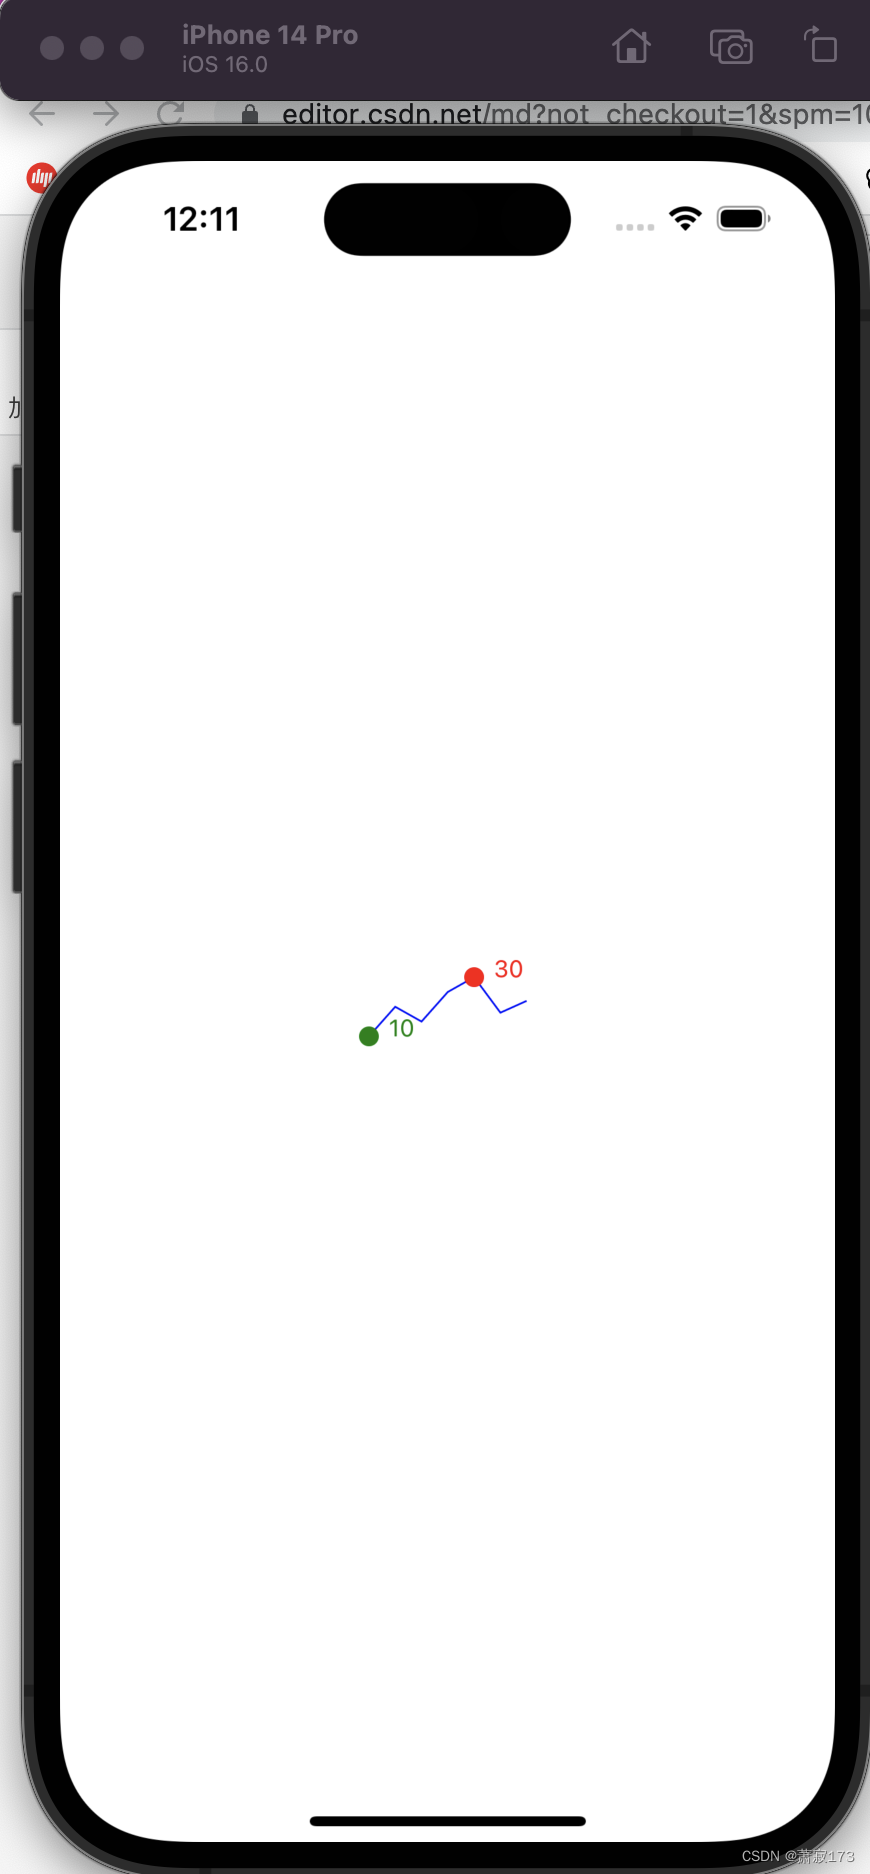
本质就是一张svg图片(只有直线型的折线和最高最低点)
下面贴代码吧
安装svg的npm依赖包
yarn add react-native-svg
LineChartWithValues.js代码如下
import React from 'react';
import {View, Text, StyleSheet, Dimensions} from 'react-native';
import Svg, {Path, Circle, Text as SvgText} from 'react-native-svg';

const LineChartWithValues = ({data, width, height}) => {
  // 计算最高点和最低点
  const maxValue = Math.max(...data);
  const minValue = Math.min(...data);

  // 获取屏幕宽度和高度(这里我不使用这个,因为我需要自定义这个图片宽高,因此我这里改成从父组件动态获取宽高的值)
  // const screenWidth = Dimensions.get('window').width;
  // const screenHeight = Dimensions.get('window').height;
  const screenWidth = width
  const screenHeight = height

  // 计算折线图的路径
  const path = `M ${screenWidth * 0.1},${screenHeight * 0.8} ${data
    .map(
      (value, index) =>
        `L ${
          screenWidth * 0.1 + index * ((screenWidth * 0.8) / (data.length - 1))
        },${
          screenHeight * 0.8 -
          ((value - minValue) / (maxValue - minValue)) * (screenHeight * 0.6)
        }`,
    )
    .join(' ')}`;

  // 计算最高点和最低点的坐标
  const maxPointX =
    screenWidth * 0.1 +
    data.indexOf(maxValue) * ((screenWidth * 0.8) / (data.length - 1));
  const maxPointY =
    screenHeight * 0.8 -
    ((maxValue - minValue) / (maxValue - minValue)) * (screenHeight * 0.6);
  const minPointX =
    screenWidth * 0.1 +
    data.indexOf(minValue) * ((screenWidth * 0.8) / (data.length - 1));
  const minPointY =
    screenHeight * 0.8 -
    ((minValue - minValue) / (maxValue - minValue)) * (screenHeight * 0.6);

  return (
    <View style={styles.container}>
      <Svg width={screenWidth} height={screenHeight * 0.9}>
        <Path d={path} stroke="blue" fill="none" />
        <Circle cx={maxPointX} cy={maxPointY} r={5} fill="red" />
        <Circle cx={minPointX} cy={minPointY} r={5} fill="green" />
        <SvgText x={maxPointX + 10} y={maxPointY} fontSize="12" fill="red">
          {maxValue}
        </SvgText>
        <SvgText x={minPointX + 10} y={minPointY} fontSize="12" fill="green">
          {minValue}
        </SvgText>
      </Svg>
    </View>
  );
};

const styles = StyleSheet.create({
  container: {
    alignItems: 'center',
    justifyContent: 'center',
    height: '100%',
  },
});

export default LineChartWithValues;
引入组件并使用
需要传入宽高和数据,数据就是[0,1,2,3,4,5]这种格式的
import React from 'react';
import { View } from 'react-native';
import LineChartWithValues from './LineChartWithValues';

const data = [10, 20, 15, 25, 30, 18, 22]; // 示例数据

const YourParentComponent = () => {
  return (
    <View style={{ flex: 1}}>
      <LineChartWithValues data={data} width={100} height={50}/>
    </View>
  );
};

export default YourParentComponent;
效果图
第二个版本
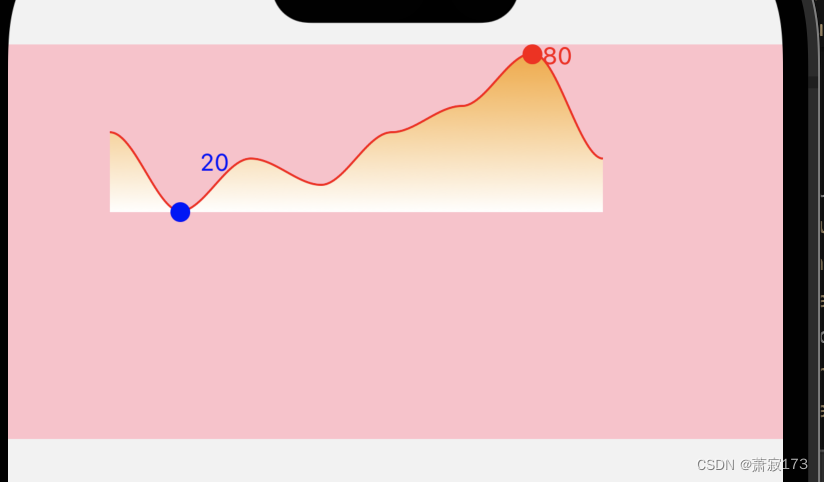
有丝滑的曲线和最高最低点以及渐变色
下面代码直接在页面运行就好,可以自行封装成组件,数据和宽高都从外部传入
import React from 'react'; // 引入 React 库
import { View, StyleSheet, Dimensions } from 'react-native'; // 引入所需的组件和样式表
import Svg, { Path, Circle, Text as SvgText, LinearGradient, Stop } from 'react-native-svg'; // 引入 SVG 组件

const GradientLineChart = () => {
  const data = [20, 40, 30, 50, 60, 80, 40]; // 数据点数组
  const padding = 20; // 边距值
  const width = 300 - 2 * padding; // 计算总宽度并减去边距
  const height = 200 - 2 * padding; // 计算总高度并减去边距
  const colors = ['#F9A633', '#FFFFFF']; // 渐变颜色数组
  const maxValue = Math.max(...data); // 获取最大值
  const minValue = Math.min(...data); // 获取最小值
  const numPoints = data.length; // 数据点数量
  const stepX = width / (numPoints - 1); // 计算每个数据点的 x 坐标间隔
  const offset = 20; // 最低点的偏移量

  const controlOffset = 30; // 控制点偏移量
  const bezierPath = data.map((value, index) => { // 创建贝塞尔曲线路径
    const x = padding + index * stepX; // 添加边距到 x 坐标
    const y = padding + height - ((value - minValue) / (maxValue - minValue)) * height; // 调整 y 坐标
    if (index === 0) { // 如果是第一个数据点
      return `M${x},${y}`; // 移动到起始点
    }
    const prevX = padding + (index - 1) * stepX; // 上一个数据点的 x 坐标
    const prevY = padding + height - ((data[index - 1] - minValue) / (maxValue - minValue)) * height; // 上一个数据点的 y 坐标
    const cpX1 = prevX + controlOffset; // 控制点 1 的 x 坐标
    const cpY1 = prevY; // 控制点 1 的 y 坐标
    const cpX2 = x - controlOffset; // 控制点 2 的 x 坐标
    const cpY2 = y; // 控制点 2 的 y 坐标
    return `C${cpX1},${cpY1} ${cpX2},${cpY2} ${x},${y}`; // 创建贝塞尔曲线段
  });

  const maxXIndex = data.indexOf(maxValue); // 最大值的索引
  const maxY = padding + height - ((maxValue - minValue) / (maxValue - minValue)) * height; // 最大值的 y 坐标
  const maxX = padding + maxXIndex * stepX; // 最大值的 x 坐标
  const minY = padding + height - ((minValue - minValue) / (maxValue - minValue)) * height - offset; // 调整最小值的 y 坐标
  const minX = padding + data.indexOf(minValue) * stepX; // 最小值的 x 坐标

  const gradientId = 'gradient' + Math.random().toString(36).substring(7); // 生成渐变 ID

  return (
    // 渲染一个 View 容器
    <View style={styles.container}>
    {/* 渲染 SVG 组件 */}
      <Svg width={300} height={200}>
      {/* 渲染线性渐变 */}
        <LinearGradient id={gradientId} x1="0%" y1="0%" x2="0%" y2="100%">
          {colors.map((color, index) => ( // 遍历颜色数组并创建渐变色块
            <Stop
              key={index}
              offset={`${(index * 100) / (colors.length - 1)}%`}
              stopColor={color}
            />
          ))}
        </LinearGradient>
        <Path
          d={`${bezierPath.join(' ')} L${padding + width},${padding + height} L${padding},${padding + height} Z`} // 创建路径并填充渐变色
          fill={`url(#${gradientId})`}
          stroke="transparent"
        />
        {/* 渲染最大值的圆圈 */}
        <Circle cx={maxX} cy={maxY} r={5} fill="red" />
        {/* 渲染最大值的文本 */}
        <SvgText x={maxX + offset / 2} y={maxY + offset / 2} fontSize="12" fill="red">
          {maxValue}
        </SvgText>
        {/* 渲染最小值的圆圈 */}
        <Circle cx={minX} cy={minY + offset} r={5} fill="blue" />
        {/* 渲染最小值的文本 */}
        <SvgText x={minX + offset / 2} y={minY + offset} fontSize="12" fill="blue">
          {minValue}
        </SvgText>
      </Svg>
    </View>
  );
};

const styles = StyleSheet.create({
  container: {
    alignItems: 'center', // 居中对齐
    justifyContent: 'center', // 居中对齐
    padding: 20, // 边距
  },
});

export default GradientLineChart;
效果图

带上边线的版本
import React from 'react'; // 引入 React 库
import {View, StyleSheet, Dimensions} from 'react-native'; // 引入所需的组件和样式表
import Svg, {
  Path,
  Circle,
  Text as SvgText,
  LinearGradient,
  Stop,
} from 'react-native-svg'; // 引入 SVG 组件

const GradientLineChart = () => {
  const data = [50, 20, 40, 30, 50, 60, 80, 40]; // 数据点数组
  const padding = 5; // 边距值
  const width = 250; // 计算总宽度并减去边距
  const height = 80; // 计算总高度并减去边距
  const colors = ['#F9A633', '#FFFFFF']; // 渐变颜色数组
  const maxValue = Math.max(...data); // 获取最大值
  const minValue = Math.min(...data); // 获取最小值
  const numPoints = data.length; // 数据点数量
  const stepX = width / (numPoints - 1); // 计算每个数据点的 x 坐标间隔
  const offset = 10; // 最低点的偏移量

  const controlOffset = 12; // 控制点偏移量
  const bezierPath = data.map((value, index) => {
    // 创建贝塞尔曲线路径
    const x = padding + index * stepX; // 添加边距到 x 坐标
    const y =
      padding + height - ((value - minValue) / (maxValue - minValue)) * height; // 调整 y 坐标
    if (index === 0) {
      // 如果是第一个数据点
      return `M${x},${y}`; // 移动到起始点
    }
    const prevX = padding + (index - 1) * stepX; // 上一个数据点的 x 坐标
    const prevY =
      padding +
      height -
      ((data[index - 1] - minValue) / (maxValue - minValue)) * height; // 上一个数据点的 y 坐标
    const cpX1 = prevX + controlOffset; // 控制点 1 的 x 坐标
    const cpY1 = prevY; // 控制点 1 的 y 坐标
    const cpX2 = x - controlOffset; // 控制点 2 的 x 坐标
    const cpY2 = y; // 控制点 2 的 y 坐标
    return `C${cpX1},${cpY1} ${cpX2},${cpY2} ${x},${y}`; // 创建贝塞尔曲线段
  });

  const maxXIndex = data.indexOf(maxValue); // 最大值的索引
  const maxY =
    padding + height - ((maxValue - minValue) / (maxValue - minValue)) * height; // 最大值的 y 坐标
  const maxX = padding + maxXIndex * stepX; // 最大值的 x 坐标
  const minY =
    padding +
    height -
    ((minValue - minValue) / (maxValue - minValue)) * height -
    offset; // 调整最小值的 y 坐标
  const minX = padding + data.indexOf(minValue) * stepX; // 最小值的 x 坐标

  const gradientId = 'gradient' + Math.random().toString(36).substring(7); // 生成渐变 ID

  return (
    // 渲染一个 View 容器
    <View style={styles.container}>
      {/* 渲染 SVG 组件 */}
      <Svg width={300} height={200}>
        {/* 渲染线性渐变 */}
        <LinearGradient id={gradientId} x1="0%" y1="0%" x2="0%" y2="100%">
          {colors.map(
            (
              color,
              index, // 遍历颜色数组并创建渐变色块
            ) => (
              <Stop
                key={index}
                offset={`${(index * 100) / (colors.length - 1)}%`}
                stopColor={color}
              />
            ),
          )}
        </LinearGradient>
        {/* 绘制上边线 */}
        {
          /*
            两种边线方式,下面有两个path,下面展开就是注释和不注释的意思
            1. 将两个path同时展开,给第一个path加一个stroke颜色,第二个path的stoke为transparent 则只保留图表的上边的线,也就是路径线
            2. 第一个path展不展开都行,不影响效果(简单来说就是没用了) 第二个path的stoke给个颜色,例如red 则会在当前区域内画个边框(整个区域块内)
            (博客下方有效果图,自行查看)
          */
        }
        <Path d={`${bezierPath.join(' ')}`} fill="none" stroke="red" strokeWidth={2}/>
        {/* 填充区域 */}
        <Path
          d={`${bezierPath.join(' ')} L${padding + width},${padding + height} L${padding},${padding + height} Z`}
          fill={`url(#${gradientId})`}
          stroke="red" // 设置为透明色
        />

        {/* 渲染最大值的圆圈 */}
        <Circle cx={maxX} cy={maxY} r={5} fill="red" />
        {/* 渲染最大值的文本 */}
        <SvgText
          x={maxX + offset / 2}
          y={maxY + offset / 2}
          fontSize="12"
          fill="red">
          {maxValue}
        </SvgText>
        {/* 渲染最小值的圆圈 */}
        <Circle cx={minX} cy={minY + offset} r={5} fill="blue" />
        {/* 渲染最小值的文本 */}
        <SvgText
          x={minX + offset / 1}
          y={minY - offset - 1}
          fontSize="12"
          fill="blue">
          {minValue}
        </SvgText>
      </Svg>
    </View>
  );
};

const styles = StyleSheet.create({
  container: {
    alignItems: 'center', // 居中对齐
    justifyContent: 'center', // 居中对齐
    backgroundColor: 'pink',
  },
});

export default GradientLineChart;
效果图1:带上边线版本
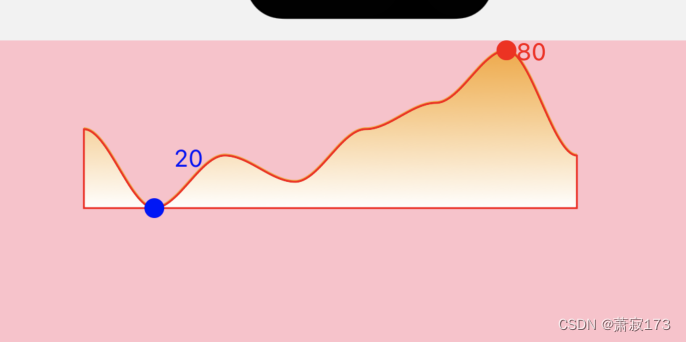
效果图2:带区域边框版本


 9万+
9万+


 被折叠的 条评论
为什么被折叠?
被折叠的 条评论
为什么被折叠?
 到【灌水乐园】发言


