


 本文详细介绍了R语言在统计作业中涉及的内容,包括数列生成与计算(如seq函数和自定义函数)、随机变量的生成和概率计算、矩阵操作(如矩阵生成、方程组求解和绘图)、文件操作、日期相关操作以及积分计算。通过实例展示了如何在R中实现这些功能。
文章目录
前言
基于本学期统计软件R的作业题目,系统复习R语言知识。(这里主要是计算题)
一、数列生成和计算
1.seq函数的用法
例1: Compute the sum of 2, 4, 6, 8, . . . , 200, then take the common (i.e., base 10) logarithm of the sum.
numbers<-seq(from=2,to=200,by=2)
sum<-sum(numbers)
logsum<-log10(sum)
print(logsum)
考点总结:
- seq函数的几个参数:by为等差数列的差值;
- log10函数表示取对数。
例2:Use the function cumprod to calculate 1 + 2/3+2/3 * 4/5+……+2/3 * 4/5 * ……30/31.
upper<-seq(2,30,by=2)
lower<-upper+1
single<-c(1,upper/lower)
sum(cumprod(single))
考点总结:
- 直接对向量执行+1操作,等效于对每个元素+1,返回一个等长的向量;
- 构成一个新的向量,只需要用c()把各个部分组合起来;
cumprod函数:计算向量中元素的累积积,返回一个具有与 x 相同长度的向量,其中每个元素都是从 x 的第一个元素开始到相应位置的元素的累积乘积。
思路点拨
遇到分数时,常常是分子和分母分开处理。
2.自定义函数
例1: Create a vector of the values of 3* sqrt(x)+e^(2*x)*cos(x) at x=0,0.1,0.2……,2.9,3
x<-seq(0,3,by=0.1)
f<-function(x)
{
  3*sqrt(x)+exp(2*x)*cos(x)
}
sapply(x,f)
考点总结:
- e的几次方函数:exp();
- sapply 函数用于对列表或向量的每个元素应用相同的函数,并返回结果,第一个参数是向量,第二个参数是函数f;
- r语言中,定义函数可以省略return,默认最后一行是返回值。
例2: Given any sequence, create a function to list the numbers that are evenly divisible by 15 and 25. Try out your function with the example (1, 2, 3, · · · , 200).
f<-function(seq){
  divisible_list<-seq[seq%%15==0 & seq%%25==0]
  return(divisible_list)
}
seq<-1:200
f(seq)
考点总结:
- 对一个向量的每一个元素执行操作,可以直接写成对向量执行操作;
- r中的整除用
%%来表示; - 函数返回值不要忘记加括号。
例3: Write a function myfunction such that if the vector xVec = (x1, …, xn), n ≥ 3, then myfunction(xVec) returns the vector of moving averages:(x1 + x2 + x3)/3,(x2 + x3 + x4)/3,……,(xn−2 + xn−1 + xn)/3.Try out your function; for example, try myfunction(c(1:10,11:1)).
myfunction<-function(xVec)
{
  n<-length(xVec)
  if(n<3)cat("invalid")
  averages<-numeric(n-2)
  for(i in 1:(n-2))
  {
    averages[i]<-(xVec[i]+xVec[i+1]+xVec[i+2])/3
  }
  return(averages)
}
myfunction(c(1:10,11:1))
考点总结:
- numeric 函数用于创建一个指定长度的数值向量,所有元素的初始值为0;
- r语言中for循环的使用:
for(i in begin : end); - cat函数用于输出内容。
二、随机变量
1.随机数生成
例1: Generate 20 random samples from the normal distribution N(0, 6). Then count the number of negative samples, and select the positive samples.
samples<-rnorm(n=20,mean=0,sd=sqrt(6))
negative<-sum(samples<0)
print(negative)
positive<-samples[samples>0]
print(positive)
考点总结:
- rnorm(n, mean, sd) :生成指定数量 n 的随机数, mean 是期望值(均值),sd 是标准差(注意不是方差!)。如果不指定 mean 和 sd,则默认为标准正态分布N(0,1);
- 计算有几个负数,可以用逻辑值求和sum(samples<0),所得值就是负数的数量;
- 取出所有的正数,只需要在数列的[]中加入筛选条件即可。
2.概率计算
例1 Calculate the probability P(−1 ≤ X ≤ 1) where X ∼ N(−1, 4). Find q such that P(Z > q) = 0.1, where Z ∼ Exp(3).
pnorm(1,mean=-1,sd=2)-pnorm(-1,mean=-1,sd=2)
qexp(0.9,rate=3)
考点总结:
- pnorm函数用于计算正态分布的累积分布函数,
pnorm(q, mean = 0, sd = 1)中q表示要计算的x的值,mean为均值,sd为标准差(注意不是方差!) - qexp用于计算指数分布的分位点(quantile),
qexp(p, rate = 1)中p表示要计算的累积概率,即指数分布随机变量落在这个值以下(注意是以下)的概率,rate表示指数分布的速率参数λ。
三、矩阵相关
1.矩阵生成和计算
例1: Create the following matrix A Calculate A*AT. Then add the fourth row as the sum of the second and third rows.
A=(1,1,……,1
2,2,……,2
3,3,……,3)3 * 10
A<-matrix(c(rep(1,10),rep(2,10),rep(3,10)),nrow=3,byrow = TRUE)
AAT<-A%*%t(A)
print(AAT)
AAT<-rbind(AAT,AAT[2,]+AAT[3,])
print(AAT)
考点总结:
matrix(data, nrow, ncol, byrow = FALSE, dimnames = NULL):创建一个矩阵,第一个参数是填入矩阵的数据(用向量来表示),第二、三个是行数和列数(数据个数确定后填一个就可以),byrow用于确定是否按行填写;- 矩阵的逆:
t(A)矩阵的乘法:%*%; rep函数用于创建重复的值或向量,第一个参数表示要重复的数,第二个表示重复次数;rbind函数将多个对象按行堆叠在一起,注意列数必须相同;- 矩阵两行相加,直接在[]中只填行数+’,‘即可表示对应行。
例2:Construct a matrix with 6 rows and 5 columns, all filled with random numbers from the uniform distribution U(−1, 1). Calculate the row means of this matrix and round the row means to three decimal places. Then compute the product of these values.
M<-matrix(runif(30,min=-1,max=1),nrow=6)
print(M)
row_means<-round(rowMeans(M),digits=3)
print(row_means)
prod(row_means)
考点总结:
- runif函数用于生成指定长度的随机均匀分布的数值向量,第一个参数是数值个数,第二个和第三个分别是下界和上界;
- round函数用于将数值四舍五入到指定的小数位数(digits);
- rowMeans用于计算矩阵各行均值,返回一个向量;
- prod函数用于计算数值向量中所有元素的乘积。
2.用矩阵计算方程组
例1: Solve the following system of linear equations
x1 + 2x2 + 3x3 + 4x4 + 5x5 = 3
2x1 + x2 + 2x3 + 3x4 + 4x5 = −1
3x1 + 2x2 + x3 + 2x4 + 3x5 = −2
4x1 + 3x2 + 2x3 + x4 + 2x5 = 0
5x1 + 4x2 + 3x3 + 2x4 + x5 = 6
by considering an appropriate matrix equation Ax = b. Please note that the matrix A has a special structure.
A<-matrix(0,5,5)
A<-abs(col(A)-row(A))+1
b <- c(3, -1, -2, 0, 6)
x <- solve(A, b)
print(x)
考点总结:
- 这里系数矩阵的构建注意到了矩阵的特殊形式:元素=|所在行-所在列|+1,所以先构建零矩阵,在对每个元素进行这个运算;
- 矩阵对每个元素进行计算可以直接用矩阵名来表示;
- col和row分别返回每个元素的行索引和列索引;
- solve()函数用于求解线性方程组或矩阵的逆,两个参数表示求解方程组,单独一个矩阵表示求逆。
三、外部文件操作
例1 Read in the dataset Orange using the read.table() function.
(1) Compute the mean value and variance of ages.
(2) Compute the median value of circumferences for Tree 3.
Orange<-read.table("Orange.csv",header=TRUE,sep = ",")
age_mean<-mean(Orange$age)
age_variance<-var(Orange$age)
MedianValue<-median(Orange$circumference[Orange$Tree==3])
print(age_mean)
print(age_variance)
print(MedianValue)
考点总结:
read.table函数在R中用于从文本文件中读取数据并创建数据框。第一个参数为文件名(加双引号),第二个参数header表示文件是否包括标题行,sep表示字段之间的分隔符。- 取数据框中的某一元素所有数据,用
$; - 计算均值函数
mean,计算方差函数var; - 取满足某一条件的类型,只需要在后面加上[],里面是要求的条件。
例2: In the example dataset CO2 in the datasets package, select all rows that satisfy the following two conditions: the treatment is nonchilled, and the carbon dioxide uptake rate (uptake) is within [10, 30). Then sort these rows by the ambient carbon dioxide concentration (conc) in descending order.
data("CO2",package="datasets")
select_rows<-CO2[CO2$Treatment=="nonchilled"&CO2$uptake>=10&CO2$uptake<30,]
sorted_rows<-select_rows[order(-select_rows$conc),]
print(sorted_rows)
考点总结:
- data()函数用于加载R包中预先包含的数据集,第一个参数表示要加载的数据集的名称,后续使用也用这个名字(注意要加双引号),第二个参数表示从哪个R包中导入。
- 选取满足条件的特定行,只需要在[]中对应行的位置写条件即可,中间用&或|隔开,注意不要忘记加
,!! - 按某元素倒序排,条件为order(-xx),也注意不要忘记加
,!!!
例3: For the dataset rainforest in the DAAG package, determine the number of all missing values. Count the number of missing values for each feature.
library(DAAG)
data("rainforest")
all<-sum(is.na(rainforest))
print(all)
each<-colSums(is.na(rainforest))
print(each)
考点总结:
- 没有默认导入的R包,要用library导入;
- is.na返回逻辑值0或1,因此计算所有缺失值个数只需要将它们累加即可;
- 对每个feature(每一列),只需要用colSums来计算列和即可。
五、绘图
例1:分别计算生成10的2次方到7次方个服从均匀分布的随机数的中位数绝对偏差所用的总时间,并绘制成折线图
k<-2:7
time<-numeric(6)
for(j in k)
{
  t<-system.time(for(i in 1:100)runif(10^j))
  time[j-1]<-t[["elapsed"]]
}
plot(k,time,type="o",pch=20,col=4)
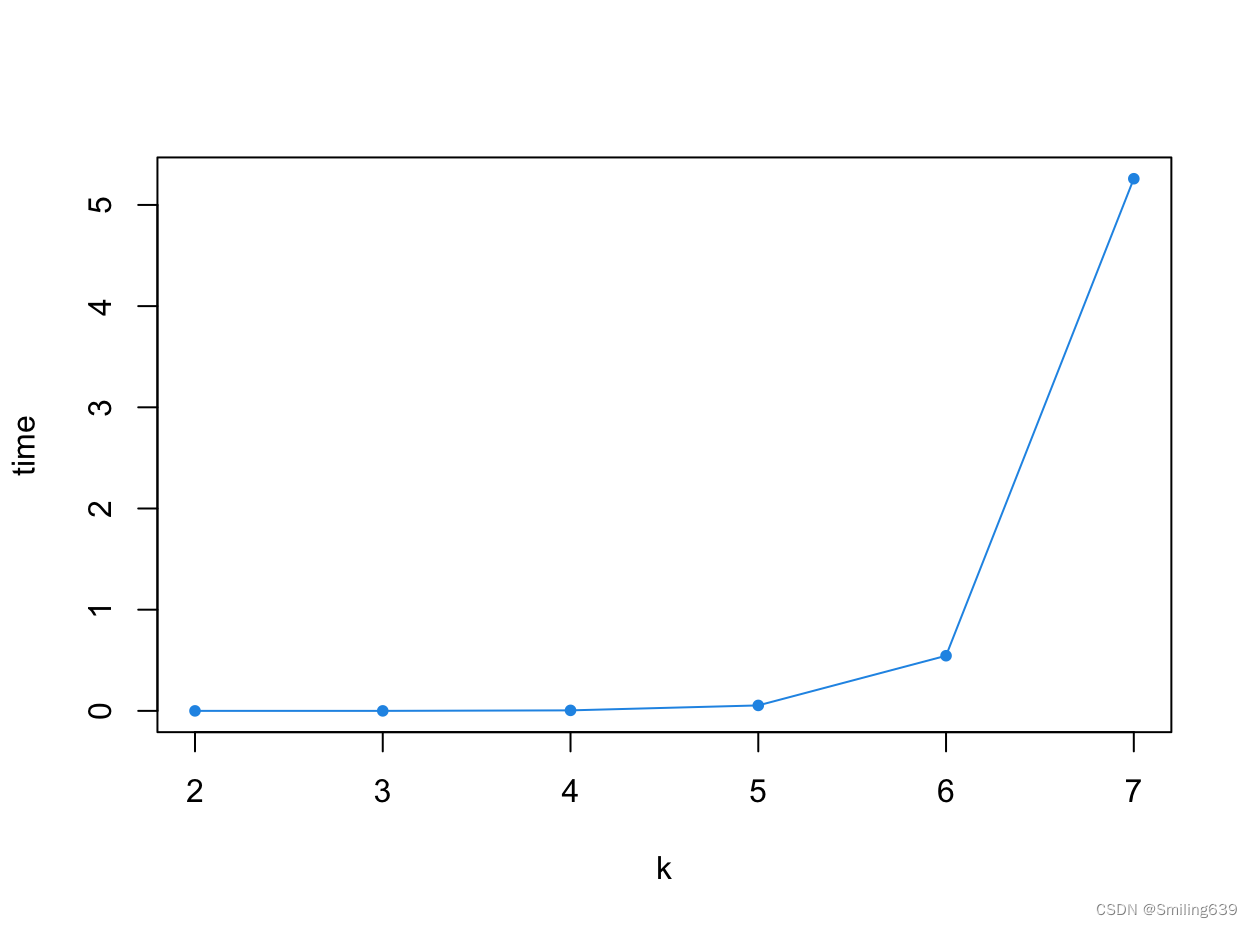
考点总结:
- 在 R 中,双中括号 [[ ]] 用于提取列表(list)中的元素。system.time() 返回的是一个列表,因此使用双中括号来访问列表中的特定元素,例如 “elapsed”,表示代码的运行时间。
六、其他考点
1.日期相关操作
Calculate the time interval between the following two dates: 1) “3-31-24”; 2) “15/4/2024”.
date1 <- as.Date("3-31-24", format = "%m-%d-%y")
date2 <- as.Date("15/4/2024", format = "%d/%m/%Y")
difftime(date1,date2)
考点总结:
- as.Date() 函数用于将日期表示的字符向量或其他格式转换为 R 中的标准日期对象
yyyy-mm-dd。as.Date(x, format)中,x表示要转化的字符向量(双引号),format表示当前的格式(见下方知识点补充)。 - difftime()函数用于计算两个日期或时间之间的时间间隔。
difftime(time1, time2, units = c("auto", "secs", "mins", "hours", "days", "weeks"))中,前两个表示要计算的日期,units表示计算的单位,默认为days。
知识点补充:
在R中,可以使用不同的格式来表示日期和时间,一些常见的格式包括:
%d:表示月份中的日期,使用两位数表示,例如01、02等。
%m:表示月份,使用两位数表示,例如01、02等。
%b:表示月份的缩写,例如Jan、Feb等。
%B:表示月份的全称,例如January、February等。
%y:表示年份的后两位数,例如21表示2021年。
%Y:表示完整的四位数年份,例如2021。
%H:表示小时(24小时制),使用两位数表示,例如00、01等。
%I:表示小时(12小时制),使用两位数表示,例如01、02等。
%M:表示分钟,使用两位数表示,例如00、01等。
%S:表示秒数,使用两位数表示,例如00、01等。
%p:表示AM/PM。
2.积分计算
例1:Given any positive value t, create a function f(t) to compute x^2*(x + 3)dx(0<x<t). Try out your function; for example, try f(2).
f<-function(t)
{
  integrand<-function(x)
  {
    return(x^2*(x + 3))
  }
  integrate(integrand,lower=0,upper=t)
}
f(2)
考点总结:
- integrate()函数用于数值积分,
integrate(integrand, lower, upper, ...)中,integrand是被积函数(需要提前定义),lower和upper是积分的上下界。 - 输出的结果是
12 with absolute error < 1.3e-13,要只输出12,需要取result$value。


 1408
1408

 被折叠的 条评论
为什么被折叠?
被折叠的 条评论
为什么被折叠?
 到【灌水乐园】发言


