%matplotlib  inline
import pandas as pd
import geopandas as gpd
from geopandas import GeoDataFrame, read_file
from geopandas.tools import sjoin
from shapely.geometry import Point, mapping,shape
import time
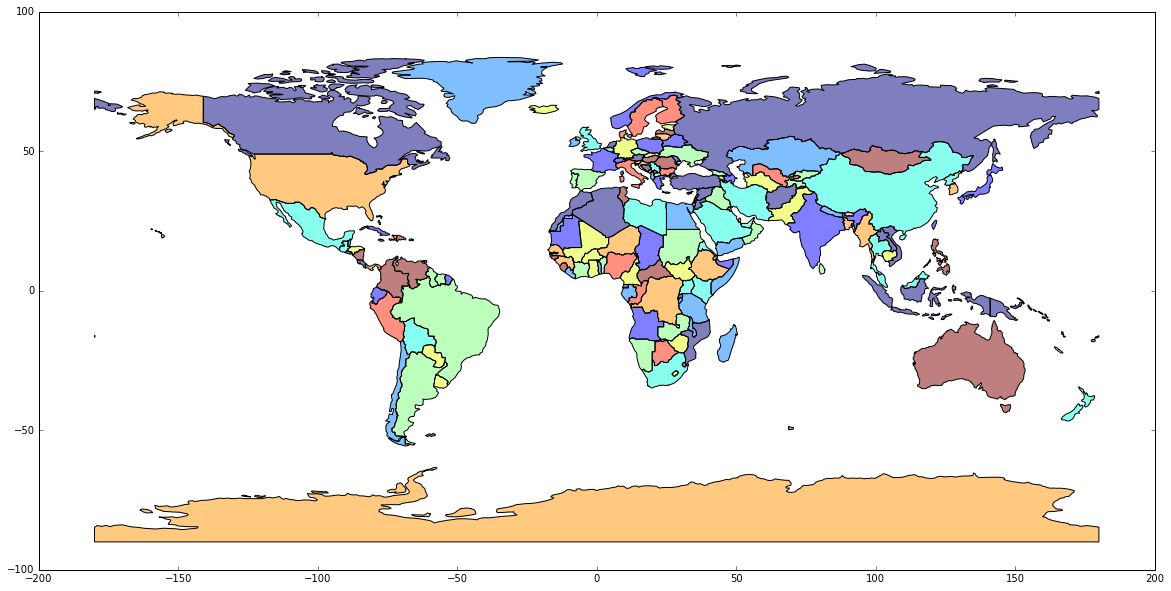
world = gpd.read_file(gpd.datasets.get_path('naturalearth_lowres'))
cities = gpd.read_file(gpd.datasets.get_path('naturalearth_cities'))
world.head()
continent
gdp_md_est
geometry
iso_a3
name
pop_est
0
Asia
22270.0
POLYGON ((61.21081709172574 35.65007233330923,…
AFG
Afghanistan
28400000.0
1
Africa
110300.0
(POLYGON ((16.32652835456705 -5.87747039146621…
AGO
Angola
12799293.0
2
Europe
21810.0
POLYGON ((20.59024743010491 41.85540416113361,…
ALB
Albania
3639453.0
3
Asia
184300.0
POLYGON ((51.57951867046327 24.24549713795111,…
ARE
United Arab Emirates
4798491.0
4
South America
573900.0
(POLYGON ((-65.50000000000003 -55.199999999999…
ARG
Argentina
40913584.0
from geopandas import GeoDataFrame as df
# from pandas import DataFrame as dffrom geopandas.geoseries import Point
df1 = df.set_geometry([Point(0,0), Point(1,1), Point(2,2)])
df2 = df.set_geometry('geom1')


 515
515

 被折叠的 条评论
为什么被折叠?
被折叠的 条评论
为什么被折叠?
 到【灌水乐园】发言


